
Abstract
Abstract
Bariatric surgery leads to a loss of excess weight and to a remission of diabetes in a majority of patients. In an attempt to explain these underlying mechanisms, a broad range of metabolic alterations have been suggested. We aimed to investigate short-term changes in the urinary metabolome after bariatric surgery. Data for 50 patients who underwent bariatric surgery at the Municipal Hospital of Dresden-Neustadt, Germany, were used. Healthy controls were selected from the Study of Health in Pomerania. Non-fasting, spontaneous urine samples were collected, 1H NMR spectroscopic analysis was performed, and metabolites were quantified (Chenomx NMR suite). Orthogonal projections to latent structures discriminant analysis (OPLS-DA) models were carried out (pre-operative versus controls, and post-operative versus controls). On the basis of the urine metabolome separations between pre-operative (predictive ability Q2Y=85.6%; total explained variance R2X=58.3%), or post-operative (Q2Y=82.1%; R2X=44.4%) and controls were possible. Metabolites including hippuric acid, 3-hydroxybutyrate, 2-hydroxyisobutyrate, and trigonelline, were altered among patients. In obese patients, 2-hydroxyisobutyrate levels were higher, whereas trigonelline and hippuric acid levels were lower than in controls. The highest levels of 3-hydroxybutyrate were found in post-operative samples, whereas the metabolite was not present in controls, and only at low levels in pre-operative samples. In conclusion, we demonstrated that the urinary metabotype differs between obese patients and healthy controls. The metabolic alterations identified after bariatric procedures increase our knowledge about the metabolic traits associated with weight reduction. Whether urinary metabotypes might be used for early prediction of a successful bariatric procedure should be evaluated in long-term observations.
Introduction
Nuclear magnetic resonance (NMR) spectroscopy and mass spectrometry (MS) represent techniques used to comprehensively investigate metabolic profiles. Both techniques give complementary snapshots of the metabolome of body fluids, including plasma, urine, or cerebrospinal fluid (Bictash et al., 2010). Recently, we have reported genome-wide association studies of metabolic traits in human serum by MS, demonstrating specific and clearly differentiated metabolic phenotypes termed “genetically-determined metabotypes” (Illig et al., 2010).
As was recently demonstrated by 1H NMR spectroscopy, such metabotypes are also present in human urine (Suhre et al., 2011). A study provides evidence that metabolites measured by liquid chromatography MS predicted incident T2DM in a large population-based cohort, and thus are related to metabolic changes (Wang et al., 2011). This study suggested that metabolic profiling could aid in diabetes risk assessment. Another study found an obese-specific urinary metabolic phenotype, and was able to discriminate between obese and lean subjects using a NMR-based metabolic profile (Calvani et al., 2010). The latter study suggested strong changes in the urinary metabolic profile after bariatric surgery in two cases.
The aim of the present study was to investigate short-term changes in the urinary metabotype among patients undergoing bariatric surgery, and to compare the metabolic profiles to healthy lean controls.
Materials and Methods
Study population
Data for 50 patients who underwent bariatric surgery (sleeve gastrectomy [n=39]; Roux-en-Y gastric bypass [n=11]) in 2009 and 2010 at the Municipal Hospital of Dresden-Neustadt, Germany, were used for the study. All participants gave written informed consent before taking part in the study, and the study was approved by the Ethics Commission of the State Chamber of Medicine in Saxonia (EK-BR-14/09-1). The patients were between 22 and 63 years of age. Data were collected before surgery (pre-operative), and after surgery (post-operative). Data were collected on days 3 (n=38), 4 (n=8), 5 (n=38), 6 (n=2), 7 (n=1), or 9 (n=1) post-surgery. Information on diabetes, medication use, anthropometric data, and various blood measurements were collected from medical patient files.
Fifty controls were identified from the Study of Health in Pomerania, a population-based cohort study in northeast Germany. Details of the study design and data collection are given elsewhere (Völzke et al., 2011). Based on the total study population of 4308 subjects, the controls were selected by applying the following two criteria: (1) body mass index (BMI) between 18.5 and 25 kg/m2, and (2) time of blood drawn before noon. The controls were matched for age and sex with each bariatric surgery patient.
Sample collection and preparation of urinary specimens for NMR analysis
Non-fasting, spontaneous urinary samples were collected. For spectroscopic analysis, we mixed 450 μL urine with 50 μL phosphate buffer to stabilize the urinary pH at 7.0 (±0.35). The buffer was prepared with D2O, and contained sodium 3-trimethylsilyl-(2,2,3,3-D4)-1-propionate (TSP). All spectroscopic analyses were performed in Greifswald, Germany.
1H NMR spectroscopic analysis of urinary specimens
Spectra were recorded on a Bruker DRX-400 NMR spectrometer (Bruker BioSpin GmbH, Rheinstetten, Germany) operating at a 1H frequency of 400.13 MHz, and equipped with a 4-mm selective inverse flow probe (FISEI, 120 μL active volume) with z-gradient. Specimens were automatically delivered to the spectrometer via flow injection. The acquisition temperature was set to 300°K. A standard one-dimensional 1H NMR pulse sequence with suppression of the water peak (NOESYPRESAT) was used: RD−P(90°)−4 μsec−P(90°)−tm−P(90°)−acquisition of the free induction decay (FID). The non-selective 90° hard pulse P(90°) was adjusted to 9.4 μsec. The relaxation delay (RD), the mixing time (tm), and the acquisition time were set to 4 sec, 100 msec, and 3.96 sec, respectively, resulting in a total recycle time of ∼8.0 sec. Low-power continuous-wave irradiation on the water resonance at an RF-field strength of ∼25 Hz was applied during RD and tm for pre-saturation. After application of 4 dummy scans, 32 FIDs were collected into 32,768 (32k) complex data points using a spectral width of 20.689 parts per million (ppm). FIDs were multiplied with an exponential function corresponding to a line broadening of 0.3 Hz before Fourier transformation. Spectra were processed within TOPSPIN 1.3 (Bruker BioSpin).
Bucketing of 1H NMR spectra
Spectra were normalized to the NMR signal intensity of the CH3-group of creatinine to compensate for the large variations in urine concentrations, and then segmented into n=1000 consecutive integrated spectral regions (buckets) of fixed bucket width (0.009 ppm), covering the range from 0.5 ppm to 9.5 ppm (MATLAB 7.0; Mathworks, Natick, MA). The 4.5−5.1 ppm chemical shift region was left out of the analysis in order to remove effects of variations in the suppression of water resonance, and variations in the urea signal caused by partial cross-solvent saturation through solvent-exchanging protons.
Statistical analysis
Statistical analyses were done on the basis of the buckets and performed with SIMPCA P+12.0 (Umetrics AM, Umeå, Sweden). In a first step, principal component analyses (PCA) class models on the buckets table (
Results
Outlier detection
Three PCA models for every class were calculated to identify outliers. According to the DModX and Hotelling's T2 plots, three pre-operative, five post-operative, and two control samples were detected as outliers and excluded from the analyses. In total, 47 pre-operative spectra and 45 post-operative spectra were compared to spectra from 48 controls.
General characteristics
Pre-operatively, patients had a 26-point higher BMI (median 48.3 kg/m2; Q1 42.9 kg/m2, Q3 52.5 kg/m2) than controls (median 22.7 kg/m2; Q1 1.2 kg/m2, Q3 23.7 kg/m2), and a 80-kg higher median weight (140 kg; Q1 122 kg, Q3 154 kg) than controls (61 kg; Q1 57 kg, Q3 68 kg). Compared to the controls, patients took more medication (number of drugs in patients: 5; Q1 4, Q3 10; in controls: 1; Q1 0, Q3 2).
Patients versus controls
Three OPLS-DA studies were performed: (1) pre-operative status versus controls; (2) post-operative status versus controls; and (3) pre-operative versus post-operative status. The first model consisted of 1 predictive and 6 orthogonal components, and had a predictive ability Q2Y=85.6%, as well as a total explained variance R2X=58.3%. Further, the model showed that the variance related to the class separation (cases or controls) was R2pX=10.4% (Fig. 1A). The second model had 1 predictive and 2 orthogonal components. The predictive ability was Q2Y=82.1%, and the total explained variance was R2X=44.4%, and R2pX=14.7%, and was related to differences between post-operative patient status and control samples (Fig. 1B). The third model consisted of 1 predictive and 6 orthogonal components, and had a predictive ability Q2Y=71.7%, as well as a total explained variance R2X=44.1%. Further, the model showed that the variance related to the class separation (pre- or post-operative) was R2pX=11.9% (Fig. 1C).
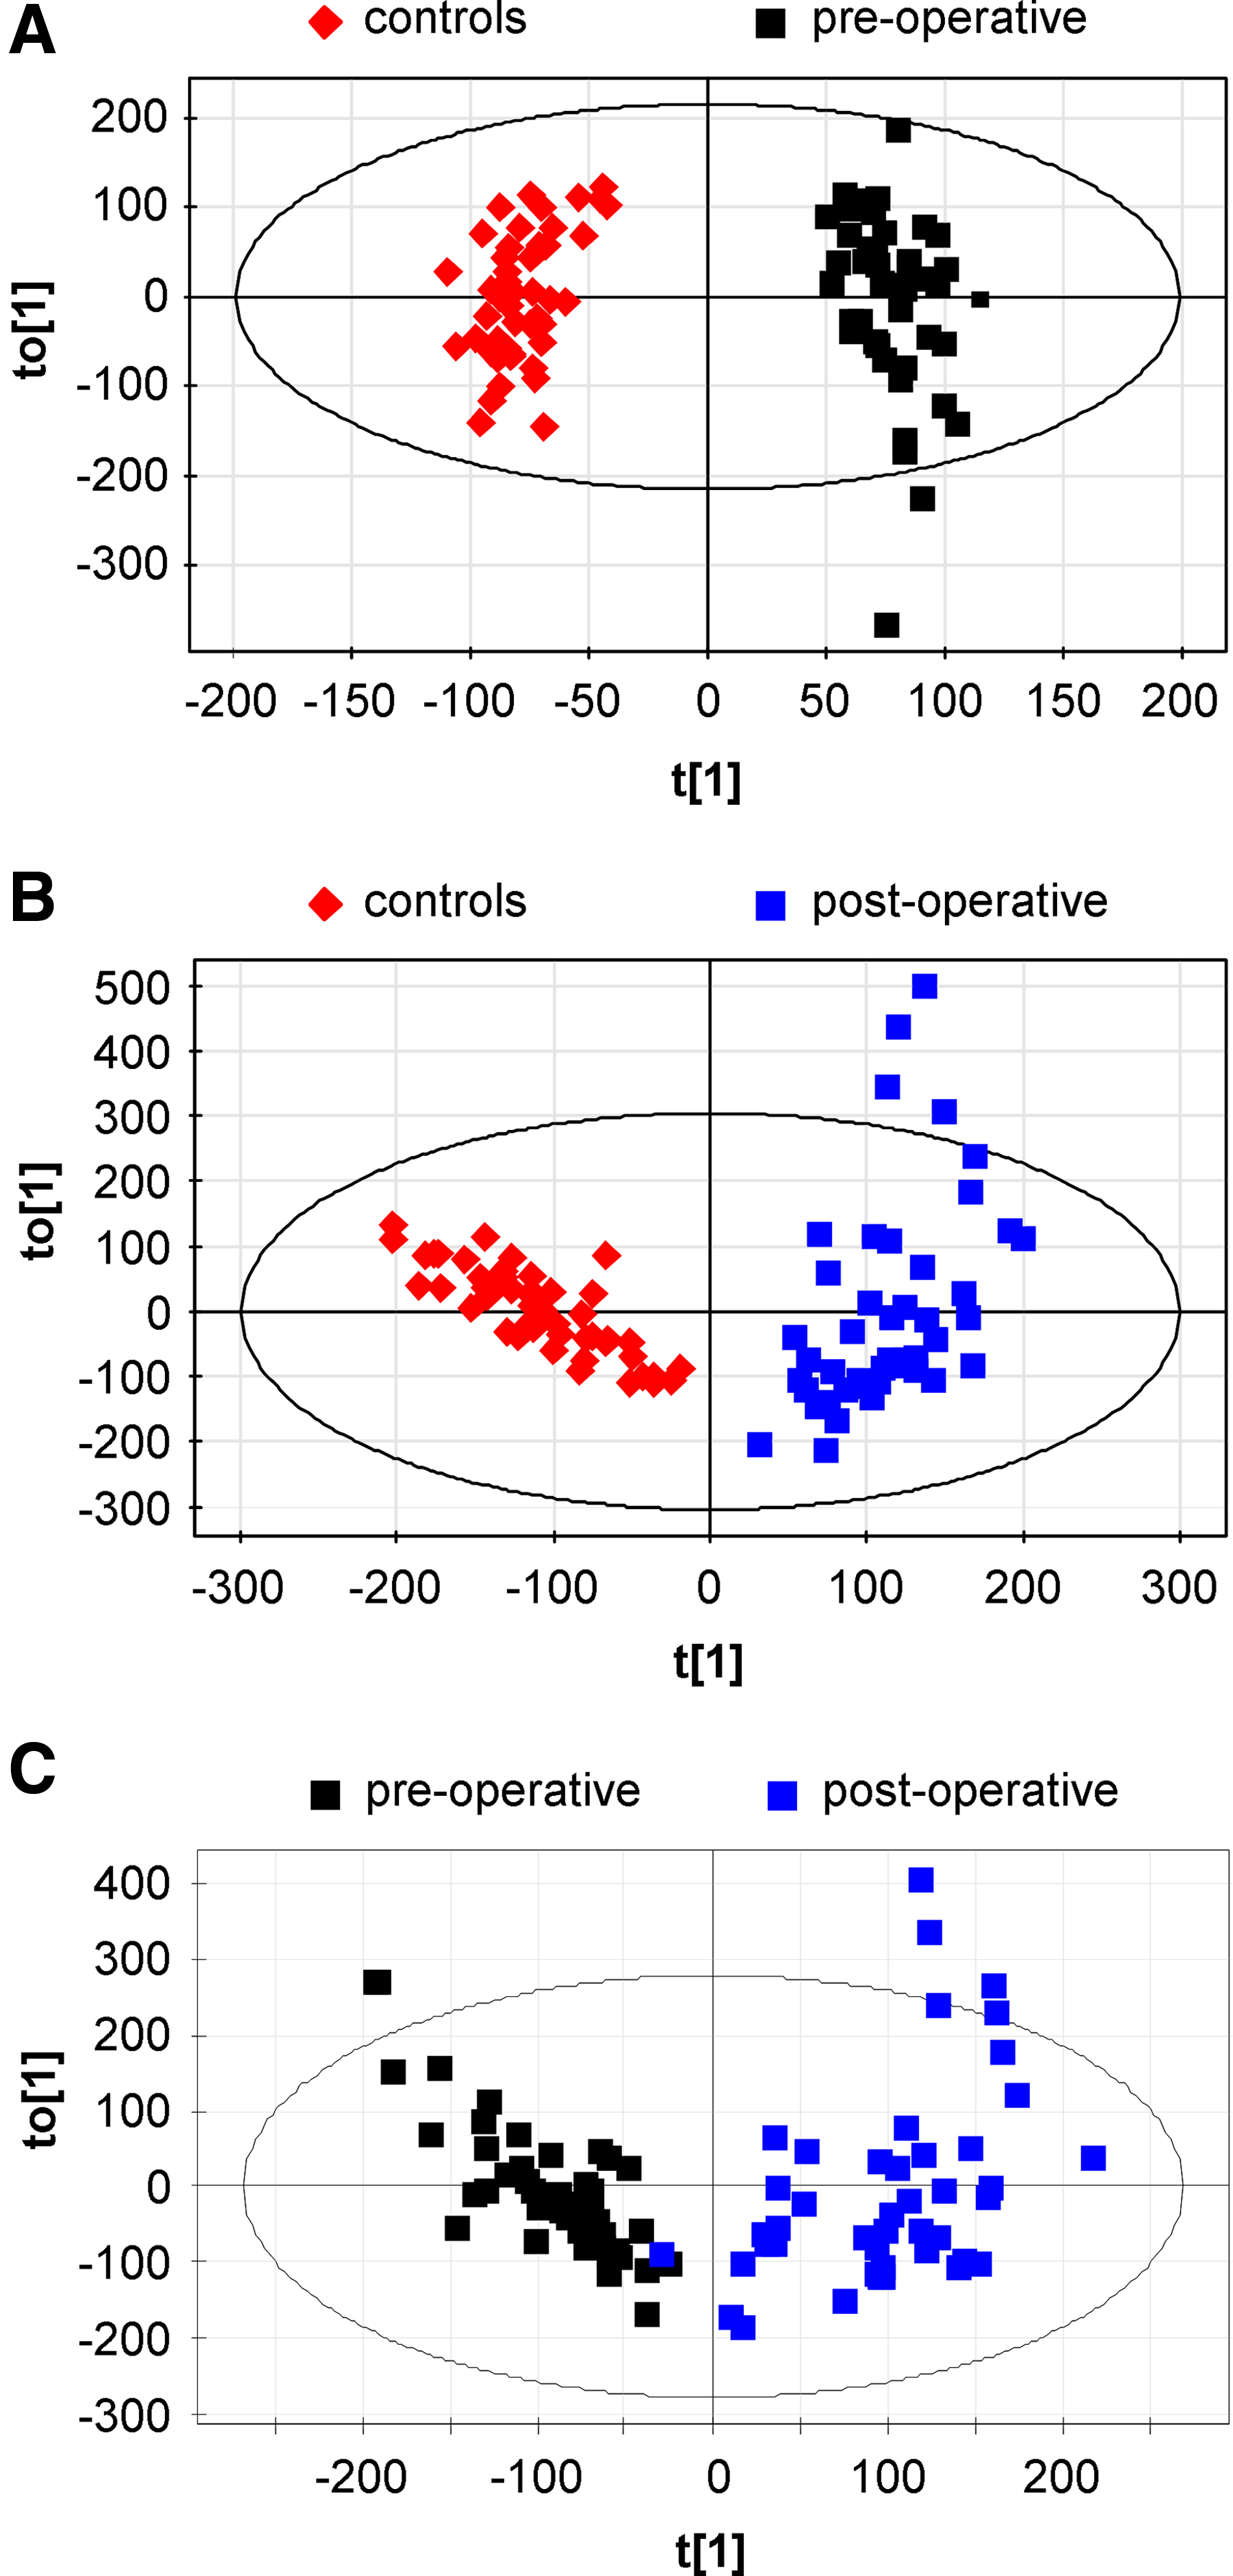
OPLS-DA score plots for pre-operative versus control samples (
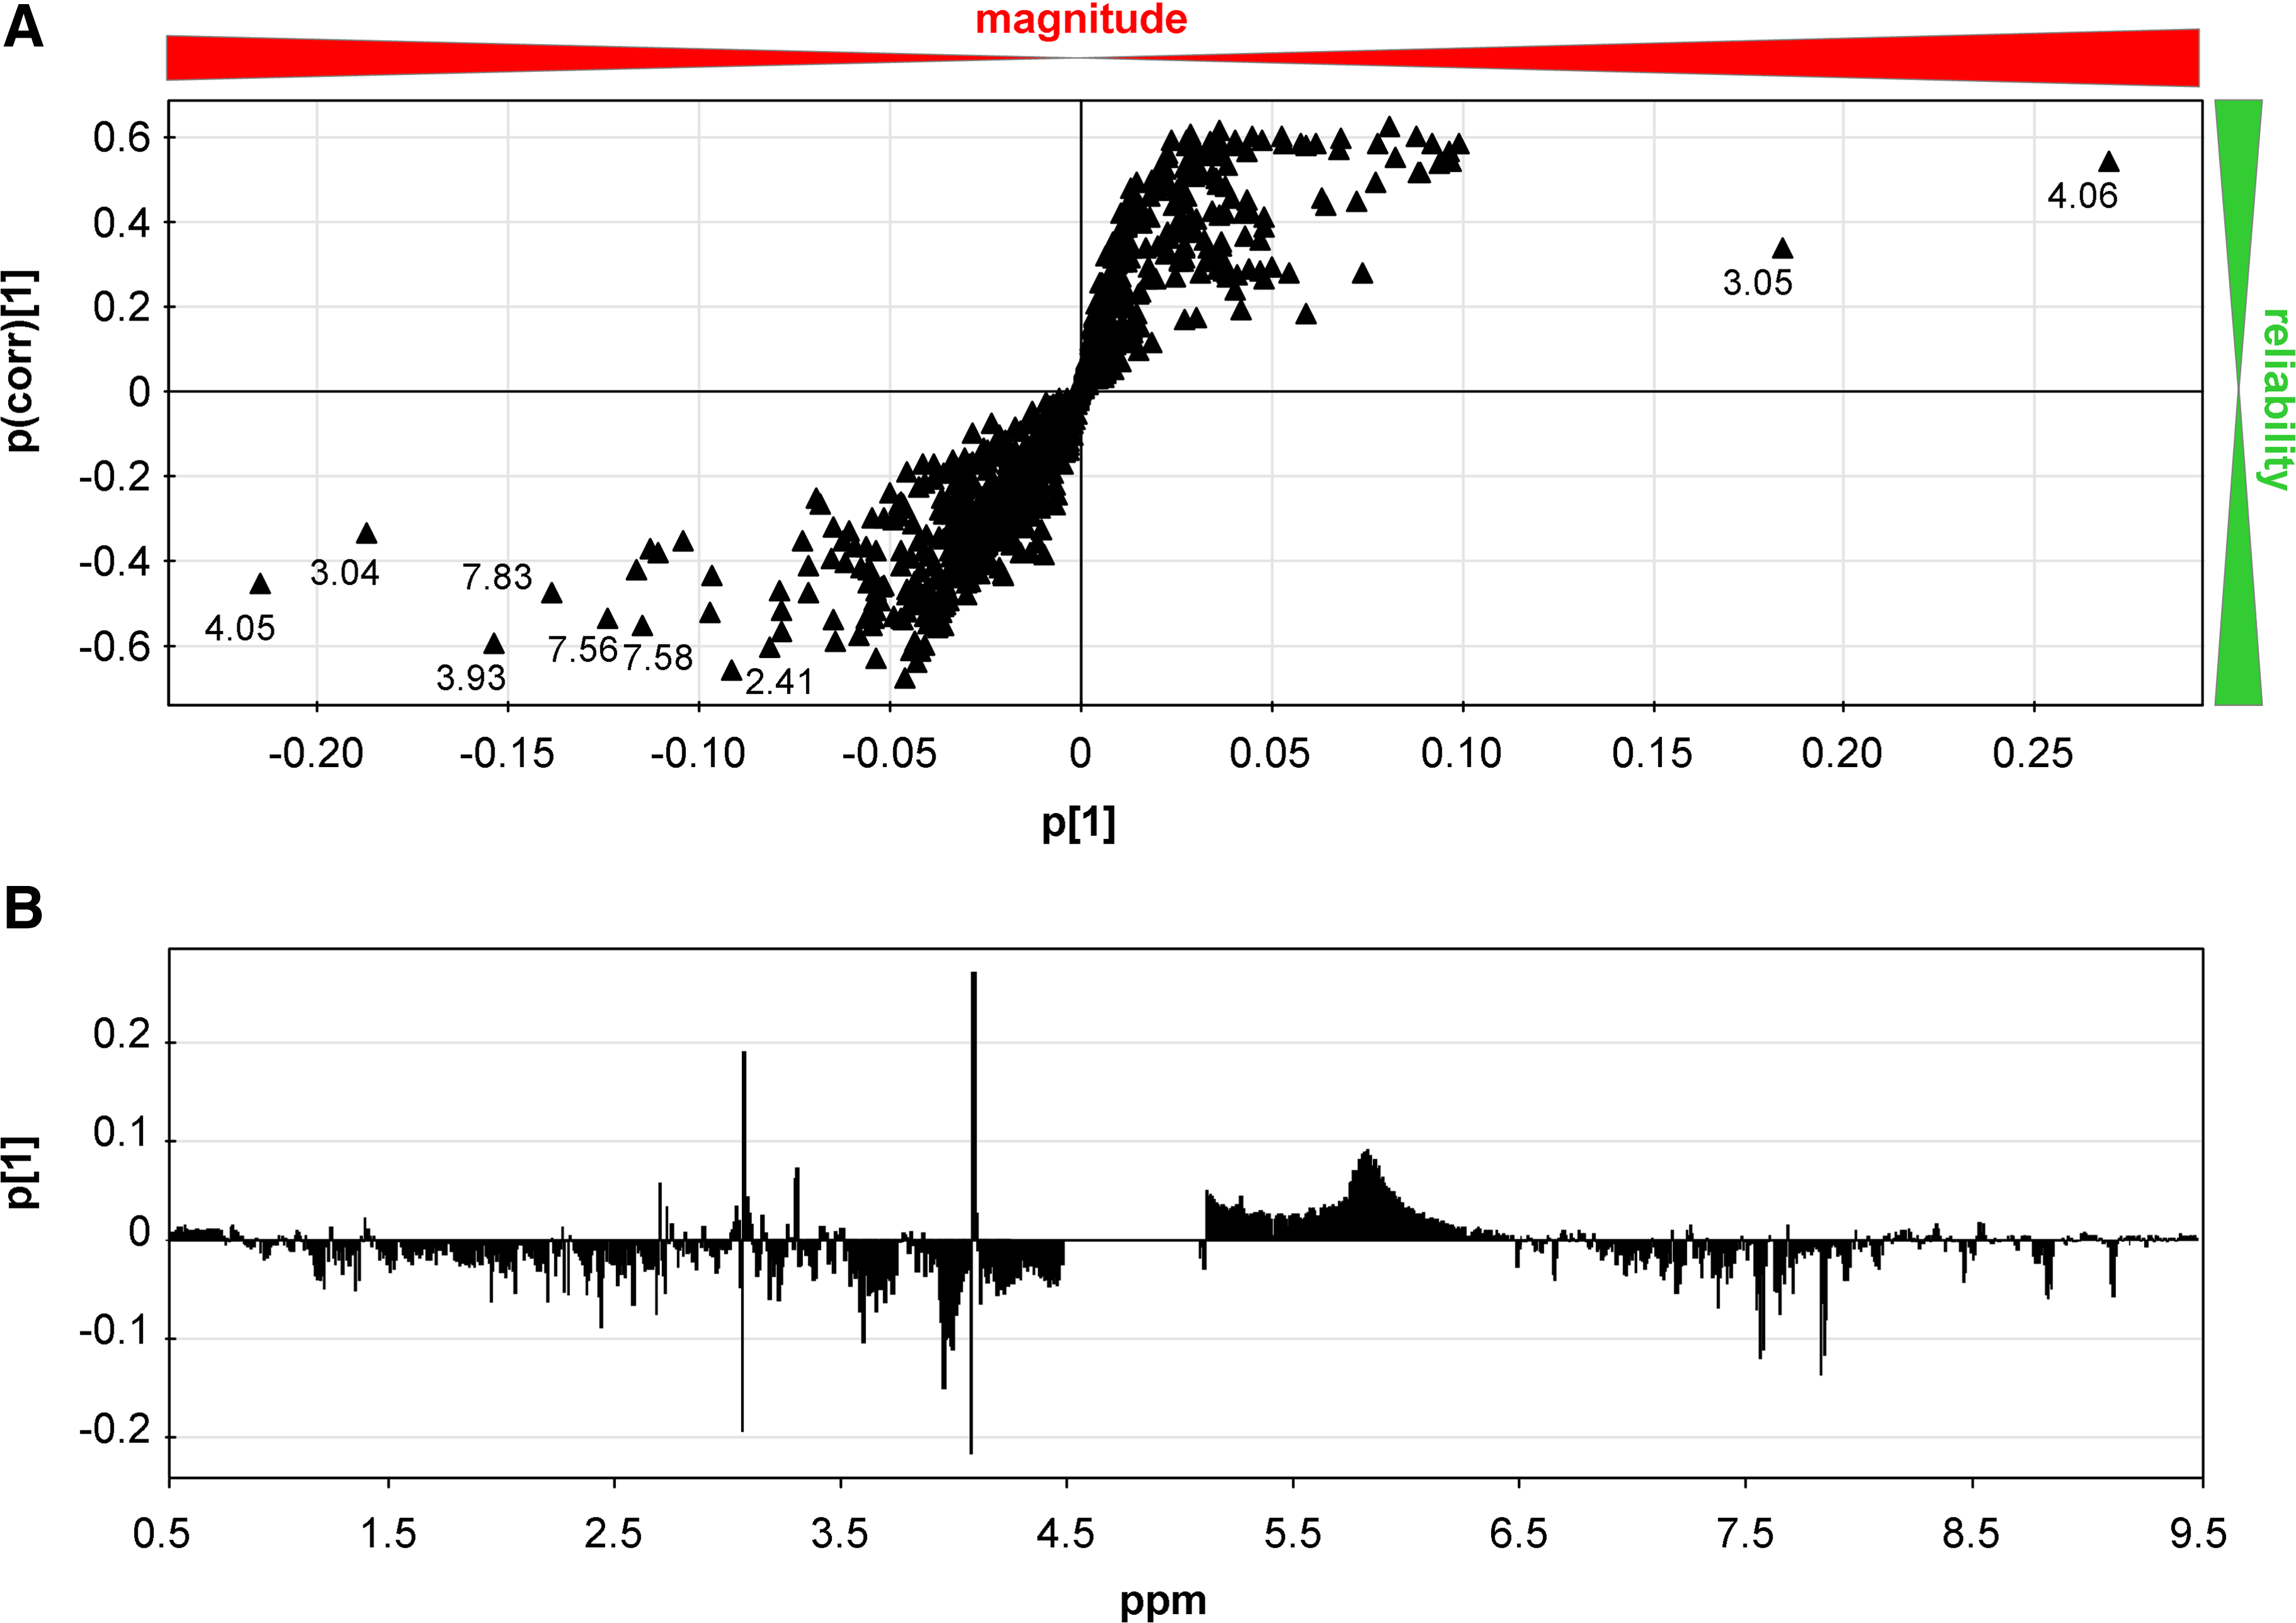
Figures 2, 3, and 4 display the loadings along the predictive components and the corresponding S-plot for all models. The loading plot gives an overview over the chemical shift regions that contributed to the separation between the classes and revealed both up- and downregulated areas of the spectra. For the pre-operative versus controls model the most pronounced region is between 7.5 and 7.9 ppm, with an observed downregulation, and the regions around 3.0 and 4.0 ppm, with both observed up- and downregulations. These regions also showed the highest contribution to the model and were highly reliable (Fig. 2A). With respect to the post-operative versus controls model stronger effects were found. Along with the pre-operative model, the regions 7.5 to 7.9 ppm were highly reliable, and showed up- and downregulated parts (Fig. 3A). Further strongly upregulated clusters were found between 2.1 and 2.5, 3.3 and 3.5, and 1.15 and 1.25 ppm (Fig. 3B). These regions were also identified in the third model (Fig. 4A and B). Thus the PCA and OPLS-DA models revealed a good separation between pre-operative, post-operative, and control samples.
(

(

(
Based on 5000 buckets, average creatinine-normalized spectra for pre-operative, post-operative, and control samples were plotted, and chemical shift regions contributing to the separation between the classes were displayed in detail (Fig. 5). Using Chenomx NMR suite 6.1 (Chenomx Inc., Edmonton, Alberta, Canada), metabolites including hippuric acid (4.0 and 7.5 to 7.9 ppm), 3-hydroxybutyrate (3-HB, beta-hydroxybutyric acid; 1.20, 2.2 to 2.4, and 4.15 ppm), and glycine (3.54 ppm) were identified in these regions. Together with trigonelline and 2-hydroxyisobutyrate (2-HIBA, 2-hydroxyisobutyric acid), reported by Calvani and colleagues (Calvani et al., 2010), these metabolites were quantified. Unfortunately no database listed the metabolites found in the region 3.3 to 3.5.
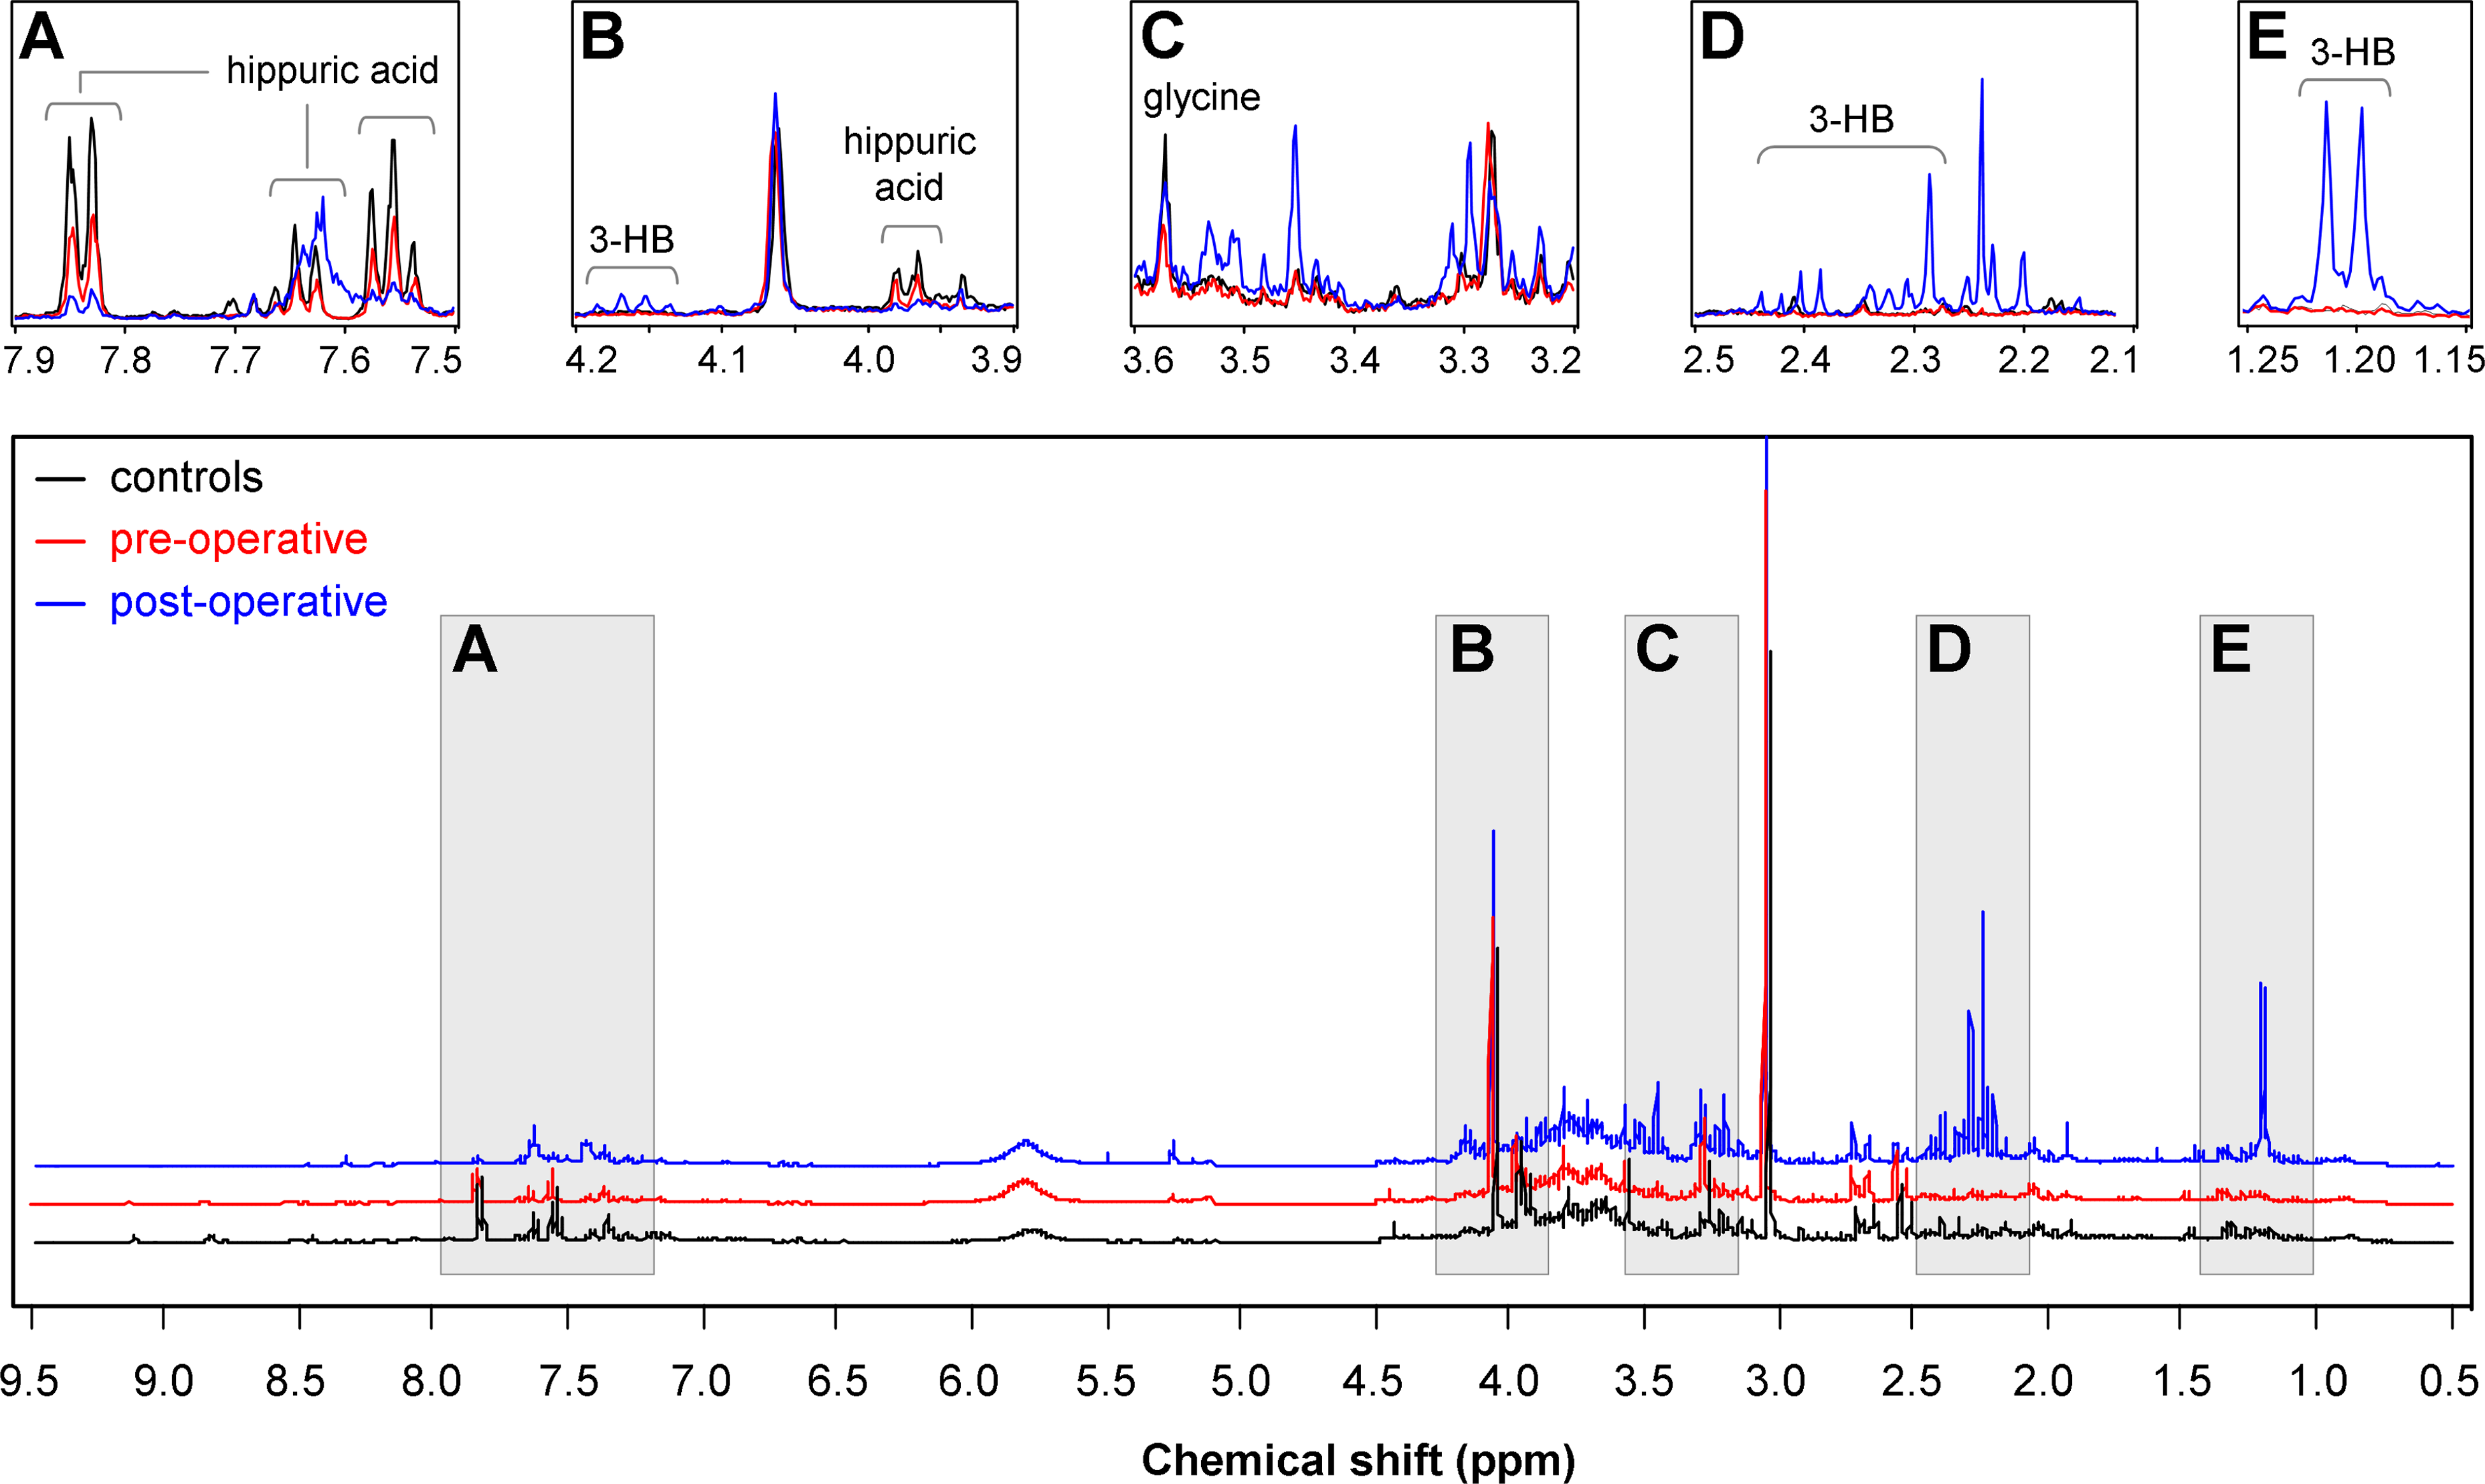
Mean nuclear magnetic resonance spectra for pre-operative, post-operative, and control urine samples, based on 5000 buckets. Regions
Comparisons between metabolite levels confirmed the OPLS findings, and showed differences between all groups (Fig. 6). Strong differences were found for 3-HB, with post-operative samples revealing by far the highest levels, whereas this metabolite was not found in controls, and was rarely present in pre-operative samples. With respect to 2-HIBA, no difference was found between the control and pre-operative groups; however, post-operative samples had higher levels compared to the pre-operative and control samples. The opposite was found for trigonelline (N1-methylnicotinic acid), hippuric acid (hippurate), and glycine (Gly), for which both pre- and post-operative samples showed lower median levels compared to the control samples, with trigonelline and hippuric acid nearly absent in all post-operative samples.
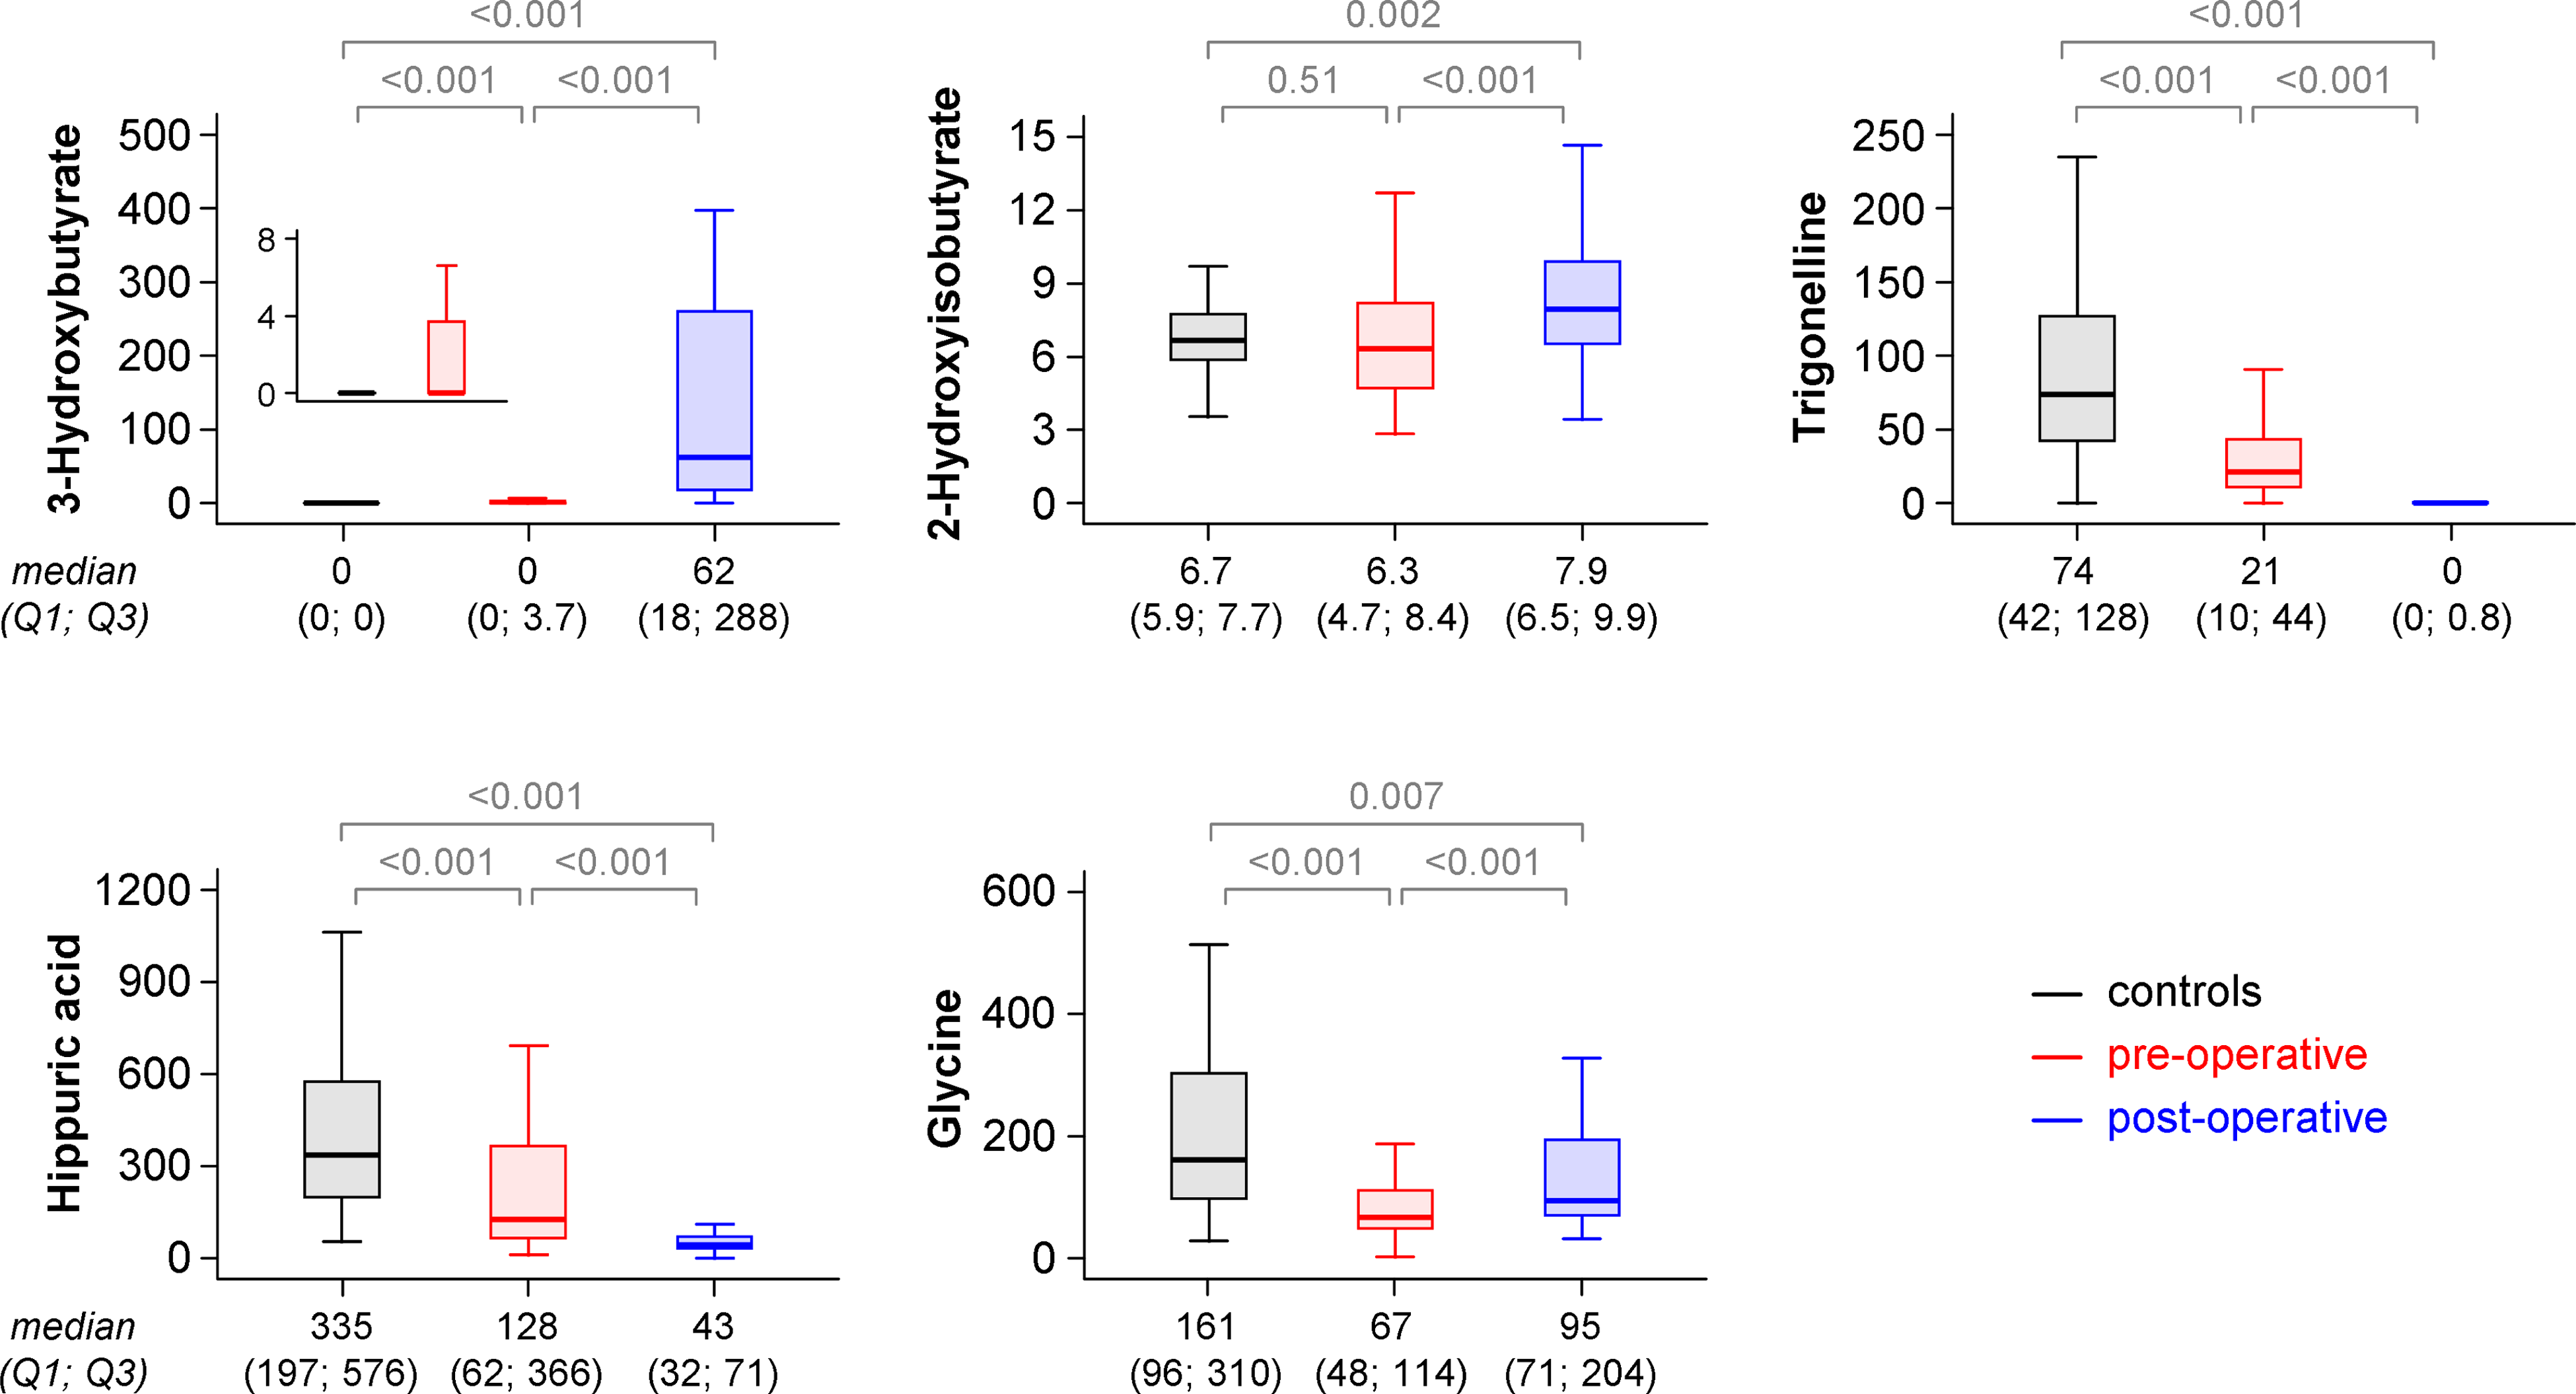
Box plots of levels of 3-hydroxybutyrate (3-HB), 2-hydroxyisobutyrate, trigonelline, hippuric acid, and glycine in mmol/mol creatinine for pre-operative, post-operative, and control urine samples. Comparisons between metabolite levels were performed with the Mann-Whitney U test (controls versus pre/post-operative), and Wilcoxon's test for paired samples (pre- versus post-operative).
Discussion
In the present study of 50 morbidly obese patients who underwent bariatric surgery, we demonstrated that the urinary metabotype differs between obese subjects and healthy controls. In addition, bariatric surgery is associated with short-term changes of metabolism detectable in the metabolite profiles in severely obese patients. To the best of our knowledge this is the first study in this field of research applying 1H NMR spectroscopy as a profiling technology, complementary to MS, that provides comprehensive coverage of the human metabotype (Suhre et al., 2011).
In a recent case report of two obese patients who underwent bariatric procedures, urinary metabolic profiles were determined using 1H NMR. The authors suggested that gut flora-derived metabolites such as hippuric acid, trigonelline, 2-HIBA, and xanthine differ in comparison with lean controls, as well as the corresponding pre-operative status (Calvani et al., 2010). Partly in accord with that report (Calvani et al., 2010), we identified five metabolites that discriminated obese patients from healthy controls. Two out of five detected metabolites (3-HB and 2-HIBA) are related to short-term metabolic changes and starvation after bariatric surgery. The other three metabolic compounds may provide new insights into the short-term changes seen following bariatric surgery or the metabolic basis of obesity and T2DM.
In detail, we observed a strong post-operative increase in 3-HB concentration, a carboxylic acid belonging to the ketone bodies (Laffel, 1999), that is produced as a by-product when fatty acids are broken down for energy generation in the liver and kidney during fasting. 3-HB serves as an important source of energy in the heart and brain, particularly in a state of low blood glucose. The increase in urinary 3-HB seen following bariatric surgery suggests a shift in energy metabolism from anabolic to catabolic status, reflecting the reorientation of metabolism occurring during starvation, which might have been expected. Starvation ketoacidosis is a rare cause of metabolic acidosis, which has been shown in several case reports of gastric banding (Bruegger et al., 2004; Lulsegged et al., 2011). With respect to energy uptake, gastric banding has a less strong effect, and achieves less weight loss compared to other bariatric procedures (Runkel et al., 2011). Besides post-operative differences, we also found higher 3-HB values in pre-operative patient samples than in controls. These findings are in accord with the higher levels of 3-HB seen in T2DM patients compared to healthy volunteers (Salek et al., 2007). Furthermore, db/db mice, characterized by a defect in the leptin receptor and consequently by obesity and subsequent insulin resistance, exhibit higher urinary excretion of 3-HB than wild-type mice.
2-HIBA represents a metabolite in the valine catabolic pathway of amino acids. In the present study no differences between healthy controls and the pre-operative state of obese patients were found with respect to urinary 2-HIBA levels, whereas the other recent case report (Calvani et al., 2010) detected higher concentrations of 2-HIBA in obese patients compared to controls. However, post-operative 2-HIBA levels were higher compared to healthy controls and pre-operative levels. Increased 2-HIBA levels were also detected in the urine of pregnant women who subsequently developed gestational diabetes (Diaz et al., 2011), as well as in type 2 diabetic mouse models (Connor et al., 2010). This might be due to altered biotin status and amino acid and/or gut metabolism associated with higher BMI values. Moreover, plasma 2-HIBA was reported as a potential biomarker of T2DM, and as an indicator of metabolic alterations in T2DM in a case-control study (Li et al., 2009). The post-operative starvation seen after bariatric surgery may be the most likely explanation for this increase in 2-HIBA.
In contrast to 3-HB and 2-HIBA, we detected lower levels of hippuric acid, trigonelline, and glycine, in obese subjects independent of operative status compared to healthy controls. Furthermore, hippuric acid and trigonelline levels showed a strong decline following bariatric surgery, whereas glycine increased. Hippuric acid is a carboxylic acid that can be produced by a range of gut microbes (Nicholson et al., 2005). Consequently, urinary hippuric acid levels are associated with microbial activity and composition (Williams et al., 2002). In accord with our results, low levels of urine hippuric acid have been reported in T2DM patients (Salek et al., 2007). Similar findings were demonstrated in obese Zucker rats (Salek et al., 2007; Zhao et al., 2010), and lean Goto-kakizaki rats (Zhao et al., 2010), which are two different rat models of the pathogenetic processes of T2DM. Interestingly, the urinary excretion of hippuric acid was clearly more reduced in obese Zucker rats than in lean Goto-kakizaki rats, suggesting a strong influence of obesity on the urinary excretion of hippuric acid. The further decrease in hippuric acid seen in patients after bariatric surgery might be also explained by starvation. In addition to the influence of intestinal microflora, dietary intake of foods containing benzoic acid, which is conjugated with glycine in the liver and excreted as hippuric acid (Temellini et al., 1993), also impacts the excretion rate.
Trigonelline is a product of niacin (vitamin B3) metabolism that is excreted in the urine of humans (Yuyama and Suzuki, 1991). Niacin requirements are satisfied by both dietary sources and biosynthesis through tryptophan-mediated metabolism ensured by the liver and the gut microflora (Rezzi et al., 2007). Trigonelline is also a by-product of the conversion of S-adenosylmethionine to S-adenosylhomocysteine. Its decrease has been related to a depletion of S-adenosylmethionine, as it is consumed in the trans-sulfuration pathway in order to regenerate glutathione stores that are depleted by obesity-related metabolic stress (Sun et al., 2008). We detected lower amounts of trigonelline in our pre-operative obese patients compared to controls, confirming the latter observation. However, after bariatric surgery we found an even more pronounced decrease in trigonelline, which might be explained by a decrease in a methionine plasma concentration that has been reported after laparoscopic sleeve gastrectomy in children (Oberbach et al., 2012). Trigonelline is found in coffee and other plants. Coffee contains several metabolically-active compounds that are known to affect human body chemistry. Recent research has also uncovered stimulating effects of coffee on endocrine pathways like the production of cortisone or adrenaline, which are not related to its caffeine content. Further, coffee intake may reduce the risk of T2DM by up to half in patients who consumed as much as 7 cups a day (Huxley et al., 2009; Salazar-Martinez et al., 2004). In an animal study, the intake of trigonelline directly improved insulin resistance, and led to lower triglyceride levels, as well as higher glucokinase activity in Goto-kakizaki rats (Yoshinari et al., 2009). Also in a randomized cross-over trial, trigonelline supplementation showed a positive effect by reducing early glucose and insulin responses during an OGTT (van Dijk et al., 2009). These findings suggest that trigonelline has beneficial effects on the T2DM risk through decreasing blood glucose and lipid levels, increasing the insulin sensitivity index, upregulating antioxidant enzyme activity, and decreasing lipid peroxidation. However, the well-known short-term positive effects of bariatric surgery on insulin sensitivity and T2DM seem unlikely to be mediated by trigonelline, because we observed a decrease in the urinary levels after surgery.
With respect to glycine—one of the smallest amino acids—we observed lower urinary excretion in obese patients compared to healthy controls. Glycine is biosynthesized in the body from the amino acid serine, which is in turn derived from 3-phosphoglycerate. This nonessential amino acid is known to possess various protective effects in the kidney and other organs, such as a reduction in the damage caused by hypoxia (Brecht and de Groot, 1994; Weinberg et al., 1987). It is widely accepted that hyperaminoacidemia appears to be a manifestation of the insulin ineffectiveness characteristic of obesity. In one of the first publications regarding this topic (Felig et al., 1969), the plasma concentrations of the amino acids valine, leucine, isoleucine, tyrosine, and phenylalanine were increased in obese subjects compared to lean controls. In good agreement with our results, however, glycine was decreased in obesity and in T2DM patients in previous studies (Sekhar et al., 2011). In a rat model of the metabolic syndrome, the addition of 1% glycine to drinking water reduced nearly all components of metabolic syndrome, including high blood pressure, triglyceride levels, insulin concentration, homeostasis model assessment (HOMA) index, and albuminuria (Perez-Torres et al., 2011). These results suggest that glycine treatment protects by acting as an anti-inflammatory agent on the COX pathway of amino acid metabolism in the kidney. In humans, dietary supplementation with its precursors for antioxidant glutathione synthesis cysteine and glycine lower oxidative stress and oxidant damage, even with persistent hyperglycemia (Sekhar et al., 2011). Therefore the increase seen in glycine after bariatric surgery may be associated with the positive metabolic effects of this procedure. Furthermore, our data confirm results found in 93 patients with small bowel bypass for massive exogenous obesity. Post-operatively, a significant increase in the rate of bile salt synthesis, and in the bile salt glycine/taurine ratio from 4.6 to 6.8, was observed (Wise and Stein, 1975). The authors associated this metabolic change with the development of calcium oxalate urinary calculi and gallstones during a mean follow-up period of 17.6 months. The fact that malabsorptive bariatric procedures increase the risk for developing kidney stones is widely accepted (Tasca, 2011), and further studies are needed to investigate the association of urinary glycine excretion and the development of calcium oxalate urinary calculi, as suggested by our data.
A strength of the study is the large sample of patients who underwent bariatric surgery, and who were investigated by NMR spectroscopy. A further strength is the accurate selection of healthy controls from a population-based study. In addition to MS, NMR represents a widely used technique for metabolic profiling. Its findings provide complementary snapshots of the metabolome of body fluids, including plasma, urine, and cerebrospinal fluid (Bictash et al., 2010). Urine is a more readily available body fluid than plasma, and thus might be preferred for screening and prediction of metabolic changes after bariatric surgery in adolescents. A limitation of our study is the fact that we investigated short-term changes in metabolites after bariatric surgery, which may be associated with other nonspecific post-operative effects. The metabolic changes seen following surgery have been widely investigated since the 1930s. The acute stress leads to a complex response, which includes activation of the nervous system, increases in pituitary hormone secretion, and substantial immunological alterations (Burton et al., 2004; Desborough, 2000). Subsequently all these changes might also lead to modified metabolite profiles in plasma and urine during the immediate post-operative period (Mirnezami et al., 2012). In an experimental setting, comprehensive changes in urine and plasma metabolites were found as a metabolic response of Wistar rats in a laparotomy model (Kinross et al., 2011). These alterations included an increase in the urinary levels of taurine, glucose, urea, creatine, allantoin, and trimethylamine-N-oxide, as well as decreases of citrate and 2-oxoglutarate. As a consequence, the surgery-induced stress response should be taken into account when interpreting the present findings. Furthermore, other health conditions might be the cause of the detected differences in metabolite levels. For example, patients with colorectal cancer had higher serum 3-HB and lower glycine levels compared to healthy controls (Ma et al., 2012).
Thus further studies should be conducted to investigate the long-term effects after bariatric surgery, and to identify the pathways that lead to weight loss and to the remission of T2DM.
Conclusion
In conclusion, we report here the first metabolomic study performed before and after bariatric surgery. We identified short-term changes of metabotypes after bariatric procedures, confirming the potential of urine 1H NMR spectroscopy to analyze metabolism. Moreover, the data presented here increase our knowledge of potential metabolic traits that might be associated with weight reduction. Therefore, future studies should be performed to evaluate the potential benefit of using spot urine samples as a non-invasive and cost-effective screening approach in bariatric surgery patients.
Footnotes
Author Disclosure Statement
The authors declare that no conflicting financial interests exist.