
Abstract
Abstract
Rice (Oryza sativa L.) is one of the most important food crops in the world, especially in Asian countries, and salinity is a major constraint to the sustainability and expansion of rice cultivation. Genetically improving salt tolerance of rice is a highly important objective of rice breeding programs. Traits such as salt tolerance are quantitatively inherited. Hence, mapping quantitative trait loci (QTL) with molecular markers can be very helpful to plant breeders in the field of agricultural genomics (AgriGenomics). In this investigation, QTL analysis of physiological traits related to salt tolerance was carried out using F2:4 population of rice derived from a cross between a salt-tolerant variety, Gharib (indica), and a salt-sensitive variety, Sepidroud (indica). A linkage map based on 148 F2 individuals was constructed with 131 SSR markers and 105 AFLP markers, covering 2475.7 cM of rice genome with an average distance of 10.48 cM between flanking markers. A total of 41 QTLs for twelve physiological traits under salinity stress were detected distributed on all rice chromosomes, some of them being reported for the first time. Also, overlapping of QTLs related to salt tolerance were observed in this study. Some of the identified QTLs on specific chromosomal regions explaining high phenotypic variance could be used for marker-assisted selection (MAS) programs. New QTLs retrieved in this study play an important role in growth of rice at seedling stage in an Iranian local population under high salinity conditions.
Introduction
A number of mapping studies by several researchers have identified QTLs of physiological traits related to salinity tolerance in rice (Islam et al., 2011; Lee et al., 2007; Lin et al., 2004; Prasad et al., 2000; Sabouri et al., 2009; Thomson et al., 2010). Koyama et al. (2001) identified QTLs for seedling traits such as Na+ and K+ content and Na/K ratio in shoots under salt stress using an RIL (F6) population. Likewise, to characterize the genetic components of salinity tolerance in the tolerant landrace Pokkali, an RIL population between the indica varieties IR29 and Pokkali, was developed at IRRI (International Rice Research Institute) and used in a QTL study using amplified fragment length polymorphism (AFLP) markers on a set of 38 tolerant and 42 sensitive RILs (Gregorio, 1997). Lin et al. (2004) reported two major QTLs with very large effects; qSNC-7 for shoot Na+ concentration and qSKC-1 for shoot K+ concentration. These QTLs explained 48.5% and 40.1% of the total phenotypic variance, respectively. Ren et al. (2005) isolated the SKC-1 gene on chromosome 1 that maintained K+ homeostasis in the salt-tolerant variety Nona Bokra under salt stress. Two QTLs (qST-1 and qST-3) conferring salt tolerance at young seedling stage were mapped on chromosome 1 and 3, respectively (Lee et al., 2007). 14 QTLs, for standard tolerance ranking, dry matter, Na+ and K+ content and Na/K ratio in shoot were identified by Sabouri et al. (2009) in rice. Furthermore, Thomson et al. (2010) located two QTLs (qSTR-3 and qSTR-12) for standard tolerance ranking on chromosomes 3 and 12 and four QTLs for chlorophyll content on chromosomes 1, 2, 3, and 12.
Although there have been extensive studies on QTL mapping for salinity tolerance in rice, little information has been reported on the mapping of salinity tolerance in local populations. The objective of the current study was to detect QTLs for several traits associated with salt tolerance in rice at seedling stage using an Iranian rice population (F2:4). The results provide important information for functional analysis of rice salt tolerance genes and help us to understand the genetic nature of rice seedling under salt stress.
Methods and Materials
Plant material
A mapping population of rice (Oryza sativa L. sub. indica) segregated for the traits of interest was identified by screening Iranian rice germplasm during 2004–2005 for salt tolerance (Sabouri et al., 2007). The parental line, Gharib (GHB, female parent), was salt tolerant, and the other parental line, Sepidroud (SPD, male parent) was a salt-sensitive rice. An F2 population derived from a cross of these parents was used in order to construct a genetic linkage map. The genetic material used in phenotype evaluations in this study, involved 148 F4 families, each derived from bagged seeds of a single F2 plant.
Evaluation of physiological traits for salt tolerance
The F4 families and their parental varieties were used to evaluate salt tolerance, with two replications (30 individual plants per family for each replication) in 2009 at the Botany Laboratory of Gonbad University in Iran. Seeds of this experiment were heated at 50°C for 3 days to break seed dormancy and were germinated at 35°C for 48 h after surface-sterilization with 2% sodium hypochlorite solution for 4 min and rinsed with distilled water three times. Finally, the germinated seeds were sown in holes of a styrofoam board with a nylon net bottom, floating on distilled water for 3 days in plastic trays (53.5×27×8.5) as described by Gregorio (1997), then transferred to float on Yoshida's nutrient solution (Yoshida et al., 1976) for 11 days. Two weeks after sowing, the seedlings were transferred to nutrient solution containing 51.19 mM NaCl (electrical conductivity 6 dS.m−1) for 7 days, and then the NaCl concentration was increased to 163.8 mM (12 dS.m−1) for a further 7 days. The seedlings were grown in a growth chamber under controlled conditions of 29/21°C day/night temperature, 16 h photoperiod, irradiance of 1500 μmol.m−2.s−1 and relative humidity of 70%. The nutrient solution was replaced weekly and the pH was maintained daily at 5.5 by adding NaOH 1 N or HCl 1 N.
Phenotype data collection
After 2 weeks of salt stress, the standard tolerance ranking (STR) test was conducted with ratings from 1 (highly tolerant) to 9 (highly sensitive), according to Gregorio (1997). Chlorophyll content in leaves from each family was then determined by a portable chlorophyll meter (SPAD-502, Minolta, Japan). Root and shoot samples were collected, washed thoroughly, and dried at 70°C, after plants from each F4 families and their parents were recorded for physiological traits including shoot length (SHL), root length (RL), shoot fresh weight (SFW), root fresh weight (RFW), shoot dry weight (SDW), root dry weight (RDW), and biomass (BM) of shoot and root dry weight. Also, the shoot samples were diluted, and Na+ and K+ concentrations and Na/K ratio were determined by flame photometer (Cl361, ELCO), according to Kalra et al. (1998). All the traits for each F4 lines were recorded in the 30 F4 progenies in each replication and the mean of 60 progenies for each F4 lines was used for QTL analysis. The significance test between parents and skewness and kurtosis tests to evaluate normal distribution for all studied traits in F4 lines were carried out by t-test.
DNA extraction and SSR data analysis
DNA was extracted from fresh leaves of each F2 plant and the parental lines. DNA extraction was performed by using the CTAB as described by Saghai Maroof et al. (1994). Simple sequence repeat markers on 12 rice chromosomes were selected from the Gramene database (http://www.gramene.org) and the linkage map was constructed following McCouch et al. (2002) based on their map location. A total of 575 SSR markers of known chromosomal position were used to survey the parents for polymorphism. Polymorphic markers were used to detect the genotype of 148 F2 plants. Polymerase chain reaction (PCR) was carried out in a total volume of 10 μL per reaction containing 2 μL template DNA, 0.4 μL forward and reverse primers each of 10 pmol concentration, 0.6 μL dNTPs (2 mM), 0.12 μL Taq polymerase (5 U/μL), 0.48 μL MgCl2 (50 mM), 1 μL 10×PCR buffer, and 5 μL steril nanopure H2O. PCR amplification was performed in a thermal cycler (Applied Biosystems, Germany) at the Biotechnology Laboratory of University of Guilan, Iran. The thermal cycle protocol includes 94°C for 5 min (initial denaturation), followed by 35 cycles of 94°C for 30 sec (denaturation), 55°C for 30 sec (primer annealing with most of the primers while some were adjusted), 72°C for 2 min (extension), and at least 72°C for 5 min (final extension). PCR products were separated on 6% polyacrylamide gels (19:1 acrylamide: bisacrylamide).
Amplified fragment length polymorphism analysis
Parental surveys were conducted to identify polymorphism between the parents using AFLP markers. Nine AFLP primer combinations showing polymorphisms between Gharib and Sepidroud were used for genotype analysis of the F2 population. The AFLP protocol developed by Vos et al. (1995) was followed, with minor modifications. Six μL genomic DNA (50 ng/μL) was restricted with 0.25 μL of EcoRI (10 U/μL), 0.25 μL MseI (10 U/μL), 2 μL tungo buffer (10×), and 11.5 μL steril nanopure H2O in a 20 μL reaction volume. The reaction was initially incubated at 37°C for 12 h. After complete digestion, 25 μL mixture containing 0.5 μL EcoRI adapter (50 pmol), 0.5 μL MseI adapter (50 pmol), 0.5 μL ATP (100 mM), 1 μL T4 DNA ligase (1 U/μL), and 0.5 μL tungo buffer (10×) were added to the same tube from the previous stage and incubated for 60 min at 37°C and another 120 min at 20°C. A 3 μL sample from the diluted double digested and adapter ligated DNA (5:1) was selectively pre-amplified (EcoRI primer, MseI primer) to a final volume of 25 μL, containing 1 μL of each primer, 2.5 μL dNTPs (2 mM), 2.5 μL 10× pcr buffer, 1 μL MgCl2 (50 mM), 0.2 μL Taq polymerase, and 13.8 μL sterile nanopure H2O. The cycle was as follows: 94°C for 5 min, followed by 30 cycles of 94°C for 30 sec, 60°C for 30 sec, 72°C for 1 min, and final extension at 72°C for 5 min. These pre-amp primers were designed based on the adapter sequence and restriction sites of EcoRI and MseI. No selective nucleotide was added to the pre-amp primers. Finally, nine selective primer pairs were used (M-CTG/E-ACC, M-CTG/E-ACG, M-CTG/E-ACT, M-CTA/E-ACC, M-CTA/E-ACG, M-CTA/E-ACT, M-CTC/E-ACC, M-CTC/E-ACG, and M-CTC/E-ACT) in selective amplification. For the second amplification, 1 μL of each primer combination, 1.5 μL 10× PCR buffer, 0.6 μL MgCl2 (50 mM), 1.5 μL dNTPs (2 mM), 7.2 μL steril nanopure H2O, 0.2 μL Taq polymerase, and 2 μL of a 5:1 dilution of the pre-amp products were made up to a final volume of 15 μL. The thermal cycle was as follows: 94°C for 3 min and 94°C for 30 sec, 65°C for 30 sec, 72°C for 30 sec, followed by ten cycles with a stepwise reduction of 1°C in the annealing temperature of 56°C, and 26 cycles of 94°C for 30 sec, 56°C for 30 sec, 72°C for 4 min, and final extension in 72°C for 5 min.
Genetic linkage map construction and QTL analysis
A chi-square test (p≤0.05) was performed on each AFLP and SSR marker to verify the expected 3:1 and 1:2:1 segregation ratio, respectively. An AFLP and SSR linkage map was established using the program QTXb17 Map manager (Manly and Olson, 1999), and map distances between markers were presented in cM using the kosambi function (Kosambi, 1944). The QTLs were mapped using composite interval mapping (CIM) function of the Win QTL Cartographer v. 2.5 (Basten et al., 1997). Thresholds for logarithm of odds (LOD) score were estimated by permutation tests (Churchill and Dorage, 1994) with 1000 replications. Automatic cofactor selection was also performed by using the software using a forward/backward regression, An overall (genome-wide) significance level of 0.05 was used to declare QTL. The parameters such as additive and dominant effects and the percentage of total phenotypic variation by each QTL were also estimated by CIM procedure.
Results
Phenotypic variation
The phenotypic distribution of traits related to salt tolerance in 148 F4 families is shown in Figure 1. The mean values and standard deviation (SD) of each trait in the parents and F4 lines together with t-test for evaluating the significant differences between parents are shown in Table 1. Normality tests for each trait in the F4 population are indicated in Table 2. The F4 families showed significant variability for the twelve salt tolerance parameters examined in the present study. All the parameters showed transgressive segregation and near normal distribution, suggesting involvement of multiple genes with quantitative inheritance. The female parent, GHB, was phenotypically more tolerant than the male parent, SPD, for all evaluated traits. Also, differences between parents for all studied traits were significant (Table 1). The normality test of observed data in the F4 lines showed that skewness and kurtosis values were not significant (Table 2), indicating normal distribution of all studied traits.
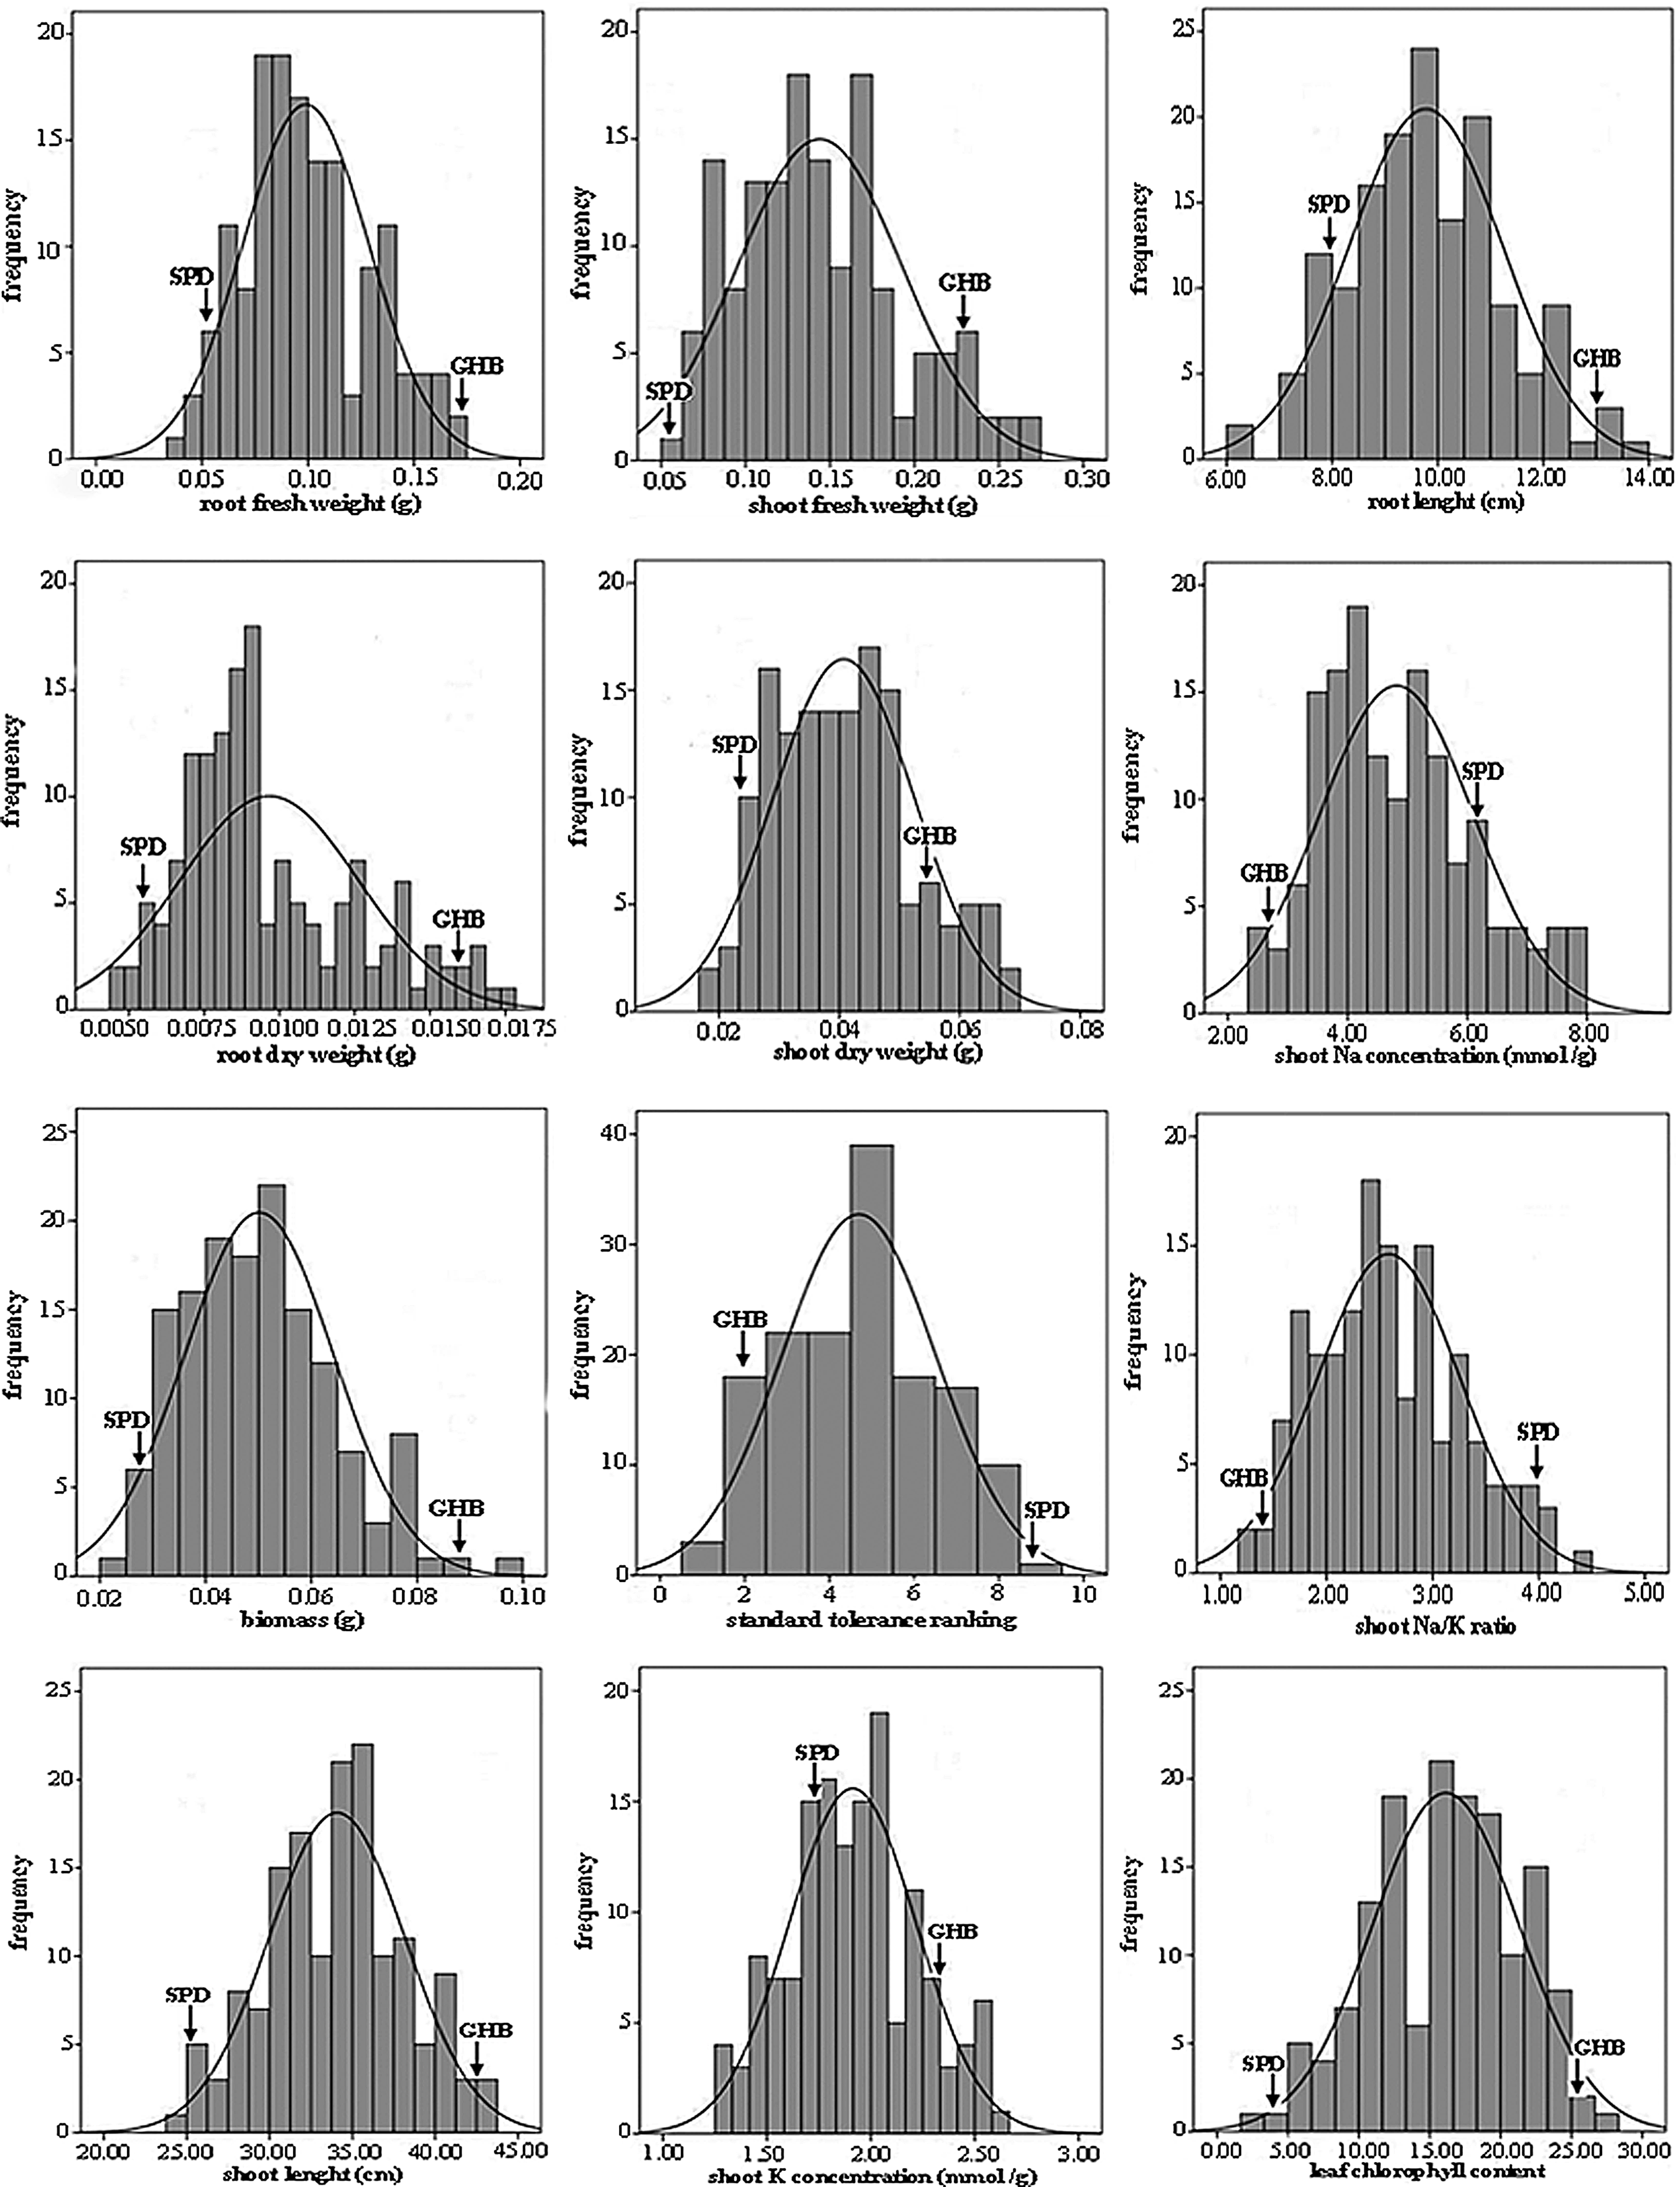
Phenotypic distribution of 12 traits related to salt tolerance in 148 F4 families. The SPD and GHB indicate the phenotypic values of the parents Gharib and Sepidroud, respectively.
Significant at 0.01 probability level.
Nonsignificant.
Linkage map
There are 12 linkage groups. The markers were distributed on each chromosome based on the MacCouch's map. A linkage map of 12 rice chromosomes was constructed from genotypic data of 148 F2 plants with 131 SSR and 105 AFLP polymorph markers. The linkage map covered 12 chromosomes and spanned 2475.7 cM of the rice genome with an average interval of 10.48 cM between marker loci (Figure 2).
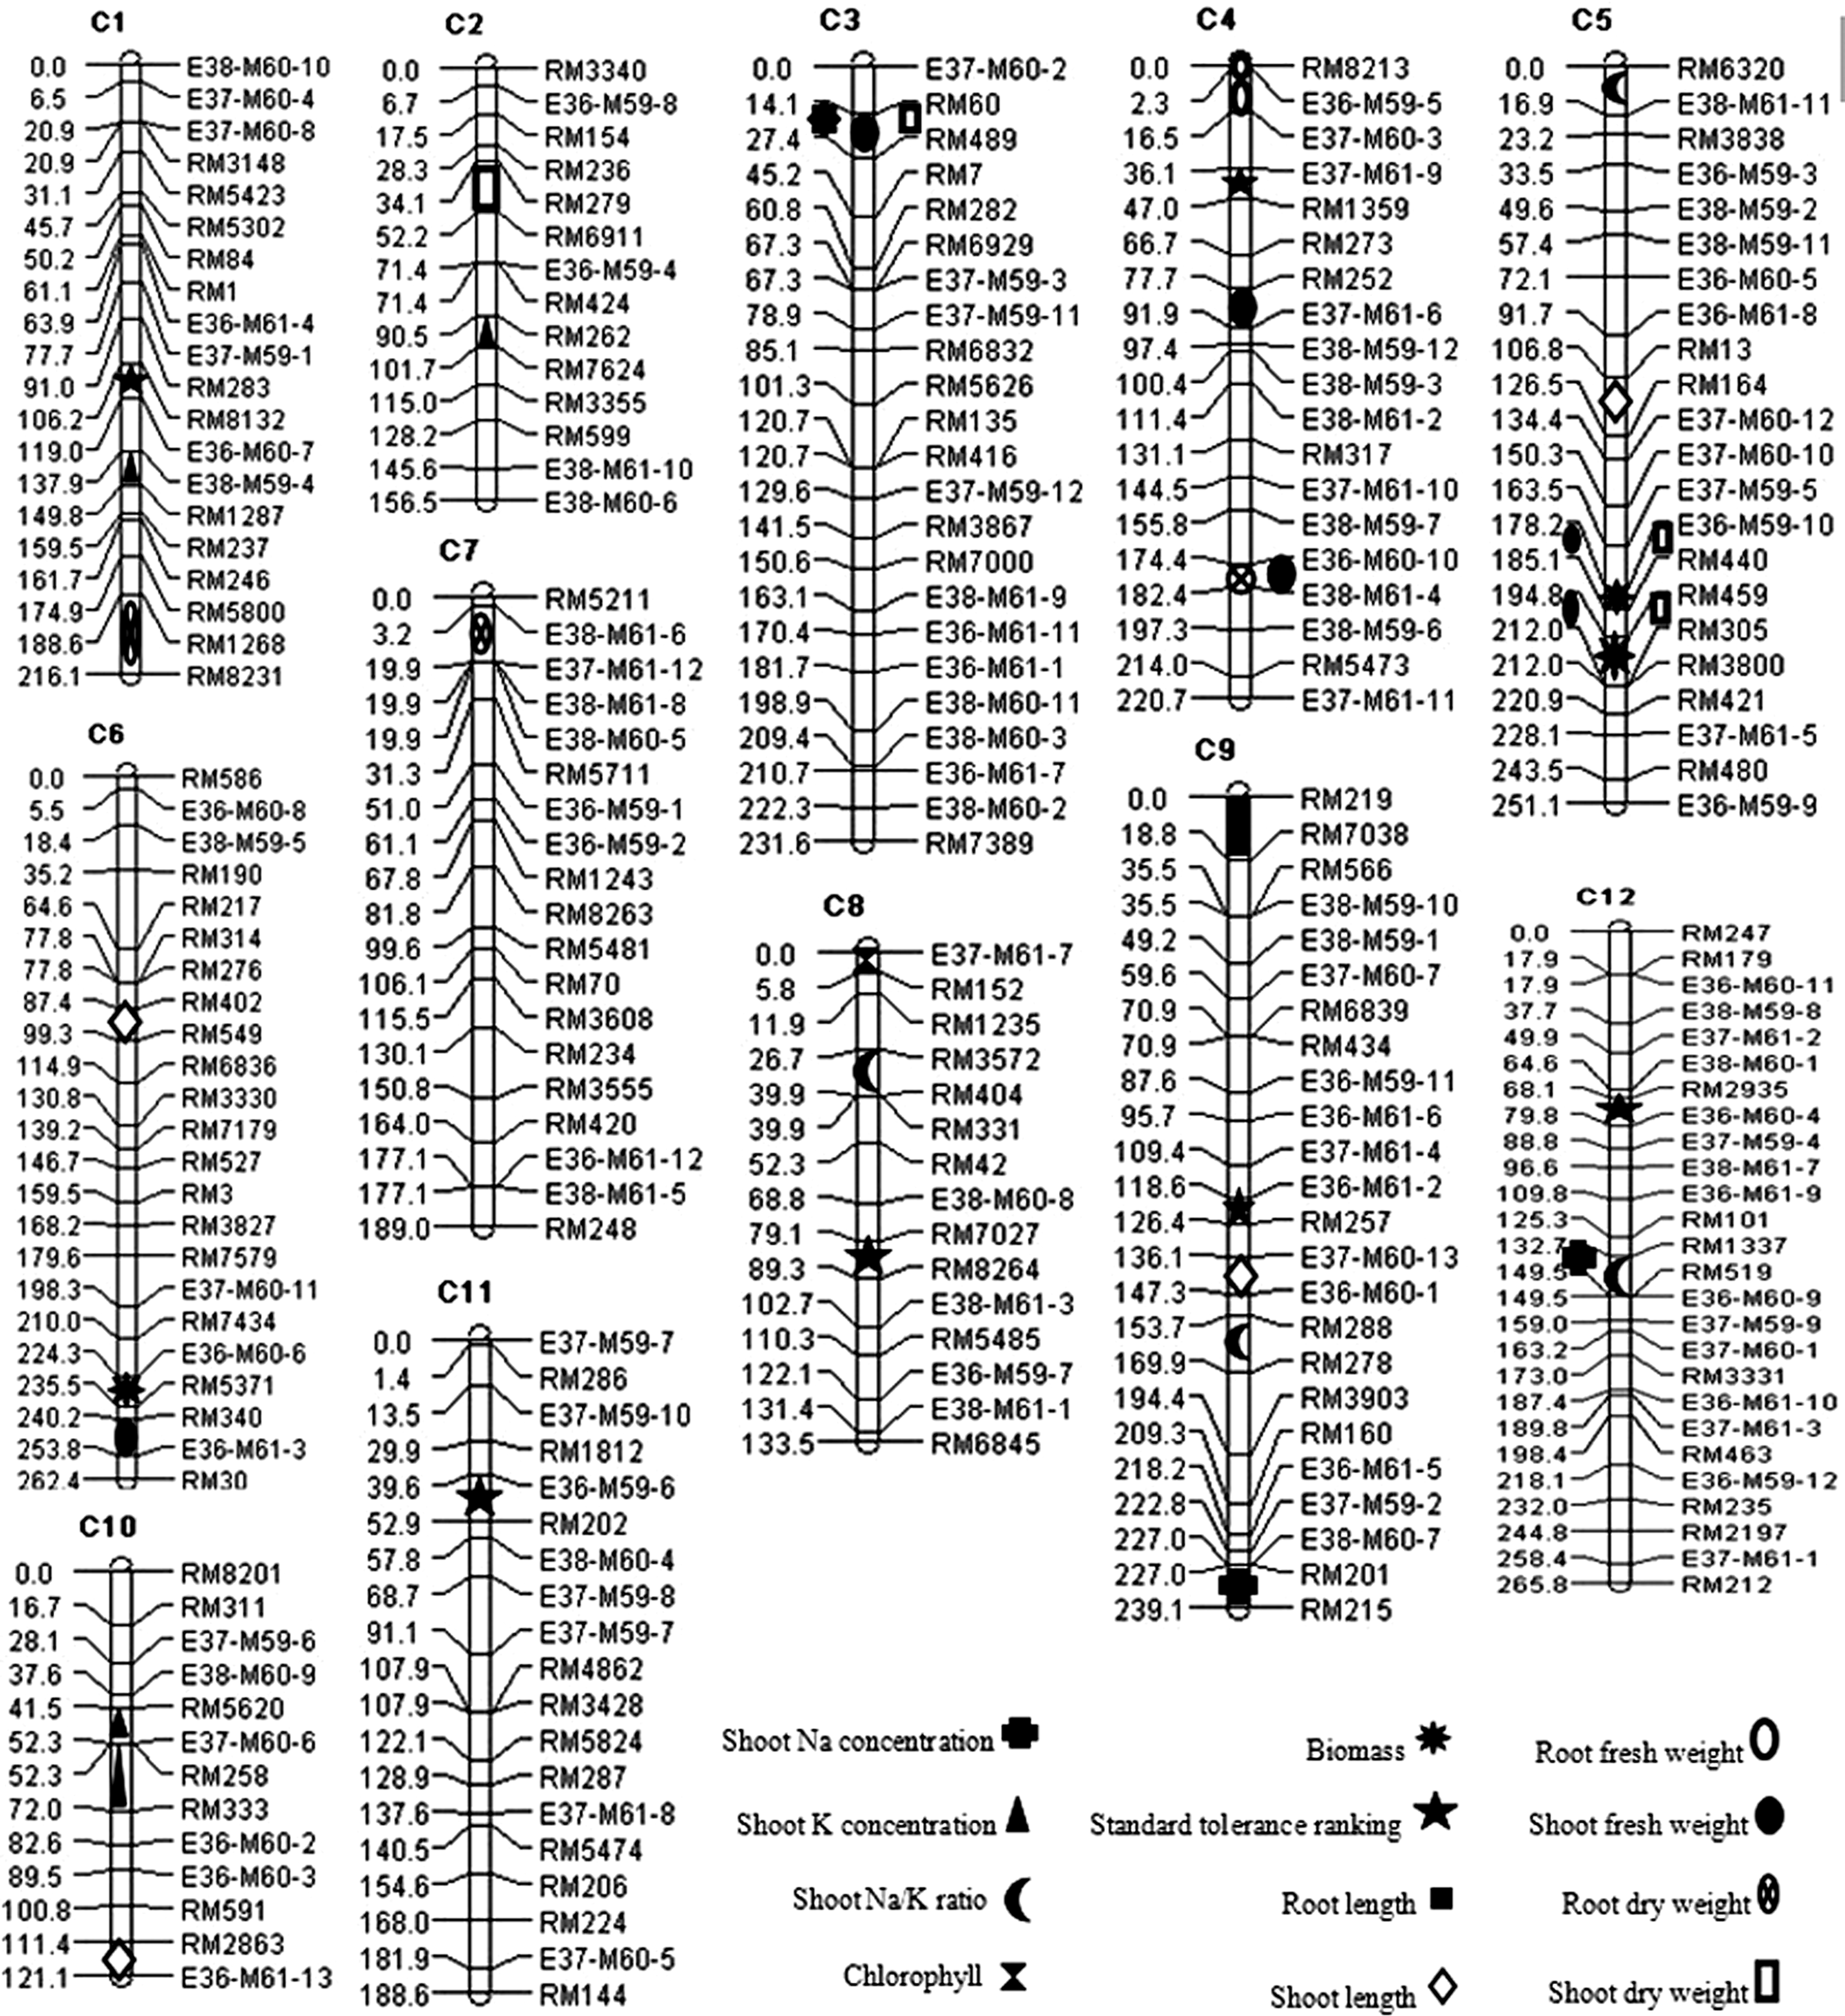
Linkage map and QTLs related to salt tolerance in the F2:4 population from the cross GHB×SPD. The number of chromosomes are shown at the top and the Kosambi values (cM) and markers are indicated at the right and left sides of the chromosomes, respectively. The QTLs for 12 studied traits are signed on the chromosomes.
QTL mapping of salt tolerance-related traits at the rice seedling stage
Forty-one QTLs controlling twelve traits were mapped on the linkage map (Table 3, Figure 2), of which 38 markers scattered all over the rice chromosomes were also found to be associated with the traits of salt tolerance. A total of two QTLs associated with RFW were detected on chromosome 4. The QTL, qRFW-4b, showed the largest effect on RFW and explained 19.06% of the total phenotypic variance. The additive effect of this QTL was positive, and exhibited partial dominance for decreased RFW (Table 3). Six QTLs were mapped for SFW, and two of these QTLs (qSFW-4a and qSFW-5b) showed relatively large effects on SFW and explained 16.13% and 22.89% of the total phenotypic variation, respectively. GHB alleles at qSFW-3 and qSFW-5a caused an increase in SFW, whereas in the other four putative QTLs, alleles from SPD were responsible for a reduced SFW. There were QTLs that showed over-dominance effects for decreased (qSFW-6, qSFW-4a, qSFW-4b, and qSFW-5a) and increased (qSFW-3) SFW, while the QTL qSFW-5b showed partial dominant effects for decreased SFW (Table 3). Three and two QTLs were found for RDW and SNC, respectively, and all of them had minor effects on RDW and SNC. Four QTLs were also detected for SDW, one of which (qSDW-2) showed major contribution to SDW and explained 17.88% of the total phenotypic variance that had positive additive effects for increased SDW from GHB. All of the QTLs showed over-dominance for increased (qSDW-3) and decreased (qSDW-5a and qSDW-5b) SDW, except the QTL qSDW-2 that showed partial dominance for decreased SDW. Four QTLs were identified for BM of which two QTLs (qBM-5a and qBM-5b) showing a large effect on BM explained 16.27% and 15.3% of the total phenotypic variance in BM, respectively. Six QTLs were mapped for STR on chromosomes 1, 4, 8, 9, 11, and 12. Among these, two QTLs located on chromosome 8 (qSTR-8) and 9 (qSTR-9) had higher R2 than the other QTLs and explained 19.66% and 21.7% of the total phenotypic variation, respectively. GHB alleles at qSTR-1 and qSTR-12 caused a decrease in STR, whereas in the other four putative QTLs, alleles from SPD were responsible for increased STR. All of the QTLs showed over-dominance for increased (qSTR-1 and qSTR-4) and decreased (qSTR-8, qSTR-9, qSTR-11, and qSTR-12) STR. Only one QTL (qRL-9) was mapped for RL, which explained 15.59% of the total phenotypic variation, and its alleles from SPD showed over-dominance for increased RL. Four QTLs were identified for SHL, but only one of them (qSHL-5) showed major contribution to SHL and explained 19.57% of the total phenotypic variance. This QTL had positive additive effect for increased SHL that was contributed by GHB. The dominance effect for putative QTL was negative, showing partial dominance for decreased SHL.
Direction of phenotypic effect, GHB and SPD indicate Gharib and Sepidroud, respectively. BM, biomass; CHL, chlorophyll; RDW, root dry weight; RFW, root fresh weight; RL, root length; SDW, shoot dry weight; SFW, shoot fresh weight; SHL, shoot length; SKC, shoot K concentration; SNC, shoot Na concentration; SNK, shoot Na/K ratio; STR, standard tolerance ranking.
QTLs are named by abbreviations plus chromosomal number; cThe underline marker is more near to mentioned QTL; dAdditive effect; eDominant effect; fDegree of dominance; gPercentage of phenotypic variance explained by each QTL; hDirection of phenotypic effect.
Four QTLs were detected for SKC. The QTLs qSKC-1 and qSKC-10b showed the largest effect on SKC and explained 16.69% and 29.71% of the total phenotypic variance, respectively. In all four QTLs (qSKC-1, qSKC-2, qSKC-10a, and qSKC-10b) alleles from GHB increased K+ concentration by 0.09 on average. The dominance effects for qSKC-1 and qSKC-2 were negative and showed over-dominance for decreased SKC, whereas the dominance effects for qSKC-10a and qSKC-10b were positive and showed over-dominance for increased SKC. Four QTLs were also identified for SNK, but only one of them (qSNK-8) showed major contribution to SNK and explained 15.12% of the total phenotypic variance that had negative additive effects for decreased SNK and was contributed by GHB. The dominance to additive ratio for this QTL was positive and exhibited over-dominance for increased SNK. Finally, only one QTL (qCHL-8) was detected for CHL on chromosome 8 that explained 15.78% of the total phenotypic variance and its alleles from GHB showed partial dominance for decreased CHL.
Discussion
Transgressive segregation might be attributed to the gathering of some QTLs associated with salt tolerance in rice, and it can be achieved via MAS (Sabouri et al., 2009). Mapping of QTLs can enable dissection of the genetic control of tolerance mechanism, opening the possibility of future efforts to develop varieties with improved salinity tolerance by transferring QTLs precisely into popular varieties and pyramiding multiple relevant QTLs for a particular stress-prone environment. Previous research showed that salt tolerance in rice was controlled by polygenes with additive and dominant effects, the former playing a major role (Gregorio and Senadhira, 1993). With regard to salt tolerance in rice, several major QTLs associated with salt tolerance accounting for a large proportion of the phenotypic variation have been detected using different RILs, DH, and F2:3 mapping population (Lee et al., 2007; Lin et al., 2004; Takehisha et al., 2004), and one major QTL was recently cloned (Ren et al., 2005). In the present study, the F2:4 population was evaluated for 12 traits related to salt tolerance at the seedling stage. There are several reports on QTL analysis of rice salt-tolerance including and Islam et al. (2011), Koyama et al.(2001), and Lin et al. (2004).
Two new QTLs [i.e., qRFW-4a (interval RM8213- E36-M59-5) and qRFW-4b (interval E36-M59-5-E37-M60-3)] that were mapped for RFW in this study, may be unique loci to the Iranian parents studied. Sabouri and Sabouri (2008) have reported two QTLs for RFW on chromosome 3. Also, two QTLs for this trait were identified on chromosomes 6 and 7 by Kim et al. (2009). In the present research, six putative QTLs were mapped for SFW on chromosomes 6, 3, 4 (two QTLs) and 5 (two QTLs). Sabouri and Sabouri (2008) reported one QTL for this trait on chromosome 3 (interval RM1022–RM6283), indicating the expression stability of qSFW-3 in Iranian populations. In comparison to previous studies (Haq et al., 2010; Takehisha et al., 2004), in the present study two major QTLs for SFW, qSFW-4a and qSFW-5b, were newly identified on chromosomes 4 and 5, respectively. The fact that no QTL was detected for SFW in previous studies may be due to the presence of the same allele(s) for this QTL in both the parents.
In this study we identified three minor QTLs for RDW on chromosomes 1, 4, and 7 against the chromosomes reported by Sabouri and Sabouri (2008), but putative QTLs were found in agreement with chromosomes reported by Kim et al. (2009). However, it is difficult to exactly compare the chromosomal locations of QTLs because different materials and marker maps were used (Lin et al., 2004). A new major QTL, qSDW-2 (near RM5911) that was mapped for SDW, may be a novel finding of this study. This QTL did not have the same map location and there was no similarity with results of previous researchers. Regarding BM, four QTLs were mapped of which two of the four QTLs on chromosome 5 (qBM-5a and qBM-5b) indicated relatively large effects on BM and explained 16.27% and 15.3% of the total phenotypic variance. They were placed close to each other on the map within a 6.6 cM distance. Akbar et al. (1986) reported that the dry matter weight of rice seedling under salt stress was affected by at least two groups of genes with additive effects, and no epistatic interaction was detected. Putative QTLs were not the same as those reported before. It seems the major QTLs associated with BM identified in this study are new QTLs. Another QTL, qBM-6, was also detected for this trait on chromosome 6 as already reported by Prasad et al. (2000) and Koyama et al. (2001), but the latter explained only 6% of the total phenotypic variance.
STR is a complex physiological trait related to ion concentration or quantity and to osmosis (Yeo and Flowers, 1989). Among the six identified QTLs for STR on chromosomes 1, 4, 8, 9, 11, and 12, two of them accounted for a phenotypic variation of more than 19%. This showed that STR might be governed by at least two major QTLs that explained the large proportion of the phenotypic variation and several minor QTLs, each explaining a small proportion of the phenotypic variance. Two major QTLs (qSTR-8 and qSTR-9) were not similar to previous reports, and this result differed for the locations of the QTLs detected by other researchers on chromosomes 8 and 9 (Islam et al., 2011; Sabouri et al., 2009; Thomson et al., 2010). Furthermore, the locus mapped on chromosome 1 in this study (qSTR-1) could be approximately the same locus reported in previous studies (Islam et al., 2011; Li et al., 2007; Thomson et al., 2010). It is hard to compare precisely the chromosomal location of these QTLs because of different genetic materials and lack of common markers used for mapping, and additional studies are needed to clarify the allelic relationship of these QTLs. In the present work, one QTL (qRL-9) was found for RL. Also, six QTLs associated with this trait, as reported by other researchers were found on chromosomes 6 and 5 (Prasad et al., 2000) and 1, 4, 5, and 7 (Sabouri and Sabouri, 2008). Regarding SHL, four QTLs were detected on chromosomes 5, 6, 9, and 10. However, in this study, a major QTL was detected on chromosome 10 (qSHL-10) linked to RM2863 marker locus, which differed in the location of the major QTLs detected by other researchers (Kim et al., 2009; Sabouri and Sabouri, 2008; Takehisa et al., 2004; Thomson et al., 2010). The detection of a new QTL (qSHL-10) will provide important information associated with SHL for functional analysis of rice salt tolerance.
The mechanism (Yeo et al., 1987) and the heritability (Garcia et al., 1997) indicate independence of the processes of sodium and potassium uptake in rice in saline conditions. Gregorio and Sinadhira (1993) observed that there were two groups of genes involved in sodium and potassium uptake in rice; one group for sodium exclusion and the other for potassium absorption. The chromosomal position of qSNC-9 and qSNC-12 for the shoot Na concentration detected in this study is similar to that of the qSNC-9a and qSNC-12 reported by Sabouri and Sabouri (2008) and Haq et al. (2010). However qSNC-9a and qSNC-12, as two major QTLs with a large effect, explained 21.65% and 17.7% of the total phenotypic variance, respectively, while Na concentration by the QTLs (qSNC-9 and qSNC-12) with small effects explained 2.14% and 10.66% of the total phenotypic variance for this trait in the present study. Four QTLs (qSKC-1, qSKC-2, qSKC-10a, and qSKC-10b) were detected for SKC in the present study. A major QTL for salt tolerance named Saltol was mapped on chromosome 1 using F8 recombinant inbred lines (RILs) of Pokkali/IR29 cross, which is responsible for Na, K and Na/K ratio in the rice shoots and accounted for 64.3%–80.2% of the phenotypic variation in salt tolerance. This chromosome 1 segment was further saturated using RFLP and SSR markers using the RILs (Bonilla et al., 2002). Based on the previous report, it was found that five SSR markers (RM1287, RM8094, RM3412, RM493, and RM140) were linked to salt QTL on chromosome 1 (Mohammadi-Nejad et al., 2010). Also, the major QTLs, qSKC-1 near RM1287 marker locus were mapped in the Saltol region in the Iranian population in the present research. Lin et al. (2004) mapped the rice QTL, SKC1, that maintained K+ homeostasis in the salt-tolerant variety under salt stress, and Ren et al. (2005) isolated the SKC1 gene by map-based cloning and found that it encoded a member of HKT-type transporters. SKC1 is involved in regulating K+/Na+ homeostasis under salt stress, providing a potential tool for improving salt tolerance in crops. Moreover, several research using different populations, showed the efficiency of some regions on chromosome 1 related to this trait (Haq et al., 2010; Koyama et al., 2001; Pandit et al., 2010; Thomson et al., 2010). The QTLs (qSKC-2, qSKC-10a, and qSKC-10b) were mapped for this trait against the chromosomes reported by other researchers (Gregorio, 1997; Koyama et al., 2001; Sabouri et al., 2009). The molecular marker that is nearest to the new major QTL [i.e. qSKC-10b (RM258) in this study], may also be useful after fine mapping for MAS in rice breeding programs aimed at developing new varieties with a high level of salt tolerance. Four putative QTLs were identified for SNK on chromosomes 5, 8, 9, and 12. Thomson et al. (2010) reported two QTLs (qSNK-1and qSNK-9) for this trait, indicating the expression stability of qSNK-9 in different populations. In the present study, qSNK-9 was mapped between RM288 and RM278 and explained about 9.88% of the total phenotypic variation. Regarding SNK, two QTLs [i.e., qSNK-5 (interval RM6320-E38-M61-11) and qSNK-8 (interval RM3572-RM404)] which explained 0.32% and 15.12% of the total phenotypic variation, respectively, differed from those detected by other researchers (Gregorio 1997; Koyama et al., 2001; Pandit et al., 2010; Sabouri et al., 2009). These QTLs may be unique loci to the Iranian parents studied. A new major QTL explaining 15.78% of the total phenotypic variation on chromosome 8 with a positive additive effect (2.28) also found for CHL that was not similar to that in previous studies. QTLs associated with CHL in other reports were found on chromosome 3 (Sabouri and Sabouri, 2008) and 2, 3, and 4 (Thomson et al., 2010).
QTLs for correlating traits were often mapped in the same chromosomal region (Vedboom et al., 1994) and this trend was observed in this study as well. Specific marker positions strongly associated with more than one trait were observed in the regions of E36-M59-10-RM440 and E36-M60-10-E38-M61-4 on chromosomes 5 and 4 affecting DM, SDW, SFW and RDW, SFW, respectively. This region on chromosome 4 reduced salt tolerance, while putative regions on chromosome 5 increased salt tolerance. Strongly, RM3800 and RM489 on the chromosomes 5 and 3 were found associated with three traits (DM, SDW, and SFW). Significant correlation coefficient among the traits (DM-SDW, DM-SFW, SDW-SFW, and RDW-SFW with r2=0.99**, 0.77**, 0.84**, and 0.69**, respectively) in the studied F4 population were in agreement with the co-localization of corresponding QTLs. These results support the fact that trait correlations may be attributed to the effect of pleiotropy or tightly linked genes. Additional research using the same markers, genetic background, and environment is needed for further dissection of QTL overlapping. Also, the QTLs associated with SNC and SNK in the region of RM1337-RM519 on chromosome 12 were overlapped. This multiple effect of QTL on the same chromosomal region could be due to the fact that salt tolerance performance is derived from exchange of ions.
Most of the QTLs identified in the current study showed a range of partial to over-dominance effects, indicating complexity of the traits under consideration (Table 1). In most of the cases, degree of dominance (d/|a|) was high, suggesting the importance of dominance or over-dominance effects for the respective QTLs. These high levels of dominance can be related to heterosis. However, these results will provide important information for further functional analysis of salt tolerance genes in rice. In fact, the molecular markers linked to QTLs for salt tolerance might then be useful after fine mapping for indirect selection of salt-tolerant traits to be used in MAS.
Footnotes
Disclosure Statement
No competing financial interests exist.