
Abstract
Abstract
Alternative polyadenylation (APA) is widely present in the human genome and plays a key role in carcinogenesis. We conducted a comprehensive analysis of the APA products in glioblastoma multiforme (GBM, one of the most lethal brain tumors) and normal brain tissues and further developed a computational pipeline, RNAelements (http://sysbio.zju.edu.cn/RNAelements/), using covariance model from known RNA binding protein (RBP) targets acquired by RNA Immunoprecipitation (RIP) analysis. We identified 4530 APA isoforms for 2733 genes in GBM, and found that 182 APA isoforms from 148 genes showed significant differential expression between normal and GBM brain tissues. We then focused on three genes with long and short APA isoforms that show inconsistent expression changes between normal and GBM brain tissues. These were myocyte enhancer factor 2D, heat shock factor binding protein 1, and polyhomeotic homolog 1 (Drosophila). Using the RNAelements program, we found that RBP binding sites were enriched in the alternative regions between the first and the last polyadenylation sites, which would result in the short APA forms escaping regulation from those RNA binding proteins. To the best of our knowledge, this report is the first comprehensive APA isoform dataset for GBM and normal brain tissues. Additionally, we demonstrated a putative novel APA-mediated mechanism for controlling RNA stability and translation for APA isoforms. These observations collectively lay a foundation for novel diagnostics and molecular mechanisms that can inform future therapeutic interventions for GBM.
Introduction
We have previously published massively parallel signature sequencing (MPSS) analysis of glioblastoma multiforme (GBM) and normal brain tissues (Lin et al., 2010). MPSS can generate millions of short signature sequence tags from proximal to the 3' ends of mRNAs by digestion of DpnII, and the number of tags present for each transcript being a digital readout of corresponding mRNA abundance (Brenner et al., 2000; Chen et al., 2005; Jongeneel et al., 2005; Jongeneel et al., 2003; Reinartz et al., 2002). MPSS captured the 3' most DpnII digested tags of polyadenylated RNAs using oligo-dT sequences, and would capture different 3′ most DpnII digested tags from RNAs derived from APA events. It is suitable for analyzing APA events. In contrast, with the more recently developed RNA-seq (Wang et al., 2009a), where RNAs are sheared by hydrolysis or physical shearing, to generate small RNA fragments for sequencing, it is hard ascertain which tag derived from which APA isoform. Therefore, in this study, we carried out a comprehensive analysis of the APA isoforms between glioblastoma and normal brain tissues using the MPSS data (Lin et al., 2010). We identified and confirmed three genes whose APA mRNA isoforms showed opposite expression changes between glioblastoma multiforme (GBM) and normal brain tissues. The three genes are: MEF2D (myocyte enhancer factor 2D), HSBP1 (heat shock factor binding protein 1), and PHC1 [polyhomeotic homolog 1 (Drosophila)]. In addition, we developed a computational pipeline RNAelements using a covariance model from known RNA binding protein (RBP) targets acquired by RIP (Keene et al., 2006) or CLIP (Ule et al., 2003) methods. We searched the APA regions in the 3' UTR sequences of MEF2D, HSBP1, and PHC1 for the RBP binding sites with the model and found that RNA binding proteins AUF1, HNRNPA1, HuR, MSI1, NCL, PUM2, and SSB specifically bound to the regions between two alternative polyadenylation sites. These regions would be missed from the shorter APA mRNA isoforms, thus representing a novel regulatory mechanism for controlling RNA stability and translation.
Methods
Identification of APA
A virtual MPSS tag database representing all APAs in human RefSeq mRNAs was established as follows. First, all 17-nt tags with DpnII sites “GATC” and potential polyadenylation sites or polyadenylation signals were extracted from RefSeq mRNA sequences (version 2010.08.17). We used ERPIN (Lambert et al., 2004), PolyA_SVM (Cheng et al., 2006), and POLYAR (Akhtar et al., 2010) to identify polyadenylation signals within the full mRNA sequences, and used BLAT (Kent, 2002) to align EST sequences with at least 8 adenines (As) in the polyA tail of full mRNA sequences to identify possible polyadenylation sites. MPSS data from GBM (glioblastoma multiforme) and normal brain tissues was obtained from GEO database (GSE14878) (Lin et al., 2010), and mapped to the virtual database using BLAST tools (version 2.2.24). The expression abundance was normalized as TPM (transcripts per million). Furthermore, the differentially expressed APA transcripts were identified by R package DESeq (Anders and Huber, 2010) using raw counts.
Collection of sequences of RBP target mRNAs
To identify the common features of RBP targeted mRNAs, we first downloaded targeted sequences of the RBPs in the relevant literature. We extracted the whole sequences of mRNAs interacted with AUF1 (HNRNPD) (Mazan-Mamczarz et al., 2009), HNRNPA1 (Eiring et al., 2008), HuR (ELAVL1) (Mukherjee et al., 2009), MSI1 (de Sousa Abreu et al., 2009), NCL (Yang et al., 2002), PUM2 (Galgano et al., 2008), and SSB (Eiring et al., 2008). If the corresponding publications did not provide the sequences, we fetched the sequences from NCBI RefSeq according to the gene lists in the publications. The datasets can be downloaded from our RNAelements website.
Initiation of RNA motifs
In the first step, all the sequences of RBP targeted mRNAs were folded into locally stable stem-loop structures using the RNALfold program from Vienna RNA package (Hofacker, 2003; Hofacker et al., 2004). Next, we compared the top ranked secondary structures and clustered the similar structures into one candidate. To make sure that the motif candidates were significantly enriched within the targeted mRNAs, random sequences were generated by shuffling original sequences and used as the control. The frequency of each stable stem-loop structure in all 3′ UTRs of human genome was calculated as well. If the frequencies of motif candidate in random sequences and in 3′ UTRs of human genome were both lower than the counterpart in the dataset, the corresponding sequences of the structures plus 5-nt flanking sequences were extracted for model refinement described below.
Refinement of the RBP binding model
Based on the candidate RNA fragments, the RBP binding model was refined by the Cmalign program of Infernal package (Nawrocki et al., 2009) iteratively. Each sequence was used as a seed to which the other sequences with the same structure were then aligned. If the random hit of the model was lower, the model was kept for a second refinement by the Cmsearch program with the parameter of only searching for the top strand with E value less than 0.1. After calibrating the model, other new random sequences were generated for searching and the e-value was calculated. According to the hits from the random sequences and original RBP targeted sequences, the best model was identified and used to predict binding sites for unknown mRNA sequences.
Visualization of motifs
The models of the RBP binding sites were visualized by R2R, a software used to depict consensus sequence and secondary structure of a group of related RNAs (Weinberg and Breaker, 2011). The Stockholm format files containing sequences and structures of RBP binding sites were generated by RNAelements and used as input for the R2R program.
Validation of polyadenylation sites
Clinical samples
One sample of GBM and one sample from normal brain tissue were obtained from patients at the Second Affiliated Hospital of Soochow University (Suzhou, Jiangsu Province, China) with an approval from the institution ethics committee of the Second Affiliated Hospital of Soochow University (Suzhou, China). GBM and normal brain tissues for MPSS analysis were approved by the Institutional Review Boards of the University of Iowa and Swedish Medical Center. Written informed consents were obtained for all samples. Tissues were frozen in liquid nitrogen until use. The histopathological grades of tumors were assessed by pathologists.
Cell cultures
U251, LN229, M059K, and M059J cells were obtained from the ATCC (Manassas, USA) and cultured according to the suppliers protocol at 37°, 5% CO2 in DMEM/F12 or DMEM (GIBCO) media supplemented with 5% fetal bovine serum and 1% penicillin/streptomycin. Cells were cultured in T25 culture flasks with 90% confluence till use.
Reverse transcription PCR and 3′ End cDNA amplification
RNA of cell lines was extracted using the TRIzol® Reagent (Invitrogen) according to the manufacturer's protocol. Ambion MirVana miRNA Isolation Kit (Applied Biosystems, CA, USA) was used for the isolation of total RNA of tissues. According to the protocol of Scotto-Lavion et al (2006), we used the primer Qt in reverse transcription PCR and primer Qi which is complemented to part of Qt as the common primer used in 3′ End cDNA amplification. Five μg RNA of each sample was added as template into a final reaction volume of 20 μL with SuperScript II reverse transcriptase (Invitrogen). For 3′ End cDNA amplification, we used 50 ng cDNA as template using Finnzymes Phusion High-Fidelity DNA Polymerase Kit for the first round, and KOD-Plus-Neo (Toyobo, Japan) Kit for the second round, according to the recommended protocol. PCR products were analyzed by 1% agarose gel electrophoresis, and recycled from gel using MiniElute gel extraction kit (Qiagen, CA, USA) and then linked to pMD-18T simple vector (Takara, Japan) according to the supplied protocol and verified by sequencing. Sequences of primer Qt were 5′-ccagtgagcagagtgacgaggactcgagctcaagcttttttttttttttttt-3′, Qo 5′-ccagtgagcagagtgacg-3′, and Qi 5′-gaggactcgagctcaagc-3′. Site specific primers of targeted genes were designed to bind to target sites specifically by the BLAT program. The gene specific primer sequences were as follows: MEF2D: 5′-CCCCACCCCTCAGTTGACGC-3′ and 5′-AGTCAACACTGGGATGGTCTGTG-3′; HSBP1: 5′-ACCTCATGACACAGGCTGGGGT-3′ and 5′-GATCGAATGGCTTTTTGCAGCTAAC-3′; PHC1: 5′-GGCAAGGAACTGGGTGGAATGT-3′ and 5′-GGCACATGTGGCTGTTGTCATTCTT-3′. The additional primer for MEF2D_5888 was 5′-CCACCCCCACACCTGACAATCAC-3′.
Results
Approaches for the identification of differentially expressed alternatively polyadenylated transcripts from next-generation sequencing data
Figure 1 shows the approach that we used for the identification of differentially expressed APA isoforms using the massively parallel signature sequencing (MPSS) data. In the MPSS analysis, the tags were usually generated by capturing polyadenylated mRNA on a solid support (e.g., oligo-dT conjugated magnetic beads) and cDNAs were synthesized, then digested with a 4-base pair restriction enzyme cutter (e.g., DpnII). 3′ most (closest to the polyA tail) tags were retained after digestion. A linker, which contains a type III restriction enzyme (e.g., MmeI) that cuts at approximately 25 base-pairs from the site, was then ligated to the tags. Digestion with the type III restriction enzyme will generate unique tags for library construction and sequencing (Brenner et al., 2000; Chen et al., 2005; Jongeneel et al., 2005; Jongeneel et al., 2003; Reinartz et al., 2002). An advantage of MPSS is that it is able to distinguish mRNA isoforms derived from alternative usages polyadenylated sites (Brenner et al., 2000; Chen et al., 2005; Jongeneel et al., 2005; Jongeneel et al., 2003; Reinartz et al., 2002).
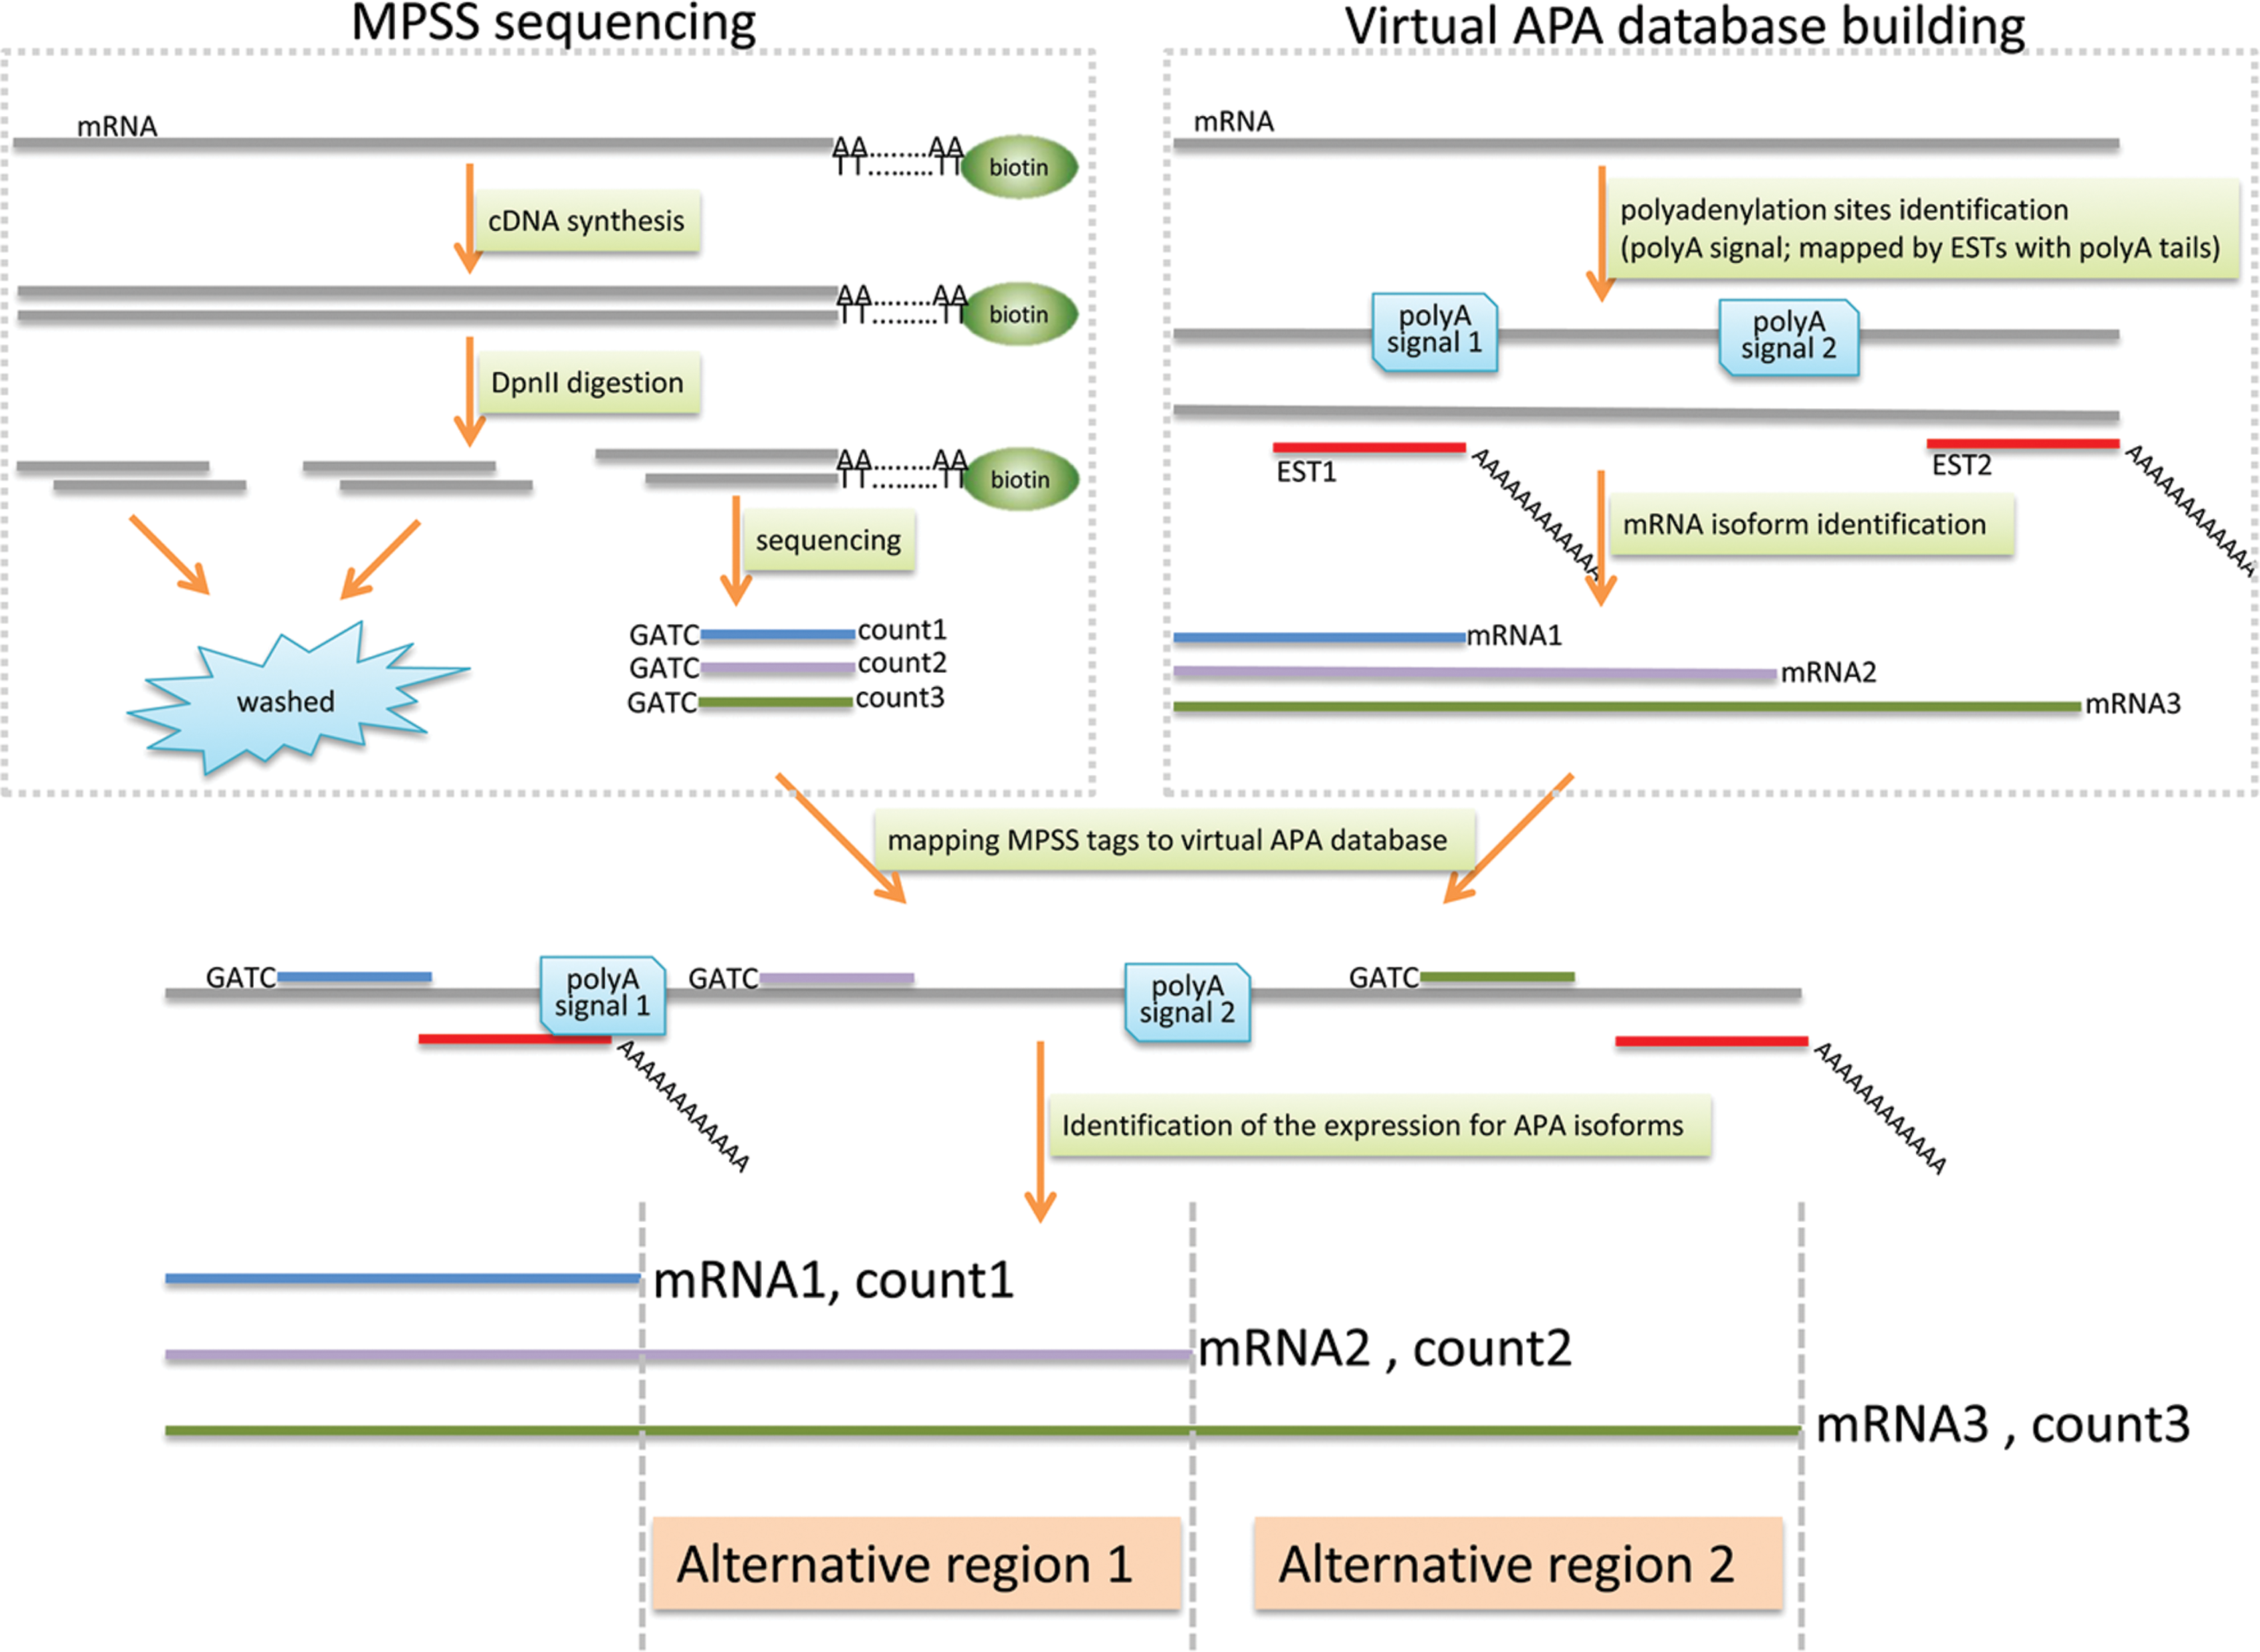
Schematic illustration of our pipelines for the identification of differentially expressed mRNAs with alternative polyadenylation sites using NGS data. A gene with three mRNA isoforms resulting from three polyadenylation sites is shown as an example. The polyadenylation sites are marked by polyadenylation signals or annotated by EST sequences with polyA tails. The expression abundance of the mRNA is represented by the counts of MPSS tag upstream of the polyadenylation sites.
We have previously analyzed the transcriptomes from a pool of five normal brain tissues and a pool of five GBM tissues (Lin et al., 2010). A total of 1,479,906 and 1,521,666 tags (23,342 and 16,298 unique tags) were identified, respectively, from the normal brain tissues and the GBM tissues. 1,104,508 tags from the normal brain tissues and 1,186,667 tags from the GBM tissues could be mapped to the virtual MPSS tag database representing APA isoforms. The 17 nt MPSS tags were assigned to RefSeq sequences by BLAST, allowing no mismatch. The presence of MPSS tags was considered evidence for the existence of polyA site. We also sought information from two additional sites. First, we used ERPIN (Lambert et al., 2004), PolyA_SVM (Cheng et al., 2006), and POLYAR (Akhtar et al., 2010) to identify polyadenylation signals in all isoforms of the mRNAs. Second, we also confirmed the polyadenylation sites by the existence of cDNAs from EST sequence database at NCBI with at least 8 consecutive adenines at the ends. The EST sequences with 8 or more consecutive As in the ends were used for BLAT alignment. The 3′ ends of EST sequences should be stringently aligned to the end of RefSeq mRNA sequences with no more than 5 nt overhang. The minimum aligned length should be at least 60% of the full length, and the orientation should be forward. To address the internal priming issue in the MPSS sequencing technology for which oligo-dT is used as primers for the first strand cDNA synthesis, the sequences surrounding the candidate polyadenylation sites were examined. The internal priming regions were examined by searching the surrounding 10-nt window for 6 consecutive As or 7 As, as described in polyA_DB methods (Zhang et al., 2005a). If there were more than 7 adenines in a 10-bp window or 6 consecutive adenines flanking the potential cleavage site, it was considered as internal priming candidate and discarded.
In the end, when there is a MPSS tag, and additionally there is at least 1 out of the 2 supporting evidences (polyA signals or at least one EST alignment), the corresponding isoform were used for further analysis. Then the expression abundance of the specific mRNA corresponding to a specific APA event was recorded as the counts of the 3′ MPSS tags which are nearest to the polyadenylation sites (Fig. 1). If a tag maps to multiple APA isoforms with no mismatch, the expression level of each isoform was assigned as the mean abundance of the tags divided by the mapped isoforms.
Identification of differentially expressed APA products in GBM and normal brain tissues
We used MPSS data from a pool of five normal brain tissues and a pool of five GBM tissues (Lin et al., 2010) to examine whether there were any differentially expressed transcripts resulting from alternative usage of polyadenylation sites. In the end, 14,530 and 12,129 transcripts were detected in the normal brain and GBM tissues respectively. The overall expression patterns is shown in Figure 2A. Although more transcripts were found in normal brain, the numbers of highly expressed transcripts (>10 tpm) from the two pools were highly similar (Fig. 2A). Of these detectable transcripts in the two pools, 13,924 transcripts from 8,777 genes were identified with only one polyadenylation site, while 4,530 mRNAs from 2,733 genes were found with alternative polyadenylation (APA) sites (Supplementary Table S1; supplementary data are available online at www.liebertonline/omi). About 24% genes detected in both the normal brain and GBM tissues had alternative polyadenylation sites. The existence of the APA isoforms increased potential transcripts to a total 24,876, exceeding the number of RefSeq annotated transcripts (13924+4530, 18454 transcripts). The average number of APA per transcript is 1.35 (24876/18454). From the GBM tissues, we observed 2721 short APA transcripts and 1732 long APA transcripts, and in normal tissues, we observed 3203 short transcripts and 2037 long APA transcripts, as reliably detected with the expression level greater than 3 tpm (Table S1, Fig. 2B). In this article, we define the transcript isoforms bearing the most distal polyadenylation sites found in the database as long APA isoforms, and the transcript isoforms bearing the upstream polyadenylaton sites other than the most distal polyadenylation sites as short APA isoforms. Therefore, for a gene, there is only one long APA isoform, but there could be multiple short APA isoforms, for which we did not make any distinctions in this article.

Comparison of APA forms identified from GBM and normal brain tissues.
We analyzed differential expression at APA transcript levels of genes, instead of at the gene level, ignoring APA transcript information between normal and GBM brain tissues. The expression abundance of an APA isoform is represented by the counts of MPSS tag upstream of the polyadenylation sites. In the end, we identified 182 APA transcripts from 148 genes that show significantly differential expression between the normal and GBM brain tissues (Table S2, p<0.01 by the DESeq analysis). We identified 125 differentially expressed APA short isoforms and 57 differentially expressed long APA isoforms. The distribution of APA isoforms among different categories is shown in Figure 2B. The counts of long and short APA transcripts were similar in normal and GBM tissues. However, there were more short APA transcripts whose expression was significantly increased in GBM tissues than those for long APA transcripts (Fig. 2B).
In this work, we focused on identifying genes whose long and short APA isoforms show inconsistent and statistically different (P<0.01 by the DESeq analysis) expression changes (e.g., one APA isoform is upregulated, and at the same time the other isoform is downregulated) between the normal and GBM brain tissues. We found that APA products of three genes MEF2D (myocyte enhancer factor 2D, MADS box transcription enhancer factor 2), HSBP1 (Heat shock factor binding protein 1), and PHC1 [[polyhomeotic homolog 1 (Drosophila)] have the pattern of expression changes that we looked for (Table 1). The transcripts of HSBP1 and PHC1 had two polyadenylation sites in their 3′ UTRs. For these two genes, the abundance of the longer APA transcript did not change between GBM and normal tissues, but the shorter one was expressed at considerable levels in the normal tissues, but was not detectable in the GBM tissues. In contrast, the longer transcript of MEF2D was expressed at high levels in the normal tissues but was not detectable in the GBM tissues, while the expression level of the shorter one did not change significantly between the GBM and normal tissues.
tpm.
We then performed PCR validation of the APA products using four GBM cell lines (M059K, LN229, and U87, all from ATCC, http://www.atcc.org/), one GBM tissue, and one normal brain tissue. We adopted the protocol of Scotto-Lavion et al. (2006) in which two gene specific primers ahead of the upstream polyadenylation site and a common primer containing an adapter and 17 Ts were used. We confirmed the existence of all the alternative polyadenylation sites for MEF2D, HSBP1, and PHC1 by RT-PCR (Fig. 3A).

Confirmation of polyadenylation sites.
The expected bands the APA isoforms were marked by arrows. Both APA isoforms were found for HSBP1 and PHC1, but for the MEF2D, the longer APA isoform of 2904 bp was not identified in the first PCR setting, which does not allow amplification of long products. So we designed another primer and modified the PCR conditions to get the long APA isoform, as shown in Figure 3B. Among the six polyadenylation sites derived from these six APA forms of the three genes, only the short APA isoform polyadenylation sites of MEF2D and HSBP1 were novel and not annotated in the Genbank. We therefore confirmed the PCR products corresponding to these two sites by sequencing (data not shown). The current protocol of validation (Scotto-Lavino et al., 2006), in which two gene specific primers ahead of the upstream polyadenylation site and a common primer containing an adapter and 17 Ts were used, was not amenable for quantification by real-time PCR. Therefore, in this study, we were only able to validate the existence of the APA isoforms but not able to confirm the differential expression changes found by MPSS.
Development of the RNAelements program
We hypothesized that APA events could affect the binding of RBPs to the differentially expressed APA regions. To predict where RNAs would be bound by RBPs, we developed a program that we named RNAelements. We first used known RBP-RNA binding data to develop an algorithm to find common structural (including secondary structure) motif for RBP binding. We focused on those RBPs with genome-wide in vivo immunoprecipitation datasets such as those generated by the RIP-Chip (RNA IP followed by microarray analysis) (Baroni et al., 2008; Keene et al., 2006). In RIP-Chip, the targeted mRNAs bound by RBPs were pulled down by immunoprecipitation and the mRNAs were detected by microarray. However, RIP-Chip can only identify which mRNAs are bound by the RBPs but not the precise binding sites of RBPs. Therefore, it would be useful to develop an algorithm to derived consensus binding motifs for a RBP from RIP-Chip data.
We extracted the RIP-Chip data for AUF1 (HNRNPD) (Mazan-Mamczarz et al., 2009), HNRNPA1 (Eiring et al., 2008), HuR (ELAVL1) (Mukherjee et al., 2009), MSI1 (de Sousa Abreu et al., 2009), NCL (Yang et al., 2002), PUM2 (Galgano et al., 2008), and SSB (Eiring et al., 2008). We adopted the covariance model that took both RNA sequences and secondary structure consensus into account (Nawrocki et al., 2009). RNAdistance in Vienna RNA package (http://rna.tbi.univie.ac.at/) was used to calculate distances between RNA secondary structures
This model was then used to predict the binding sites in novel RNA sequences (Fig. 4A). In the end, we identified the consensus structures and sequences for RNA bindings for these seven RBPs. The structures were visualized by R2R program (Weinberg and Breaker, 2011) (Fig. 4B). The identified motifs were about 30 nt long, with a stable local stem-loop structure. AUF1, HNRNPA1, NCL, and PUM2 have similar binding motifs, with a long stem and a small loop. The binding motifs for HuR and SSB have a big loop and a short stem, and the sequences in the loop were more conserved than that in the stem. The motif for MSI1 has 2 loops and 2 stems, with the stem sequences highly conserved (AGCUGGG……GG….GCC……….GCUAAU). The detailed alignment of the motif is available at http://sysbio.zju.edu.cn/RNAelements/help.php#sto.

Identification of RBP binding sites.
To evaluate the performance of the RNAelements program, we used another kind of global data set generated by CLIP-seq or PAR-CLIP, which sequenced the RNA fragments cross-linked by a RBP using next-generation sequencing technology (Hafner et al., 2010; Kishore et al., 2011; Konig et al., 2010; Wang et al., 2009b). CLIP-seq (or PAR-CLIP) data contain sequences or neighboring sequences of binding regions of RBPS. Because the CLIP-seq or PAR-CLIP-seq data for HuR (Kishore et al., 2011; Lebedeva et al., 2011; Mukherjee et al., 2011) and PUM2 (Hafner et al., 2010) were available, we used them to evaluate the binding sequences of HuR and PUM2 that were predicted by the RNAelement program. The CLIP-seq, PAR-CLIP-seq, or iCLIP data for QKI (Hafner et al., 2010), hnRNPC (Konig et al., 2010), TDP-43 (Tollervey et al., 2011), and TIAL1 (Wang et al., 2010) were used as negative datasets to determine the false positive rate, based on the assumption that QKI, hnRNPC, TDP-43, and TIAL1 are different proteins from HuR and PUM2, and that their binding targets would be different. We compared the performance of RNAelements to RNApromo (Rabani et al., 2008), which was developed based on stochastic context-free grammars (SCFGs) using a set of input RNAs. We used the same training datasets to find motifs by RNApromo with default parameters, and searched the motifs in test datasets to find the hits with RNApromo scores greater than 0. RNAelements has true positive rate of 64.6% compared to 30.33% of the RNApromo program (Table 2) at similar false positive rates of 5.59% and 4.71% (Table 3), respectively. However, none of the AUF1 and HuR motifs found by RNApromo was AU-rich, contradicting to the properties of AUF1 and HuR binding targets identified (Lopez de Silanes et al., 2004; Mazan-Mamczarz et al., 2009). In order to make our pipeline available to the community, we developed a web server for RNAelements at http://sysbio.zju.edu.cn/RNAelements/. Users can visit this web server to predict RBP binding sites for their own RNA sequences.
RBP binding sites were enriched in the 3′ UTR regions between the first and the last polyadenylation sites
Here we used RNAelements to search for RBPs binding sites for the transcripts listed in Table 1. The RBP motifs identified in these genes by RNAelements were annotated with the polyadenylation sites (Fig. 5, Table 4). We found that most of the RBP binding sites were enriched in the 3′ UTR regions between the first and the last polyadenylation sites. All of the predicted RBP sites in HSBP1 mRNA sequences were in the alternative region following the first polyadenylation site, and therefore the shorter mRNA resulting from the upstream polyadenylation site would be free from RBP regulation. For PHC1, the binding sites of HNRNPA1 and NCL were only located at the alternative region, and thus the longer transcript would be specifically regulated by the above two RBPs. Finally, we found that HuR, NCL, and SSB bound to the alternative region of MEF2D. The shorter transcript of MEF2D, which was upregulated in GBM, would escape regulation by these RBPs.
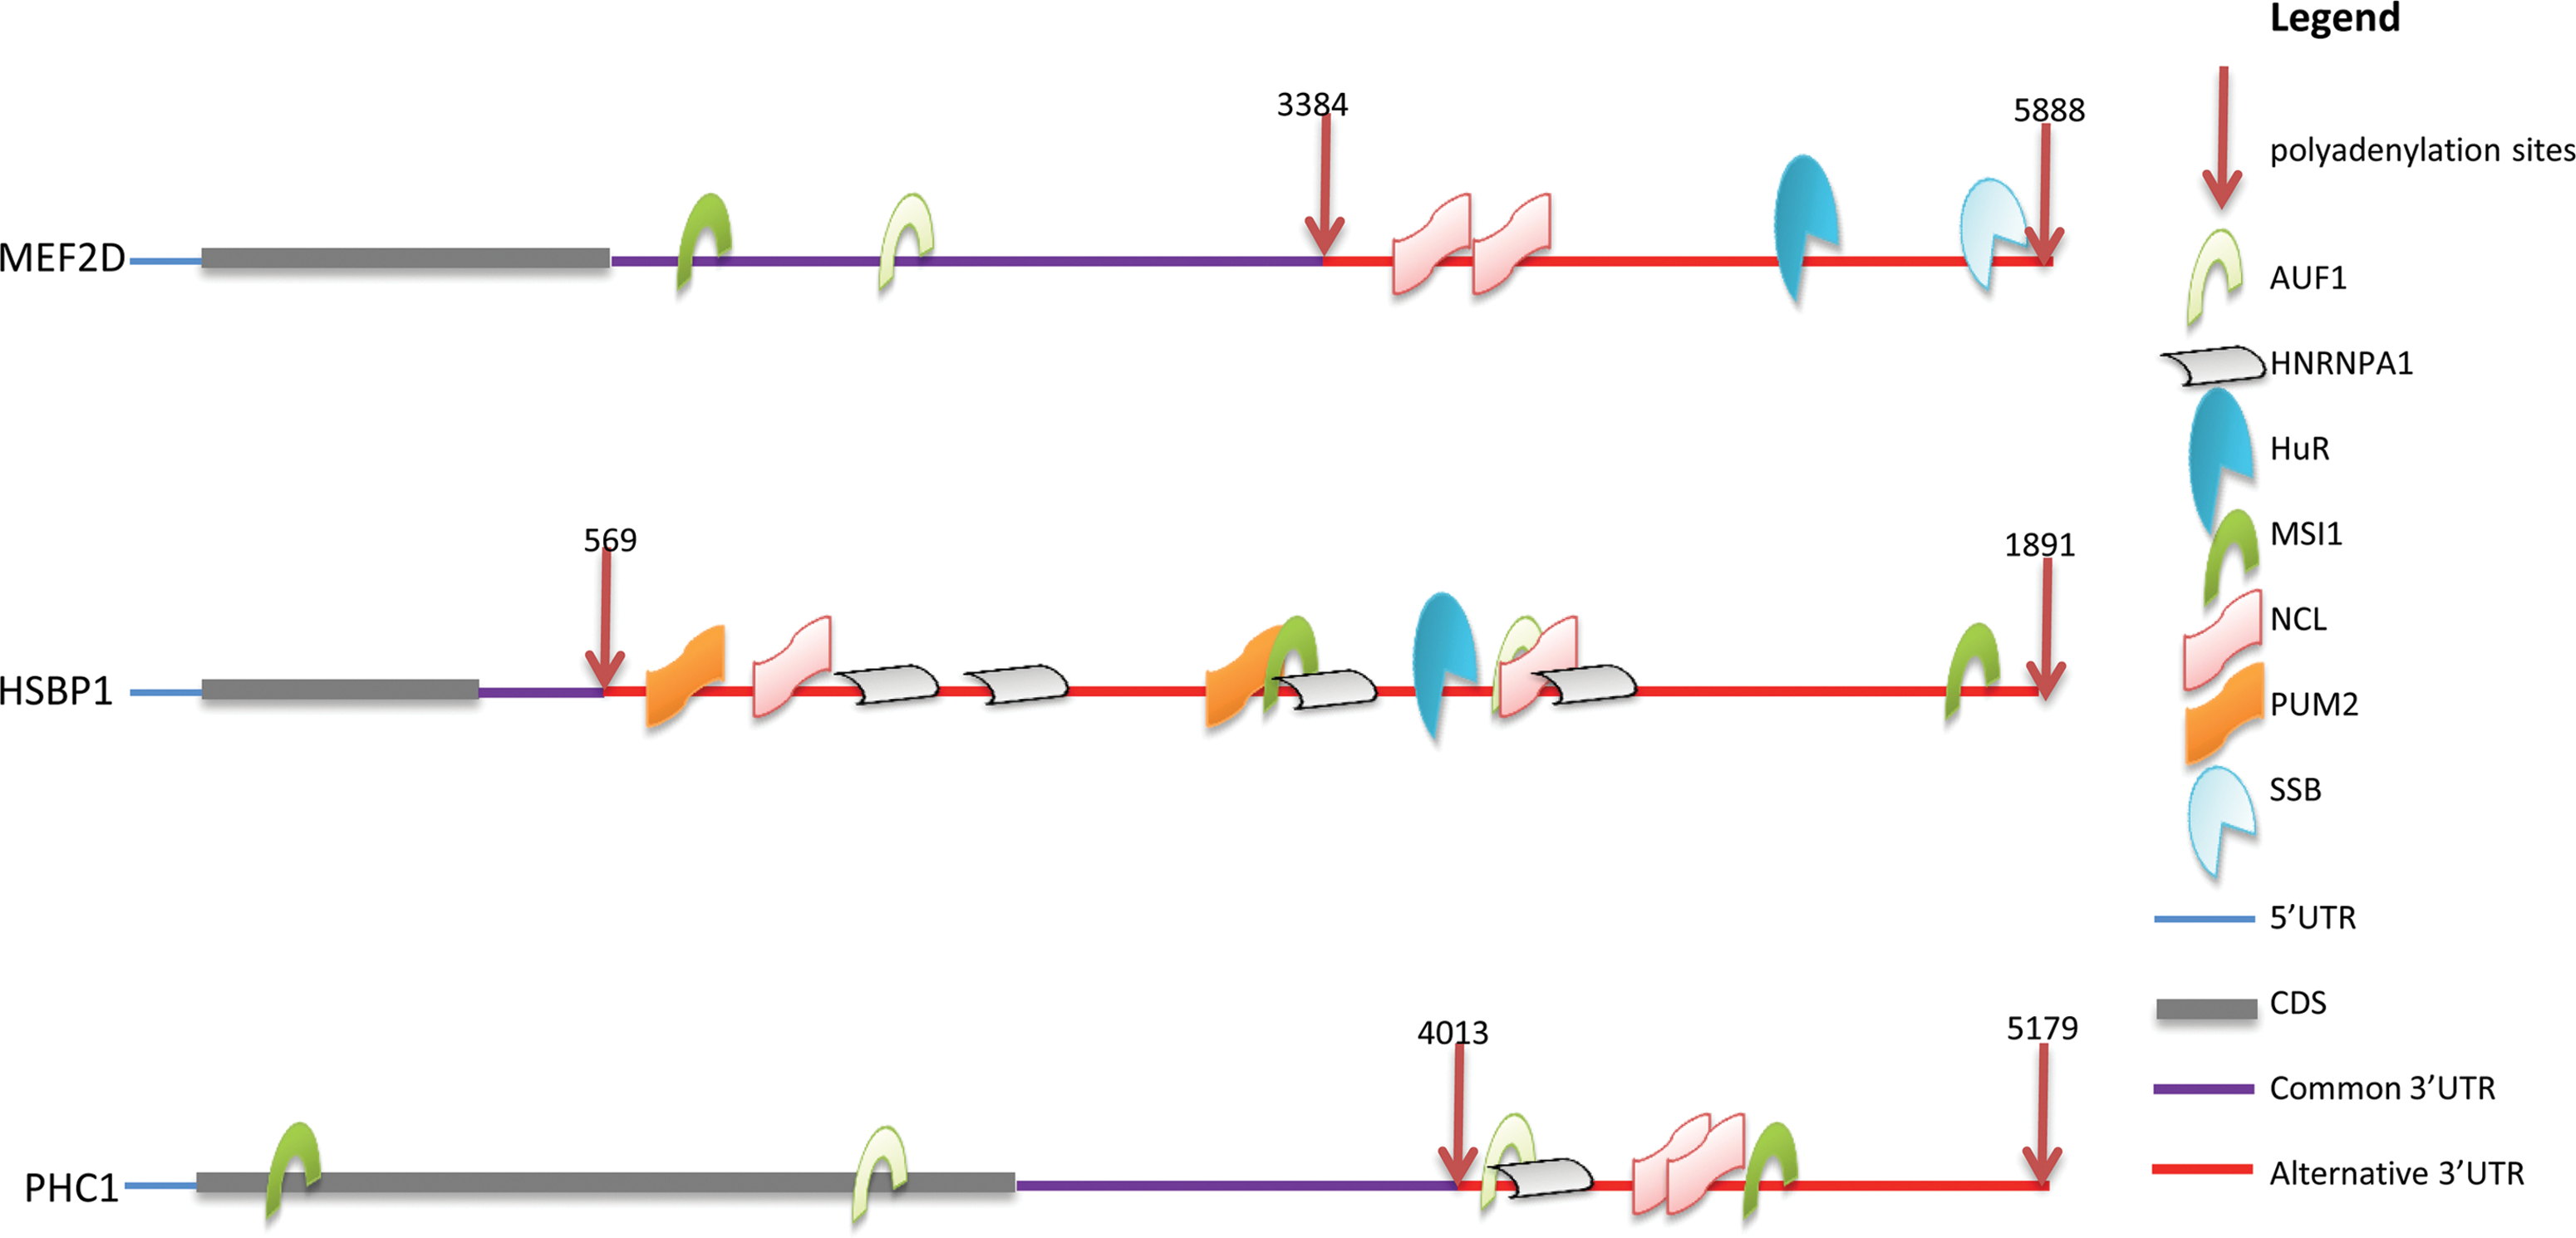
Predicted RBP binding regions for genes with APA isoforms that showed opposite expression changes between normal brain and GBM tissues. Predicted binding sites of seven RNA-binding proteins are shown in the targeted RNA sequences. Most binding sites are located after the first polyadenylation site.
We then checked the expression level for the seven RBP genes from the same MPSS data (Table 5). AUF1 was only expressed in GBM tissues, and all of the 3 genes could be regulated by AUF1 in GBM but not in the normal brain tissues. HuR (Abdelmohsen and Gorospe, 2010) and NCL (Otake et al., 2007; Zhang et al., 2008) were shown to enhance stability of target mRNAs, while SSB were found to promote translation of targets (Sommer et al., 2011). So in normal brain tissues, the long APA MEF2D transcripts could stay longer and produce more proteins. In contrast, all MEF2D mRNAs in GBM tissues are short APA isoforms, and would be unstable due to AUF1 regulation. For HSBP1 and PHC1, half of the transcripts in normal brain would escape regulation from all the 7 RBPs.
tpm.
Discussion
We conducted a comprehensive analysis of the APA products for MPSS data using a stringent pipeline (Fig. 1) and identified 4,530 APA isoforms of mRNAs for 2,733 genes (Table S1). Among them, we identified 182 APA transcripts corresponding to 148 genes that show significantly differential expression between the normal and GBM brain tissues. This represents a first comprehensive characterization of APA events in glioblastoma and would be a good resource for the research community.
In this study, we focused on genes with APA isoforms that showed opposite expression changes between the normal and GBM brain tissues and identified that APA products of three genes MEF2D, HSBP1, and PHC1 fit the criteria (Table 1). MEF2D is a transcriptional activator that binds specifically to the MEF2 element, 5′-YTA[AT](4)TAR-3′ (Fickett, 1996). It plays important roles in regulating skeletal and cardiac muscle development, and in neuronal differentiation and in the control of cell growth, survival, and apoptosis via p38 MAPK signaling pathway (Bandyopadhyay et al., 2010; Kato et al., 2000; Yang et al., 1998). HSBP1 is a protein that binds to heat shock factor 1(HSF1), a transcription factor involved in the heat shock response. HSBP1 negatively regulates HSF1 DNA-binding activity (Satyal et al., 1998). PHC1 is a member of Polycomb Repressive Complex 1 (PRC1), which binds to the H3K27me3 and organizes the chromatin into a repressive structure, and showed overexpression in a broad spectrum of tumor samples compared to their normal counterparts (Sanchez-Beato et al., 2006). However, the biological significance of our findings of these differentially regulated APAs in GBM remains to be investigated.
The short APA isoforms of HSBP1 and PHC1 were present in the normal tissues while undetectable in GBM, but the longer APA forms showed no differential expression between the GBM and the normal tissues. In contrast, the longer transcript of MEF2D was not detectable in GBM tissue, while expression level of the shorter one did not change significantly between GBM and normal tissues. As the PCR confirmation protocol that we used (Scotto-Lavino et al., 2006) used a common primer containing an adapter and 17 Ts, and two rounds of PCR, it is not amenable for quantification by RT-PCR. We therefore have not quantitatively validated the differential expression of different APA forms for the three genes. However, we believe that the APA isoform quantification data from the MPSS analysis is highly reliable, as the expression of these transcripts are very abundant (tpms mostly>80; Table 1) and statistics for identifying differential expressed genes from the highly expressed genes using MPSS are quite reliable (Fan et al., 2011; Jeannette Reinartz et al., 2002).
It is increasingly recognized that 3′ UTR of mRNA harbors elements related with mRNA localization (Andreassi and Riccio, 2009; Chabanon et al., 2004), translation (Irier et al., 2009a; Irier et al., 2009b; Lau et al., 2010), and decay (Mayr and Bartel, 2009; Sandberg et al., 2008; Zlotorynski and Agami, 2008). For example, two brain-derived neurotrophic factor (BDNF) transcripts are generated in the brain, one with a short and the other with a long 3′ UTRs (An et al., 2008). These two isoforms perform different cellular functions. The transcripts with long 3′ UTR are specifically transported to dendrites where they regulate pruning and dendritic spine morphology and act as a bona fide cis-acting translation suppressor for dendrites at rest. However, the transcripts with short UTR are confined to somata mediating active translation to maintain basal levels of BDNF protein production (An et al., 2008; Lau et al., 2010). Another well-studied example is GluR2, which has two classes of transcripts with short and long 3′ UTR of around 4 and 6 kb, respectively (Irier et al., 2009b). The long transcripts of GluR2 seem to suppress translation of GluR2 and the short transcripts are actively being translated (Irier et al., 2009b).
The relationship between the UTR length and cancers has been under active investigations (Mayr and Bartel, 2009; Sandberg et al., 2008; Singh et al., 2009; Zlotorynski and Agami, 2008). It was demonstrated that cancer cells often express mRNAs with shorter 3′ UTR, which exhibit strong stability and produce 10-fold more protein due to a loss of miRNA-mediated suppression in the long UTR region (Mayr and Bartel, 2009). In our analysis, we found that some genes did have inconsistent expression for different APA isoforms in the two tissues studied.
There are two major potential regulatory mechanisms for 3′UTR mediated regulation of mRNA stability, localization, and translation efficiency: through binding of microRNAs (miRNAs) and RNA-binding proteins (RBPs) to regulatory elements embedded in the targeted sequences in the 3′UTR. APA event might change the 3′UTR sequences used in mature mRNAs, via changes in miRNA bindings or in RBP binding. For example, Jenal et al. (2012) recently found that loss of PABPN1 [poly(A) binding protein, nuclear 1] gene resulted in extensive 3′ untranslated region shortening due to enhanced usage of proximal cleavage sites. They further demonstrated that enhanced usage of proximal CSs compromises microRNA-mediated repression using cyclin D1 as a test case (Jenal et al., 2012). As predicting of miRNA bindings was studied extensively and many programs were developed to predict miRNA targets (such as www.microrna.org, mirdb.org, www.targetscan.org etc), we decided to focus on the analysis of the effect of APA on RBP binding.
We developed the RNAelements program (http://sysbio.zju.edu.cn/RNAelements/) to predict RNA bindings in the UTR regions and we found that there seems to be an enrichment for RBP binding in the region between the first and the last polyadenylation sites for the three genes that we focused on here, suggesting that another potential mechanism for regulating the APA expression is the escape from RBP binding in the short APA isoforms of mRNAs. For example, all of the predicted RBP sites in HSBP1 were in the alternative region following the first polyadenylation site, and therefore the shorter APA isoform would be escaped from RBP regulation in the APA region (Fig. 5). To explore whether this is a general mechanism for all APA isoforms that we identified, we compared the number of RBP motifs found in the region of 3′UTR to the first polyadenylation site (named the common region here) to the region between the first and the last polyadenylation sites (named the APA region here). We found that 87 genes (87/148, 59%) have more RBP motifs in the APA region compared to the common region, and 9 genes (9/148, 6%) have the same number of RBP motifs in the two regions. Interestingly, there are 17 genes for which all of the RBP motifs of are located in their APA regions.
RNA binding proteins (RBPs) play important roles in post-transcriptional processes, regulating mRNA processing, localization, translation, and stability (Chabanon et al., 2004; Halbeisen et al., 2008; Hieronymus and Silver, 2004; Keene, 2007; Moore, 2005). For example, the translation of murine TNF-alpha is controlled by two AU-rich regions in its 3′ UTR (Lin and Patel, 1997). The binding of two RNA binding proteins CUG-BP1 and HuR to the 3′ UTR of SBP2 (selenocysteine insertion sequence binding protein 2) is responsible for the regulation of the expression of SBP2 protein, which varies widely across tissues and cell types examined although only modest variation in SBP2 mRNA levels (Bubenik et al., 2009). In human embryonic stem cells, RNA binding protein PUM2/PUF binds to 3′ UTR elements in Erk2 and p38alpha, two key genes involved in the mitogen-activated protein kinase (MAPK) pathway, to downregulate their expression mRNAs (Goutsias and Lee, 2007). However, how the RBPs regulate APA isoforms of the three genes (HSBP1, PHC1, and MEF2D) that we identified remains to be further investigated.
Recently, several computational methods have been developed to search RNA structural motifs considering both sequences and secondary structures. For example, RNApromo is developed to identify structural elements within mRNAs that are bound by the same RBPs and with a common cellular localization using covariance model (Rabani et al., 2008). RNAcontext is designed to elucidate RBP-specific sequence and structural preferences with better accuracy, assuming that the primary role of RNA secondary structure in RBP binding is to establish a structural context (e.g., loop or unstructured) for RBP binding (Kazan et al., 2010). However, RNAcontext was developed based on the datasets generated by RNAcompete, which is an array‐based assay that queries RNA‐binding protein for a defined pool of RNA oligos with a single binding reaction. RNAcontext is therefore not applicable to long RNA sequences. There are also other computational tools aimed to identify conserved RNA motifs, such as RNAMotif (Macke et al., 2001), RNAalifold of Vienna RNA package (Hofacker et al., 2002), comRNA (Ji et al., 2004), RNAProfile (Pavesi et al., 2004), MEMERIS (Hiller et al., 2006), Foldalign (Havgaard et al., 2005), Cmfinder (Yao et al., 2006), RNA Sampler (Xu et al., 2007), Locomotif (Reeder and Giegerich, 2007), and RNAz (Gruber et al., 2007). However, these RNA motif finders aimed to find short sequence motifs, therefore they are not suitable for the identification of long motifs containing secondary structural information important for RBP binding in RNA sequences. For example, the PUM2 motif identified previously by others has the consensus sequence “UGUANAUA”, which was identified using a Gibbs sampling motif finder (PhyloGibbs) (Siddharthan et al., 2005) in Hafner et al.'s article (Hafner et al., 2010) or MEME, a program designed to search short DNA binding motifs (Bailey et al., 2006), in Galgano et al., (2008). In both articles, the settings were set to find short sequence motifs [e.g., 6–10 nucleotides expected motif length in Galgano et al. (2008)], and without consideration of RNA fold, etc. The RNAelements algorithm we developed here takes into consideration of both RNA sequences and secondary structures and therefore tends to identify longer motif sequences. Indeed, a close examination of the short sequence motif (UGUANAUA) and our longer motif for PUM2 in Figure 4b revealed that the first 5 nucleotide UGUAN in the short motif matches to a motif URYRU (R=A,G, Y=C,U) in our longer motif. Furthermore, the motif we identified could be found in more than 70% of PUM2 CLIP sequences. This percentage is similar to what Galgano et al. (2008) described that 74% of the PUM2 targets contains the UGUANAUA motif.
We therefore developed the RNAelements program, which aimed to identify motifs containing secondary structural information important for RBP binding from recent CLIP-seq or RIP-chip data for RBPs. The program is available for public use at http://sysbio.zju.edu.cn/RNAelements/. The RNAelements performed better than RNApromo (Rabani et al., 2008) in identifying binding motifs with a higher percentage of matches to the known RBP datasets (Table 2). As only a few large-scale datasets are available for RBPs, our server is thus limited for those RBPs.
Conclusions
Our work provides a comprehensive APA isoform dataset for GBM and normal brain tissues. We identified and confirmed the existence of differentially expressed APA isoforms for GBM and normal tissues. In addition, we developed a novel RBP binding motif prediction program—RNAelements. Finally, we found that RBPs tend to bind to the APA regions between the first and the last polyadenylation sites, suggesting a potential novel mechanism of regulating the expression of short APA isoforms by escaping from RBP binding. These observations collectively lay a foundation for novel diagnostics and molecular mechanisms that can inform future therapeutic interventions for GBM.
Footnotes
Acknowledgments
The work was funded by the grant 81072060 from the National Natural Science Foundation of China. The funders have no role in the study design; in the collection, analysis, and interpretation of data; in the writing of the manuscript; and in the decision to submit the manuscript for publication.
Author Disclosure Statement
The authors declare that no conflicting financial interests exist.
References
Supplementary Material
Please find the following supplemental material available below.
For Open Access articles published under a Creative Commons License, all supplemental material carries the same license as the article it is associated with.
For non-Open Access articles published, all supplemental material carries a non-exclusive license, and permission requests for re-use of supplemental material or any part of supplemental material shall be sent directly to the copyright owner as specified in the copyright notice associated with the article.