
Abstract
Abstract
In men at high risk for prostate cancer, established clinical and pathological parameters provide only limited prognostic information. Here we analyzed a French cohort of 103 prostate cancer patients and developed a gene panel model predictive of outcome in this group of patients. The model comprised of a 15-gene TaqMan Low-Density Array (TLDA) card, with gene expressions compared to a standardized reference. The RQ value for each gene was calculated, and a scoring system was developed. Summing all the binary scores (0 or 1) corresponding to the 15 genes, a global score is obtained between 0 and 15. This global score can be compared to Gleason score (0 to 10) by recalculating it into a 0–10 scaled score. A scaled score ≥2 suggested that the patient is suffering from a prostate cancer, and a scaled score ≥7 flagged aggressive cancer. Statistical analyses demonstrated a strongly significant linear correlation (p=3.50E-08) between scaled score and Gleason score for this prostate cancer cohort (N=103). These results support the capacity of this designed 15 target gene TLDA card approach to predict outcome in prostate cancer, opening up a new avenue for personalized medicine through future independent replication and applications for rapid identification of aggressive prostate cancer phenotypes for early intervention.
Introduction
Clinical and pathological parameters such as Gleason score, tumor-node-metastasis (TNM) stage, surgical margin status, and preoperative serum prostate-specific antigen (PSA) after prostatectomy are predictors of outcome in prostate cancer patients (Blute et al., 2001; Humphrey, 2004). However, there is a need to find other markers to improve the prediction of disease recurrence and the selection of appropriate adjuvant therapy for high-risk patients (Huang et al., 2009).
Recent progress in gene array technology has led to the development of several candidate prognostic cancer models based on multiple gene panels or signatures (Cheville et al., 2008; Kosari et al., 2008; Mesko et al., 2010; Steinbach et al., 2006) where the selected candidate genes are designed to account for the heterogeneity of prostate cancer and provide prognostic information in high-risk patients beyond that provided by established clinical and pathological prognostic features. Candidates have also been tested as predictors of tumor behavior in case studies on patients with radical retropubic prostatectomy and prostate cancer biopsies. These assay-based clinical markers were designed to help clinicians and patients make informed treatment decisions.
Patients and Methods
Biopsy collection
The study included 103 patients; 13 with radical retropubic prostatectomy and samples were preselected by the anatompathologist in Cochin Hospital (St-Vincent-de-Paul, France) in 2008, and 90 biopsies from patients belonging to the Centre Hospitalier Universitaire of Clermont-Ferrand (France) in 2010. These patients had sextant biopsies and classified by the anatomopathologist (Hodge et al., 1989). All patients gave their informed consent to donate the remaining post-diagnosis samples to research. All prostatectomy samples were conserved in liquid nitrogen in the tumor bank of Anatomo-cyto-pathology department of CHU Cochin–St Vincent de Paul and corresponding RNA samples were prepared in their service. All studied biopsies are housed at the Centre Jean Perrin Tumor Bank (58 Rue Montalembert, BP 392, 63011 Clermont-Ferrand Cedex 1), accredited under No. AC-2008-112, for 5 years (i.e., until December 27, 2013).
RNA extraction
Each prostate biopsy was weighed, disrupted quickly on ice with a tissueRuptor (Qiagen) in RLT+ buffer added with β-mercaptoethanol. Total mRNA isolation was performed using an RNA easy mini kit (Qiagen), following the manufacturer's protocol with an RNeasy spin column and different wash buffers. The quality of total mRNA obtained with the Qiagen kit was verified by electrophoresis on an Agilent® 2100-series BioAnalyzer, and the quality of each sample was determined with the ratio 2 for 18S/28S rRNA. Final RNA concentration (A260:A280 ratio) and purity (A260:A230 ratio) was measured using a NanoDrop ND-8000 spectrophotometer (NanoDrop Technologie, LabTec).
TaqMan mRNA analysis by RT-qPCR
Gene expression data was obtained using TaqMan Low Density Array (TLDA), a 384-well microfluidic card (Cat no: 4342261, Applied Biosystems) capable of performing 384 simultaneous real-time PCR runs, that has been used for gene expression profiling in several studies (Schobesberger et al., 2008; Steinbach et al., 2006). The fluorogenic FAM-labeled probes and sequence specific primers for the list of genes (Table 1) with endogenous control 18S rRNA were obtained as inventoried in the TaqMan array format. This low- to medium-throughput microfluidic card can run 8 triplicate samples against 16 TaqMan Gene Expression Assay targets that are preloaded into each card well. cDNA was generated using the High-Capacity cDNA Reverse Transcription Kit according to the manufacturer's protocol. The RT-PCR runs used 2 μg of RNA per sample. Each sample used 120 ng cDNA, qsp 60 μL nuclease-free water, and 60 μL 2x TaqMan Universal PCR Master Mix (Applied Biosystems) added for the real-time qPCR measurements. We then transferred 100 μL (100 ng) of the mixture into each sample-loading port of the TLDA connected to one set of the 16 genes of interest. The arrays were centrifuged once (at 1,300 g for 1 min at room temperature) to equally distribute the sample across the wells. The card was then sealed to prevent exchange between wells. RT-qPCR amplification was performed using an Applied Biosystems Prism 7900HT sequence detection system under the following thermal cycler conditions: 2 min at 50°C and 10 min at 94.5°C, followed by 40 cycles of 30 s at 97°C and 1 min at 59.7°C.
Relative gene expression was determined using the comparative CT (threshold cycle) method, which consists of normalizing the number of target gene copies to an endogenous reference gene (18S rRNA) designated as the calibrator (Fink et al., 1998). The level of each mRNA gene in each sample was then normalized to an RNA reference corresponding to a pool of 32 normal prostate tissues from Caucasian subjects (Clontech, Human Prostate Total RNA, 636550). Values are given as mean±SD for three assays.
Results
Patient parameters
Table 2 reports the Gleason score obtained in the 103 studied samples. The Gleason score was classified into three groups: Gleason score ≤5, Gleason score >7, and 5< Gleason score ≤7. We compared gene expression results between healthy samples and the samples from patients in each of the three Gleason groups (Fig. 1). Principal component analysis of these gene sets also distinguished the separate sample groups. The group of patients with Gleason score ≤5 showed significant underexpression of the studied panel of 15 genes (p<0.01 for all genes, except BRCA1 p<0.05). Conversely, the group of patients with Gleason score >7 showed strong overexpression of the studied panel of 15 genes compared to healthy-sample controls, but only AMACR and BRCA2 were significantly overexpressed (p<0.05), due to the weak number of samples. The group with a Gleason score of between 5 to 7 showed moderate underexpression of the studied panel of 15 genes compared to the group with Gleason score ≤5, but only COL4A3 (p<0.01) and BCL2 (p<0.05) were significantly different.
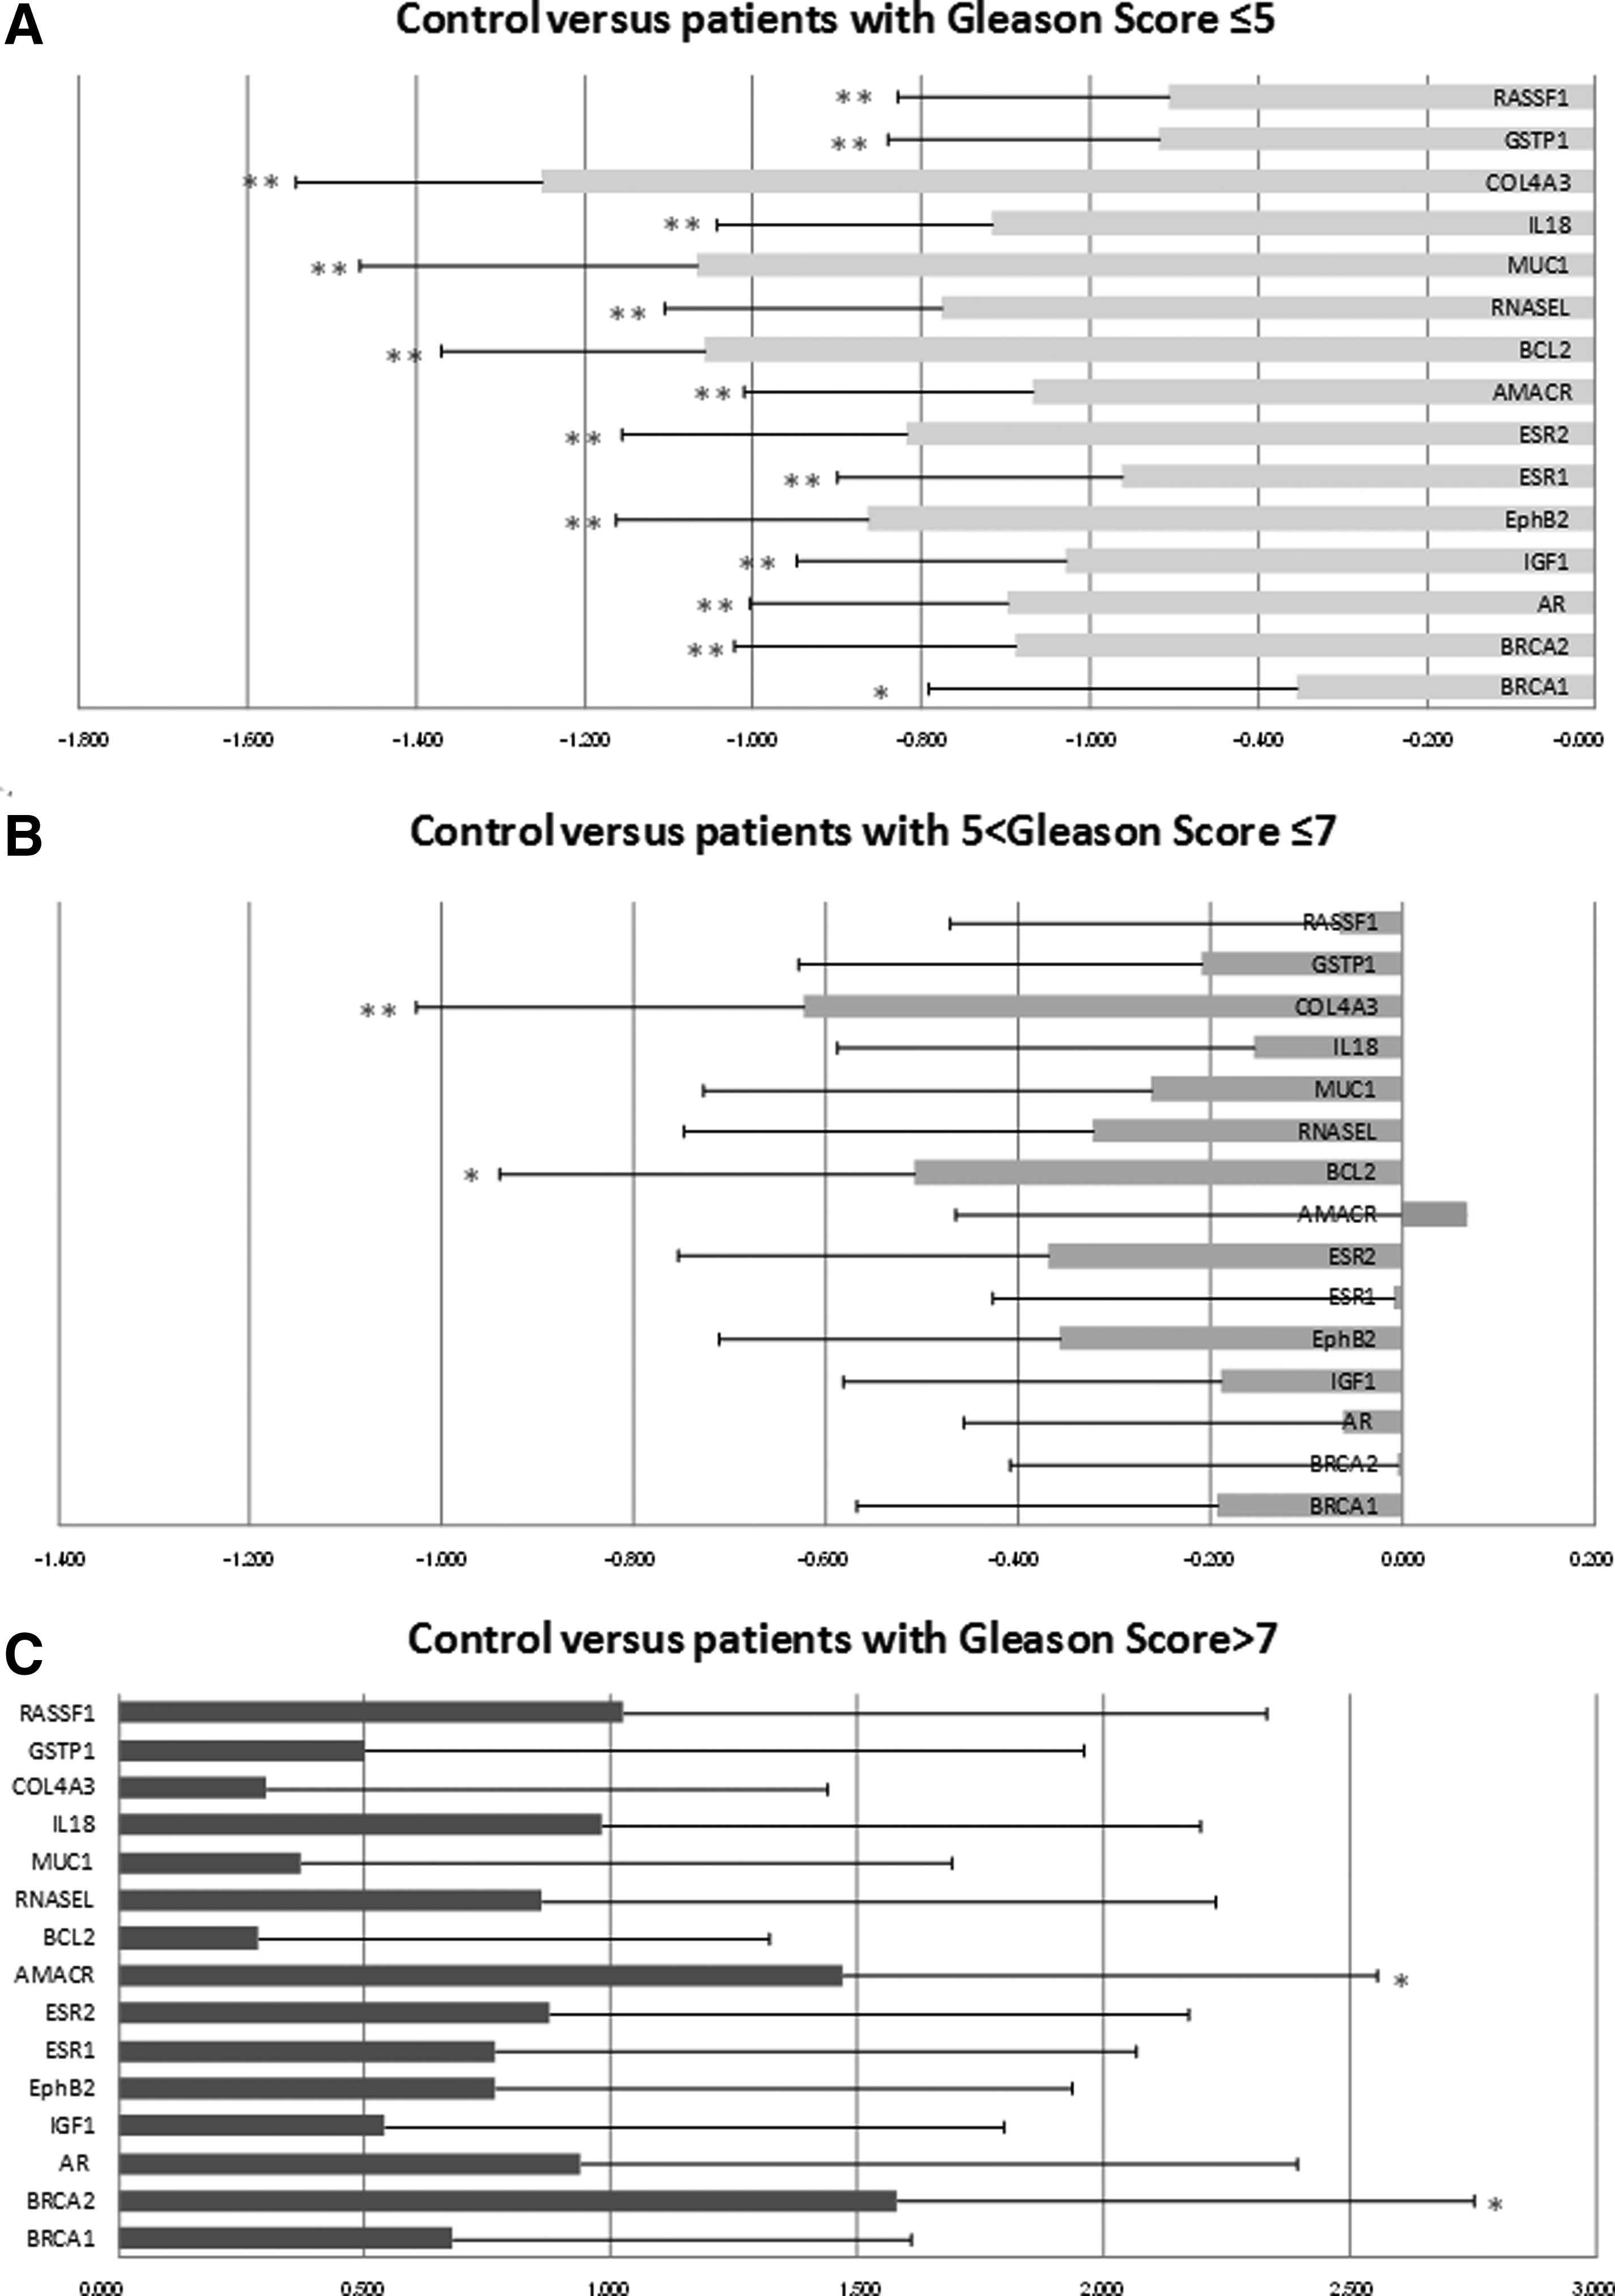
Fold changes of 15 studied genes differentiating controls and prostate cancer with different Gleason scores. Gene fold change values showing differential expression between prostate cancer and controls, were generated from RT-qPCR measurements, and represent the difference in means for prostate cancer versus control. The control corresponded to a pool of 32 normal prostate tissues from Caucasian subjects (Clontech).
Scaled score process and statistical analyses
Table 3 reports RT-qPCR results for a patient presenting a Gleason score of 6 and the corresponding scaled score calculated. The overexpression or underexpression of the 15 studied genes, compared to the RNA reference corresponding to a pool of 32 normal prostate tissues from Caucasian subjects, was calculated using RQ Manager software and charted in Excel. Using LOG (RQ) with reference set to 0, if the calculated value is positive, the gene is overexpressed, and if the calculated value is negative, the gene is underexpressed. In this method, the global score was calculated with a binary score where an overexpressed gene scores 1 and an underexpressed gene scores 0. However, the scale of the attributed score can be modified by adjusting the score to give greater weight to specific important genes. Thus, a score of 1 is attributed if the difference in expression between the studied sample and control is representative of prostate cancer. For example, for the IGF1 gene known to be overexpressed in cancer, if IGF1 is overexpressed in the studied sample compared to control, it will score 1, and conversely, if IGF1 is underexpressed, it will score 0. Similarly, for the AR gene known to be underexpressed in adenocarcinoma, if AR is underexpressed in the studied sample compared to control, it will score 1, but if AR is overexpressed, it will score 0.
The relative quantification of each gene is given as median. RQ is calculated as 2-ΔCT, where ΔCT=CT-CT (18s rRNA). Fold change indicates the ratio of relative quantification in patients over ratio in normal prostate RNA (i.e., 2-ΔΔCT).
Summing all the binary scores (0 or 1) corresponding to the 15 genes gives a global score between 0 and 15. This global score can be compared to Gleason score (0 to 10) by recalculating it into a 0–10 scaled score using the formula:
where Xmin is the minimum global score, Xmax is the maximum global score, XmaxG is the maximum Gleason score (10), and XminG is the minimum Gleason score (0). For example, when a global score of 9 is obtained with all 15 genes receiving a binary score (0 or 1), the scaled score, as calculated below, will be 6:
A scaled score ≥7 suggests that a patient has prostate cancer with an aggressive phenotype, whereas a scaled score ≥2 corresponds to a less aggressive cancer phenotype.
Table 3 illustrates the scaled score obtained after relative quantification of the 15-gene panel in a patient presenting a Gleason score=6. Note that the scaled score for this same case also came to 6, correlating with the Gleason score.
Linear correlations between scaled score and Gleason score
Linear correlations were performed between the scaled score and Gleason score, and then between each gene expression level and Gleason score. The formula used was: p=STUDENT LAW (r, n-2, 2), where r is the correlation coefficient, following a Student's distribution with n-2 degrees of freedom, and n is sample size. As shown by Table 4, the linear correlation between scaled score and Gleason score for the whole cohort (N=103) was highly significant (p=3.50E-08). Moreover, when the 103 prostate cancer samples were studied for the expression levels of specific genes such as IGF1, AMACR, BCL2, RNASEL, and GSTP, all the genes were significantly correlated with the Gleason score (p≤0.05), and AR was strongly significant correlated with the Gleason score (p≤0.01).
P=STUDENT LAW (r, N-2, 2), when N is number of samples, *p≤0.05, **p≤0.01.
Discussion
Candidate prognostic cancer models based on multiple gene panels or signatures have already been proposed (Idikio et al, 2011; Lossos et al., 2004; Ramaswamy et al., 2003; van de Vijver et al., 2002) including several for prostate cancer (Bismar et al., 2006; Cheville et al., 2008; Glinsky et al., 2004; Kosari et al., 2008; Li et al., 2012; Roobol et al., 2011; Ross et al., 2012; Singh et al., 2002).
Molecular profiles can identify characteristics of tumor cells not yet within the scope of pathological and clinical evaluations. When constructing a molecular profile of prostate cancer, it is important to consider the heterogeneity of the disease.
Ideally, it would be possible to find molecular markers of progression by analyzing tissue samples with patient follow-up. However, expression platforms such as TLDA require RNA of a quality that can only be found in frozen tissue samples conserved in tumor banks.
In order to develop a gene panel model predictive of outcome in patients with prostate cancer, we previously designed a real-time PCR low-density array that included relevant genes for prostate cancer and identified candidate markers by analysis of BRCA1, BRCA2, AR, and IGF-I gene expressions in a cohort of 98 prostate biopsies (Rabiau et al., 2011). We used TaqMan RT-qPCR for mRNA detection and immunohistochemistry to find correlations with proteins. Among the 98 studied prostate biopsies, expression levels of the four genes showed strong heterogeneity within the different histological types. However, we found that BRCA1 and BRCA2 mRNA were underexpressed, especially in healthy tissues. AR expression was tumor stage-dependent. IGF-I was specifically expressed in tumors, whereas for BRCA1, BRCA2, and AR, there was only a nonsignificant trend between protein expression and mRNA expression. For IGF-I, mRNA expression and staining intensity were significantly correlated (p<0.012). The AR biomarker was fairly correlated to diagnosis (p=0.013). AR expression was found to be lower in tumors, with 43% sensitivity and 90% specificity. With relative risk=2.05 [1.13 – 3.69], there was a 2-fold higher chance of cancer occurrence when AR ≤0.206.
MUC1 was also included in the design of the 15 TLDA panel as this gene is expressed at high levels in prostate tumors (Garbar et al., 2008; Rajabi et al., 2012). MUC1 expression was significantly more frequent in patients with a Gleason score >7 than in normal prostates, indicating that increased MUC1 expression is mainly associated with late events in prostate cancer development and MUC1 is upregulated during cancer progression (Cozzi et al., 2005). Our previous immunohistochemical analysis of MUC1 expression in 100 prostate biopsies (Rabiau et al., 2009) found, like others, that tumor prostate tissues showed intensive MUC1 staining compared to normal tissues. Moreover, Gleason score appeared to correlate to MUC1 staining.
Other candidate genes were chosen as predictors of tumor behavior. GSTP1 is a phase-II detoxification enzyme coded by a gene located at 11q3. In 90 of prostate cancers, there is loss of expression of GSTP1 due to methylation of the CpG islands of its promoter (Lee et al., 1994; Mahapatra et al., 2012; Reibenwein et al., 2007). RASSF1 is a tumor suppressor gene that shows loss of expression in lung cancer, renal carcinomas with clear cells, and 74% of prostate cancers. This loss was related to CpG island methylation and deacetylation of histones in its promoter located at 3p21 (Kawamoto et al., 2007; Van Neste et al., 2012). EphB2 is a tumor suppressor gene located at 1p36.1 whose nonsense mutation is found in 10% of sporadic prostate cancers (Adjakly et al., 2011; Kittles et al., 2006; Vardi et al., 2010).
Other genes such as ERα and ERβ were studied because they have been identified in normal and prostate cancer tissues. Loss or downregulation of ER expression in prostate cancer has been frequently documented (Latil et al., 2001; Lau et al., 2000; Nakamura et al., 2013; Walton et al., 2009). However, it is known from previous studies that the ER promoter is extensively methylated both in prostate cancer cell lines and prostate cancer tissues, leading to ER gene inactivation in prostate cancer (Li et al., 2000; Walker, 2011).
Anti-apoptotic BCL-2 expression resulting in apoptosis resistance in prostate cancer was also investigated in the gene panel (Arbab et al., 2012; Mazzolini et al., 2012).
The panel also included RNASEL at chromosome 1q25, which encodes ribonuclease L, part of the interferon-mediated immune response to viral infection. Meyer et al. (2010) investigated the association between variation in RNASEL and prostate cancer risk and progression in a study of 1286 cases and 1264 controls nested within the prospective Physicians' Health Study. The results of this study support a link between RNASEL and prostate cancer and suggest that the association may be mediated through inflammation (Jin et al., 2012; Meyer et al., 2010).
Several molecules have been proposed as positive immunohistological markers of prostate carcinoma, the most widely used being α-methylacyl coenzyme A racemase (AMACR) which is expressed in 80%–100% of prostate adenocarcinomas (Dabir et al., 2012; Kumaresan et al., 2010; Scarpelli et al., 2012; Trpkov et al., 2009).
Concerning the IL18 gene, Dwivedi et al. (2011), studying a subpopulation of 149 prostate carcinoma patients with 3-year follow-up, concluded that serum IL-18 has the potential to be a better diagnostic marker with higher specificity and sensitivity and a more valuable prognostic marker than PSA in prostate carcinoma.
Finally, the panel included COL4A3 gene corresponding to type-IV collagen. This major structural component of basement membranes is a multimeric protein composed of three alpha subunits. The gene encodes alpha 3.
The approach reported here included high-throughput gene expression profiling with quantitative measurements of expression levels of candidate biomarkers. Relative quantification of a 15 target gene TLDA panel in 103 patient tissues was performed, and the corresponding global weighted scores were calculated. Linear correlations were performed between Gleason score and scaled score and then between the Gleason score and the expression level of each gene. We found a highly significant linear correlation (P=3.50E-08) between scaled score and Gleason score for the whole cohort (N=103). Moreover, when the 103 prostate cancer samples were studied for the expression levels of specific genes such as IGF1, AMACR, BCL2, RNASEL, and GSTP, all the genes were significantly correlated with Gleason score (p≤0.05), and AR was strongly significant correlated with Gleason score (p≤0.01).
This studied 15 target gene TLDA card approach offers promise as a sample screening method for rapid identification of aggressive prostate phenotypes, opening up potential applications for outbreak investigations and disease surveillance.
Conclusion
The quantification of gene expression is one of the key endpoints for understanding the molecular events initiating prostate cancer and establishing cancer prognosis. This gene panel approach can play a major role in the development of personalized medicine for prostate cancer.
Footnotes
Acknowledgments
N. Rabiau received a grant from “les FondsFEDER Europe.” All prostatectomy samples were conserved in liquid nitrogen in the tumor bank held by the Anatomo-cyto-pathology department at CHU Cochin–St-Vincent-de-Paul and all the biopsies are housed at the Centre Jean Perrin Tumor Bank (58 –Rue Montalembert –BP 392- 63011 Clermont-Ferrand Cedex 1), accredited under No. AC −2008-112, for 5 years (i.e., until 27 December 2013).
Author Disclosure Statement
The authors declare they have no conflicting financial interests.