
Abstract
Abstract
Despite the major advances in diagnosis and treatment, esophageal squamous cell carcinoma (ESCC) remains a major life-threatening disease. Early diagnosis is critical for guiding the therapeutic management of ESCC. This case-control study focused on the proteomic analysis of serum of healthy volunteers and ESCC patients using the ClinProt profiling technology based on mass spectrometry. A total of 80 healthy volunteers and 119 ESCC patients were enrolled. We identified a pattern of proteins/peptides (including m/z 1867, 2700, and 2094) and differentiated ESCC patients from healthy volunteers with sensitivity and specificity close to 100%. Using mass spectrometry (LTQ orbitrap XL), tubulin beta chain, filamin A alpha isoform 1, and cytochrome b-c1 complex subunit 1 were identified as the three differentially expressed proteins/peptides in the patient serum. These three dysregulated proteins/peptides could be involved in the pathogenesis of ESCC and may serve as putative serological diagnostic biomarkers of ESCC. We suggest that further proteomics and multi-omics research are warranted to identify novel post-genomics diagnostics that can in the future pave the way for personalized medicine for patients with ESCC, a cancer for which we currently lack an integrated battery of diagnostics in the field of oncology.
Introduction
Long-term survival is correlated with stages of EC, as evidenced by 40%–62% and 18%–25% of 5-year survival rate for stages I and IIA and stages IIB and III, respectively (Iizuka et al., 1989). Aside from monitoring tumor progression, identification of effective biomarkers for early diagnosis and potential therapeutic targets offers the best chances to lower the morbidity and mortality of ESCC.
In the 50-year history of biomarker discovery, an increasing number of target proteins as potential cancer biomarkers have served as useful clinical diagnostic tools. These findings have improved our general understanding of the pathogenesis of ESCC; however, the diagnostic biomarkers in ESCC are not specific and sensitive enough (Ebert and Rocken, 2006). Blood is an easily accessible and easy-to-use clinical specimen compared with tissue. Thus, the need for simple blood tests that could be used for the early detection of ESCC is crucial for its ultimate control and prevention.
Since the coining of the term “proteomics” in the 1990s, proteomic methods have been widely used for investigational studies in clinical biology. The emerging field of clinical proteomics is especially well suited to the discovery and implementation of potential biomarkers because body fluids are a cellular and protein-rich information reservoir that contains traces of what the blood has encountered during its circulation throughout the body (Fan et al., 2011; Fan et al., 2012b; Fan et al., 2012c; Issaq et al., 2007; Pan et al., 2011; Wulfkuhle et al., 2003). We previously quantified 16 dysregulation proteins/peptides in ESCC using ClinProt (Bruker Daltonics, Ettlingen, Germany), magnetic bead (MB), and matrix-assisted laser desorption/ionization time of flight mass spectrometry (MALDI-TOF MS) (Fan et al., 2012c). However, the dysregulation proteins/peptides were not identified. Mass spectrometry (LTQ orbitrap XL, Michrom Bioresources, Auburn, MA) shows great potential for protein identification (Tang et al., 2011). Therefore, we applied a combination of MB, MALDI-TOF MS, and LTQ Orbitrap XL MS/MS to analyze and identify the serum biomarkers associated with ESCC.
Materials and Methods
Reagents and instruments
AutoFlex IVMALDI-TOF MS, MTP 384 target plate polished steel, α-cyano-hydroxycinnamic (CHCA), MB-WCX kit, and peptide calibration standard were purchased from Bruker Daltonics (Leipzig, Germany). Trifluoroacetic acid (TFA) was purchased from Alfa Aesar (Ward Hill, MA, USA). Acetonitrile (ACN), Nano Aquity UPLC, and LTQ Orbitrap XL MS/MS were acquired from Sigma (St. Louis, MO, USA), Waters Corporation (Milford, USA), and Michrom Bioresources (Auburn, MA, USA), respectively.
Patients, healthy volunteers, and sample collection
A total of 80 healthy volunteers (blood donor volunteers) and 119 ESCC patients were enrolled with the permission of the Ethical Commission of the No. 150 Central Hospital of the People's Liberation Army (PLA). Blood was collected after informed consent was obtained from the patients. Each of the volunteers was validly registered in No. 150 Central Hospital of the PLA Cancer Center, and the serum samples had been obtained in the last 2 years. Endoscopy was performed on all healthy volunteers to exclude the presence of incidental digestive tract masses. The ESCC patients underwent clinical staging, surgical lesion excision, and follow-up sessions. The pathologic samples were classified according to the 7th edition of the American Joint Committee on Cancer staging manual and the future of Tumor–Node–Metastasis (TNM) (Edge and Compton, 2010).
The samples were randomly split into a model construction group and an external validation group. The model construction group (including 40 healthy volunteers and 60 ESCC patients) was used for the screening of signals related to proteins/peptides expressed differentially in ESCC patients and diagnostic pattern recognition. These proteins/peptides were compared with the healthy volunteers. The external validation group (including 40 healthy volunteers and 59 ESCC patients) was used for the independent validation of the diagnostic patterns blindly. The gender ratio (male/female) of healthy volunteers and ESCC patients was 1.34 and 1.09, respectively. The mean age of healthy volunteers and ESCC patients was 53.71±9.05 years and 59.37±11.13 years, respectively. The age and gender differences of healthy volunteers in the model construction group and the external validation group were not significant. No significant differences were observed for the TNM stage of ESCC between the model construction group and the external evaluation group (Table 1).
Pearson Chi-square test; bindependent samples t-test.
Serum samples were prepared by collecting blood in a vacuum tube and allowing it to clot for 30 min at room temperature. Approximately 1 mL of serum was obtained after centrifugation at 2000 rpm for 10 min and stored in small aliquots at −80°C until analysis.
Sample purification
MB-WCX was used for protein/peptide separation of samples following the standard protocol by the manufacturer (Ketterlinus et al., 2005). Briefly, 10 μL of WCX-MB binding solution and 10 μL of WCX-beads were combined in a 0.5 mL microfuge tube after thoroughly vortexing both reagents. Subsequently, a 5 μL aliquot of serum sample was added to the microfuge tube and mixed by pipetting up and down. The samples were then placed in a magnetic bead separator, where the beads were pulled to the side by magnetic force, allowing the supernatant to be removed and discarded. After three washes with MB-WCX washing solution, the supernatant was removed and the beads remained in place. WCX-MB elution buffer (5 μL) was added to disperse the beads in tubes by pipetting up and down. The beads were pulled to the side, and a fraction of the eluate was transferred to another tube. WCX-MB stabilization solution (5 μL) was added to the collected supernatant, mixing intensively by pipetting up and down. The mixture was ready for spotting onto MALDI-TOF MS targets and measurement.
Prior to the MALDI-TOF MS analysis, we prepared targets by spotting 1 μL of the proteome fraction on the polished steel target (Bruker Daltonics). After air drying, 1 μL of 3 mg/mL CHCA in 50% ACN and 50% Milli-Q with 2% TFA was applied onto each spot, and the target was air dried again (co-crystallization). The peptide calibration standard (1 pmol/μL peptide mixture) was applied for calibrating the machine.
Mass spectrometry analysis
For proteome analysis, we used a linear Autoflex III MALDI-TOF-MS with the following settings: ion source 1, 20.00 kV; ion source 2, 18.60 kV; lens, 6.60 kV; and pulsed ion extraction, 120 ns. Ionization was achieved by irradiation with a crystal laser operating at 200.0 Hz. For matrix suppression, we used a high gating factor with a signal suppression of up to 600 Da. Mass spectra were detected in linear positive mode. Mass calibration was performed with the calibration mixture of peptides and proteins in the mass range of 600 Da to 20000 Da. We measured three MALDI preparations (MALDI spots) for each MB fraction. For each MALDI spot, 1600 spectra were acquired (200 laser shots at eight different spot positions). These spectra were automatically collected using an Autoflex Analysis software (Bruker Daltonik) for fuzzy controlled adjustment of critical instrument settings to generate raw data of optimized quality.
The criteria for protein mass peak detection (m/z) were as follows: signal-to-noise ratio (S/N) >5, a 2 Da peak width filter, and a maximum peak number of 200. The intensities of the peaks of interest were normalized with the peak intensity of the ACTH internal standard. More than 10% of the molecular weight was sieved in simultaneous samples, with the discrepancy of identical spinnacle in different samples <0.3% after removal of the initial data noise.
Bioinformatics and statistical analysis
ClinProt Tools software 2.2 (Bruker Daltonik) was used for the analysis of all serum sample data derived from either patients or normal controls. Data analysis began with raw data pretreatment, including baseline subtraction of spectrum, normalization of a set of spectrum, internal peak alignment using prominent peaks, and a peak picking procedure. The pretreated data were then used for visualization and statistical analysis in ClinProt Tools. Statistically significant difference in peptide quantity was determined by t-test. Significance was set at p<0.05. A class prediction model was set up by genetic algorithm (GA), and a classification of protein/peptide patterns was constructed. To determine the accuracy of the class prediction, cross-validation was implemented. Twenty percent of the model construction group was randomly selected sample as a test set, and the rest of the samples were taken as a training set in the class predictor algorithm. We also designed a double blind test. The samples of the external validation group were classified by the protein/peptide patterns constructed by GA.
Identification of protein markers
Selected proteins/peptides were further purified using Nano Aquity UPLC C18 beads and serially eluted with 5% and 95% ACN. These proteins/peptides were identified directly using LTQ Orbitrap XL (Michrom Bioresources) analysis to obtain the peptide sequences. The settings of the Nano Ion Source are as follows: spray voltage, 1.8 kV; MS scan time, 60 min; and scanning range, m/z 400 to 2000. Obitrap was used for the first scan (MS), with a resolution of 100000, and LTQ was used for the CID and the second scan (MS/MS). The 10 strongest ion intensities in the MS spectrum were selected as the parent ion for MS/MS (single charge exclusion, not as a parent ion). Peptide mass fingerprinting was performed with the International Protein Index (IPI human v3.45 fasta with 71983 entries) and a search of the National Center for Biotechnology Information (NCBI) protein–protein BLAST database (http://www.ncbi.nlm.nih.gov/BLAST/).
Statistical methods and evaluation of assay precision
We analyzed each spectrum obtained from MALDI-TOF MS with Autoflex Analysis and ClinProt TM software (Bruker Daltonics). The former was used to detect the peak intensities of interest, and the latter was used to compile the peaks across the spectrum obtained from all samples. This method allowed differentiation between the samples of cancer and healthy volunteers. To evaluate the precision of the assay, we determined within- and between-run variations using multiple analyses of bead fractionation and MS for the two plasma samples. For the within- and between-run variations, we examined three peaks with various intensities. We determined within-run imprecision by evaluating the coefficient of variation (CV) for each sample using eight assays within a run and then determined between-run imprecision by performing eight assays for 7 d. SPSS16.0 was used for the analysis of the clinical characteristics of volunteers using χ2 test or t-test. Significance was set at p<0.05.
Results
System stability and experimental reproducibility were ensured using three peaks with different molecular masses of standard serum
For the reproducibility of protein profiling, the within- and between-run reproducibilities of the two samples were determined using WCX-MB fractionation and MALDI-TOF MS analysis. In each profile, three peaks with different molecular masses were selected to evaluate the precision of the assay. Despite varying protein/peptide masses and spectrum intensities, the peak CVs were all <3% in the within-run and <10% in the between-run assays. These values were consistent with the reproducibility data for the Protein Biology System reported by the manufacturer (Bruker Daltonik).
Differentiation of selected proteins/peptides between healthy volunteers and ESCC
The serum protein/peptide profiles of all healthy volunteers and ESCC patients were analyzed using a new high-resolution MALDI-TOF MS coupled with bead fractionation. Samples were randomly distributed during processing and analysis. A total of 83 distinct m/z values were resolved in the 600 Da to 20000 Da range (Fig. 1). Differences in peak positions and intensities were observed and later used to statistically analyze the spectrum. ClinprotTools ver 2.2 (Bruker Daltonic) was used for peak detection. The result of t-test showed that 16 proteins/peptides (including 3 upregulated and 13 downregulated proteins/peptides) displayed statistically significant differences (P<0.05) between healthy volunteers and ESCC patients (Table 2).

Aligned mass spectrum of the serum protein profile of the model construction group obtained by MALDI-TOF after purification with WCX magnetic beads. Red represents 10 esophageal squamous cell carcinoma (ESCC) patients, and blue represents 10 healthy volunteers.
Peptide selected for model construction; bPeak area; cp value calculated with t-test. Statistical significance was considered at p<0.05.
Establishment and validation of predicting model
Classification models were developed to discriminate ESCC patients from healthy volunteers. A GA in ClinProt was trained with the detected peaks from the discovery set to generate cross-validated classification models. Among the differentially expressed proteins/peptides, three (m/z 1867, 2094, and 2700) were selected by the GA to build a possible diagnostic cluster of signals. Regions of the mass spectrum obtained at approximately 800 resolving power are reported in Figure 2. The diagnostic capability of each peak determined by the receiver operator characteristic (ROC) curve is reported in Figure 3. Moreover, the peak areas in the spectrum of the ESCC patients were statistically different from those of the healthy volunteers (Figure 4). A combination of the three peaks was provided as the best predicting model, achieving a recognition capacity of 96.25% (a sensitivity of 95.83% and a specificity of 96.88%), with 20% of randomly selected data points omitted in the cross validation step. The accuracy of the models was verified with the validation set data consisting of the 20% omitted samples. All samples were correctly classified by the GA model, with sensitivity and specificity of 100%.
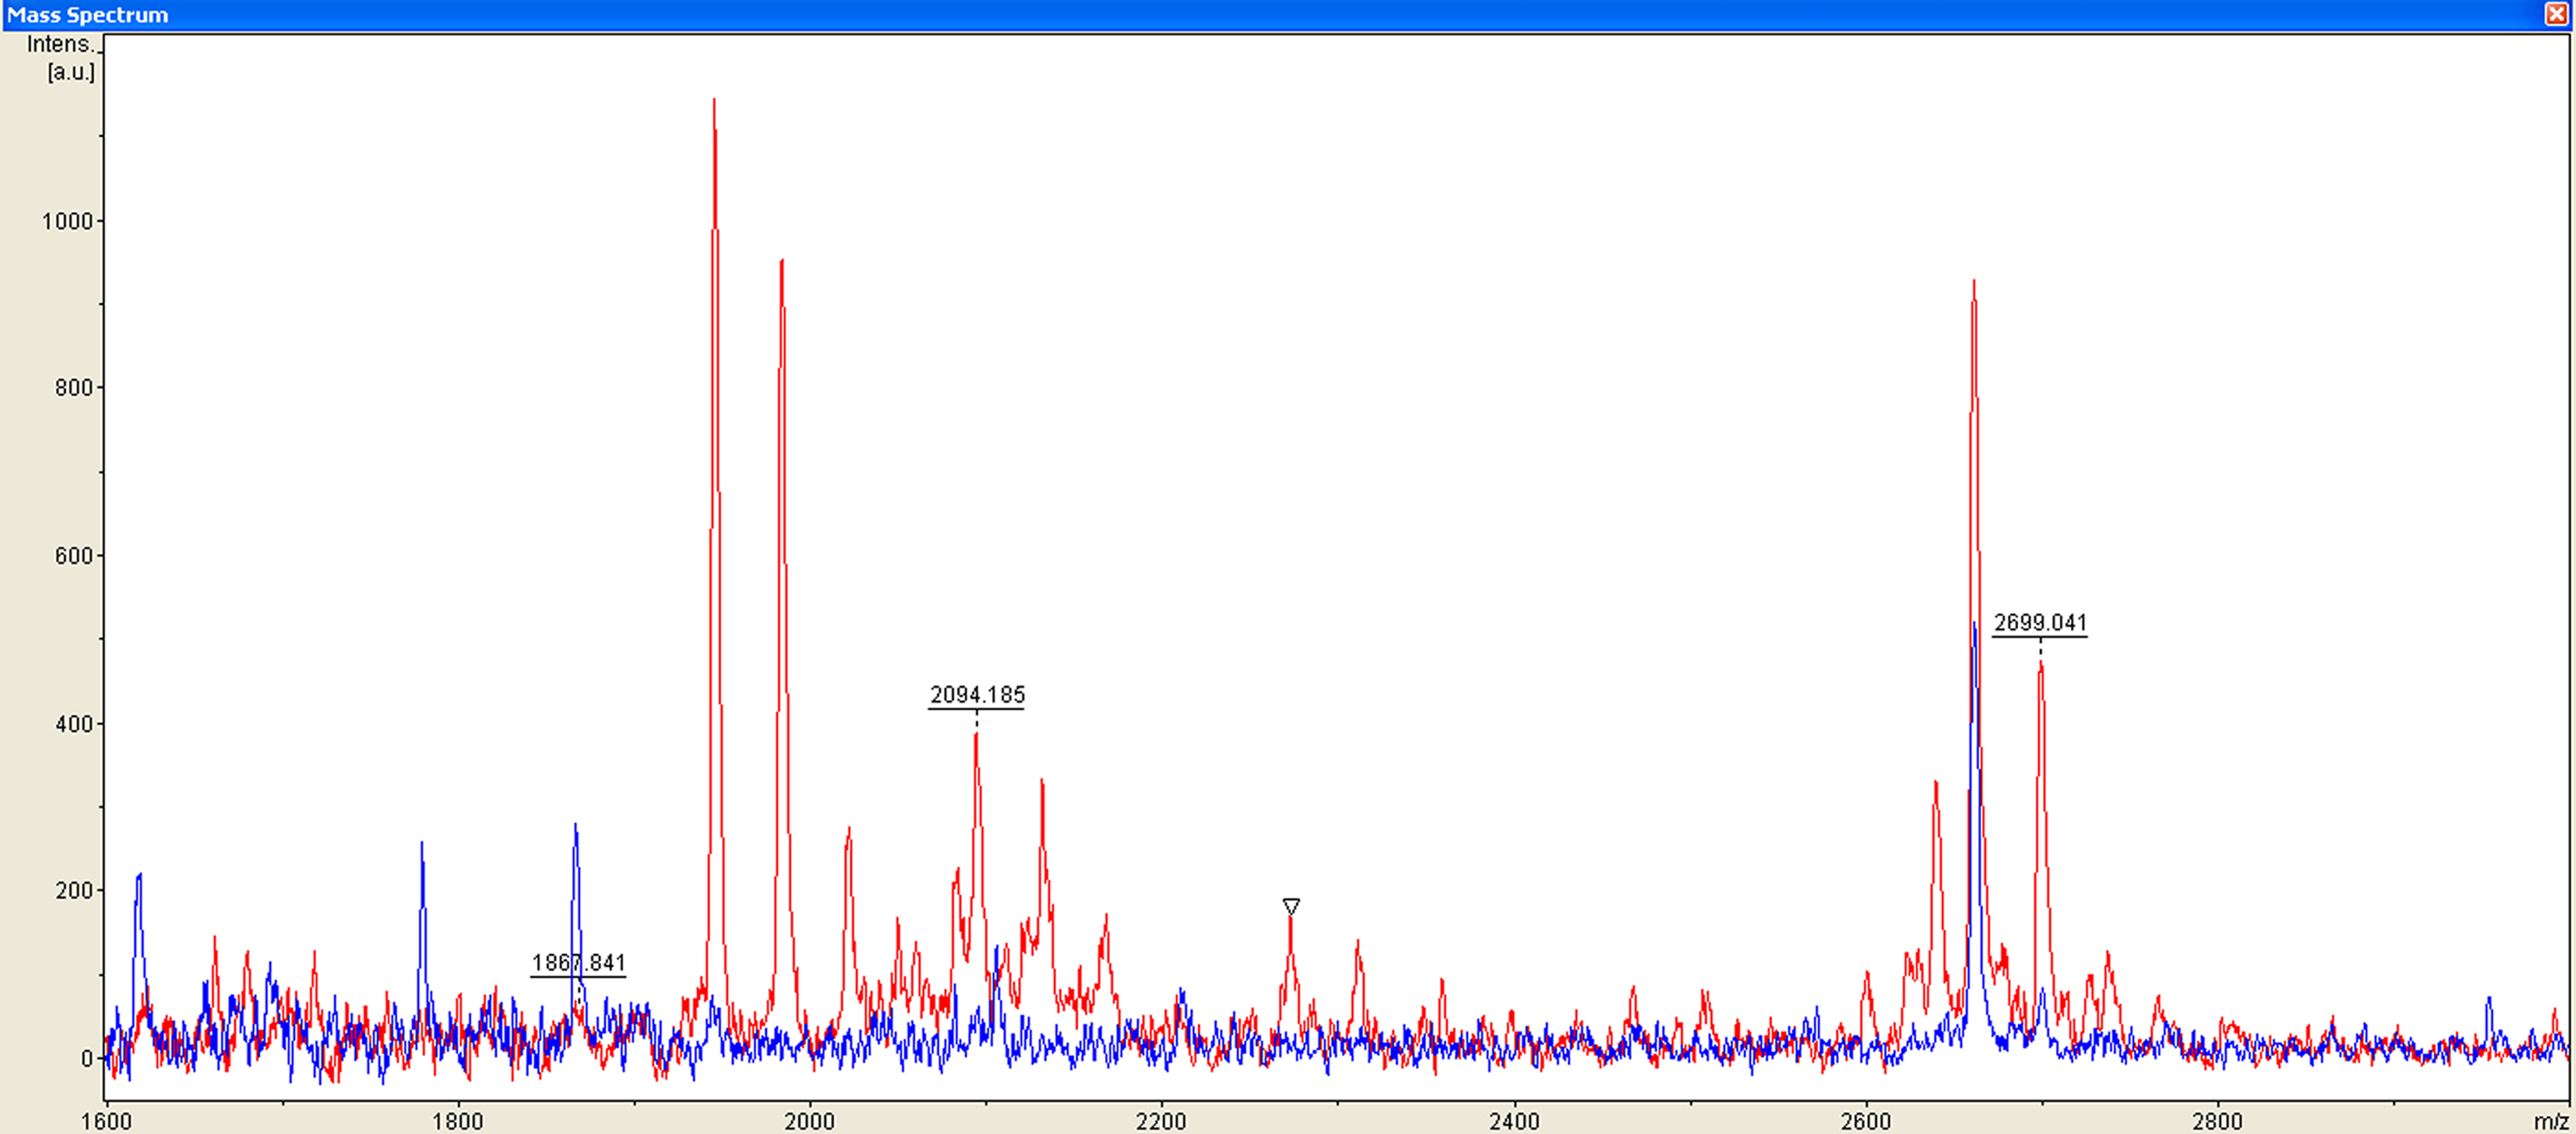
Mass range of the three proteins/peptides (m/z 1867, 2094, and 2700, MALDI-TOF linear mode) used in the cluster to differentiate esophageal squamous cell carcinoma patients (red) from healthy volunteers (blue).

Receiver operating characteristic (ROC) curve of the three proteins (m/z 1867, 2094, and 2700) selected for the diagnostic model of esophageal squamous cell carcinoma. AUC, areas under the ROC curve.
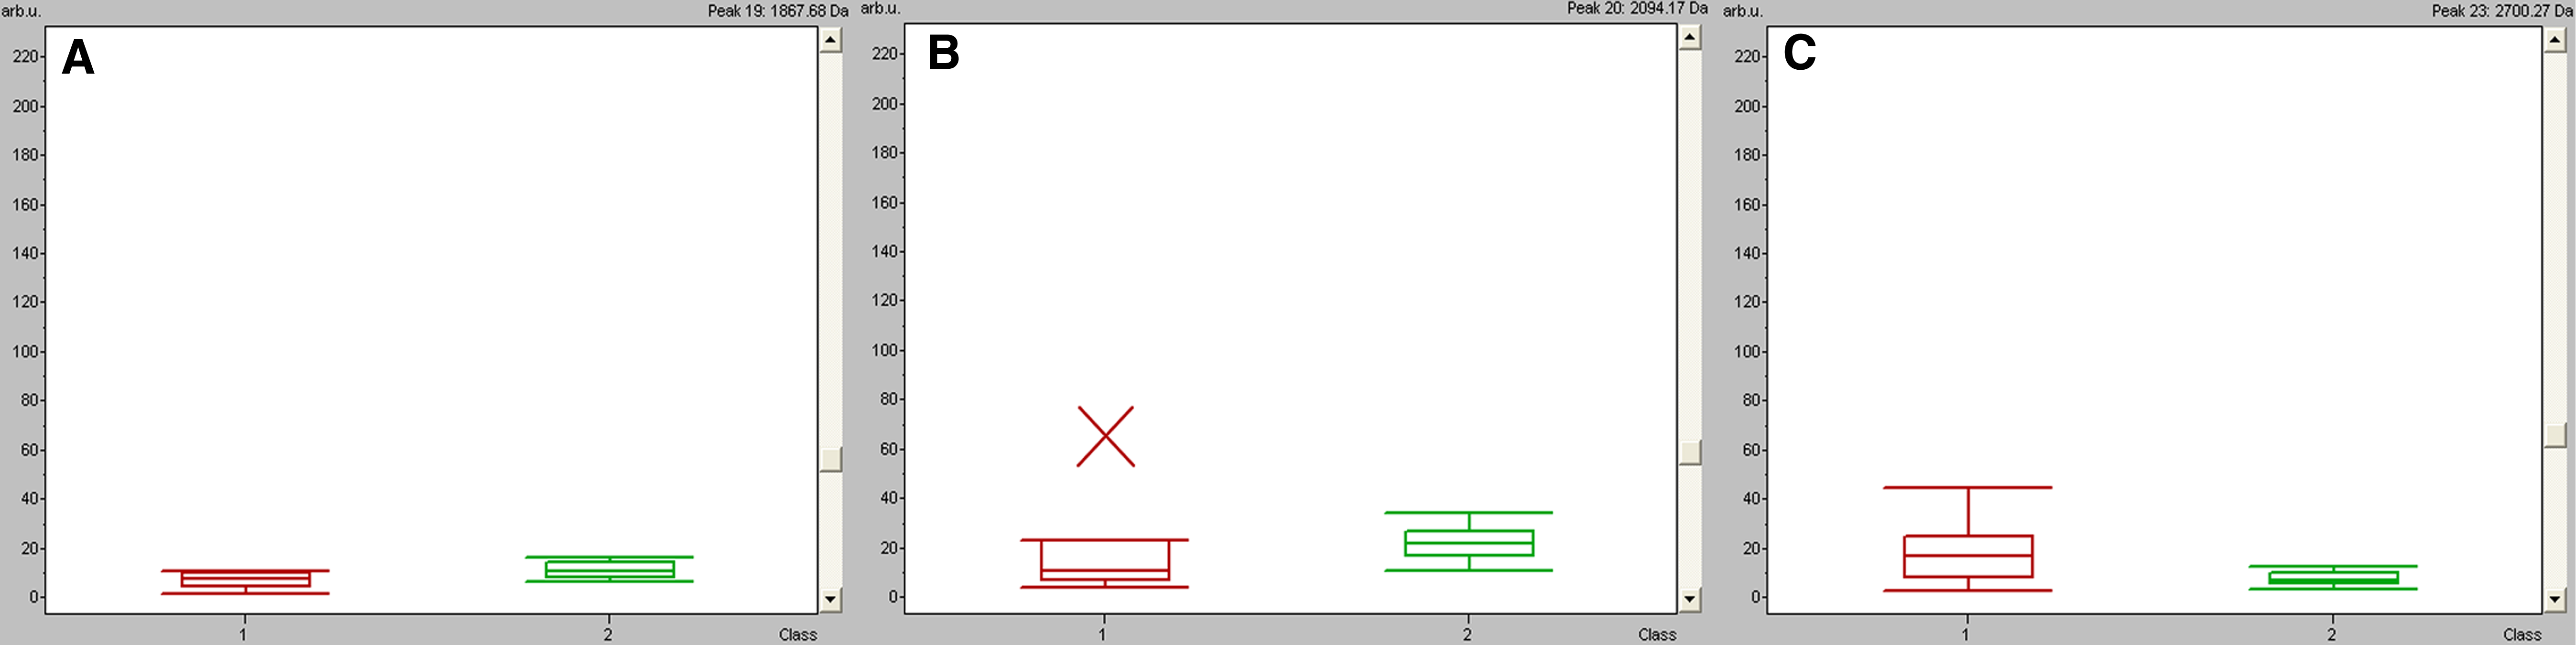
Box-and-whisker plots calculated from the areas of the three proteins/peptides (m/z 1867, 2094, and 2700) selected for the diagnostic model. Red represents esophageal squamous cell carcinoma (ESCC) patients, and green represents healthy volunteers (p<0.01 versus control).
To verify the accuracy of the established GA classification model, we introduced another group of samples (not used in the model construction), which consisted of 59 ESCC patients and 40 healthy volunteers. The model correctly classified 94.92% (56/59) of ESCC patients (sensitivity) and 97.50% (39/40) of healthy volunteers (specificity).
Identification of markers
Three of the potential markers at m/z 1867, 2094, and 2700 Da could distinguish ESCC from healthy volunteers, as analyzed by the bead-based proteomic technology. These markers are beneficial for further purification and identification with relatively high peak intensity. Therefore, these proteins/peptides could be potential markers for further immunoassay trials. After fractionation by Nano Aquity UPLC (Waters Corporation), the eluted plasma samples were further purified by C18 beads with 5 and 3.5 μm and then serially eluted with 5% and 95% ACN. The samples were then subjected to LTQ Orbitrap XL MS/MS (Michrom Bioresources) analysis. The MS fingerprint was subjected to International Protein Index (IPI human v3.45 fasta with 71983 entries) for peptide sequencing and to NCBI database for protein identification. We subsequently identified proteins by ion-spray mass spectrum. Mass spectrum with fragmentation pattern was identified through b and y ions (Fig. 5). Signal at m/z 1867 was identified as tubulin beta chain with the sequence K.MAVTFIGNSTAIQELFK.R (IPI00011654.2, Gene symbol=TUBB, p=4.34×10⁻⁶, Fig. 5A). The peak at m/z 2094 was identified as cytochrome b-c1 complex subunit 1 with the sequence R.MVLAAAGGVEHQQLLDLAQK.H (IPI00013847.4, Gene symbol=UQCRC1, p=1.17×10⁻³) (Fig. 5B). The peak at m/z 2700 was identified as filamin A alpha isoform 1 with the sequence K.SADFVVEAIGDDVGTL GFSVEGPSQAK.I (IPI00302592.2 Gene Symbol=FLNA, p=5.62×10⁻⁴, Fig. 5C).

MS/MS identification of serum peptides tubulin beta chain
Discussion
One of the major aims of putative biomarker detection using proteomic technologies is to develop new diagnostic methods to effectively screen patients at an early stage. The usefulness of multiple markers for diagnosis and prognosis and for predicting the risk of developing diseases or their complications is now widely recognized (Fan et al., 2012a; Issaq et al., 2007; Zethelius et al., 2008).
Proteomic profiling is based on the fact that proteins represent the dynamic state of the cells, reflecting earlier pathological and physiological changes in the disease more accurately than genomic sequencing (Hudler et al., 2010). Proteomic patterns should assist in the detection of tumor biomarkers, as well as in the evaluation of the efficacy of anticancer drugs. Several studies have reported on biomarkers in ESCC patients (Kashyap et al., 2010; Kelly et al., 2010; Pawar et al., 2011; Zhang et al., 2011). The comparison of sera of cancer patients and healthy volunteers provided a diagnostic protein/peptide pattern consisting of 11 peaks. These peaks distinguished ESCC patients from healthy volunteers with 90.00% sensitivity and 88.40% specificity (Liu et al., 2010). Our group previously reported a diagnostic protein/peptide pattern consisting of five peaks, which performed well in differentiating ESCC from healthy volunteers and other digestive tract cancers (Fan et al., 2012c). These protein/peptide fragments with high specificity and sensitivity may be effective serum biomarkers for ESCC. Studies involving a larger population group are necessary to confirm this finding. However, the proteins/peptides in the diagnostic pattern were not identified according to the mass to charge ratio and amino group sequence. Using isobaric tags for relative and absolute quantitation (iTRAQ) regeants, followed by multidimensional liquid chromatography (LC) and tandem MS/MS analysis, another study of our group reported TP-alpha, collagen alpha-1(VI) chain, and S100A9 as immunohistochemistry diagnostic biomarkers of ESCC (Fan et al., 2012).
This study performed a case-control comparative analysis between ESCC patients and healthy volunteers by integrating the purification of serological proteins/peptides with WCX-MB, detection of peak intensity with MALDI-TOF MS, and profile analysis with ClinProt Tool software 2.2. Compared with the healthy volunteers, the ESCC patients shared 16 significantly differentiated proteins/peptides, including 3 upregulated and 13 downregulated proteins/peptides. Using the GA analysis, a cluster of three proteins/peptides at m/z 1867, 2094, and 2700 was developed as a classification mode, achieving recognition capacity and cross-validation close to 100% to discriminate ESCC patients from healthy volunteers. The diagnostic capability of each peak at m/z 1867, 2094, and 2700 determined by the ROC curve shows a medium accurate test (Swets, 1988). Further evaluation by LTQ Obitrap XL identified 1867, 2094, and 2700 Da markers as tubulin beta chain, filamin A alpha isoform 1, and cytochrome b-c1 complex subunit 1, respectively.
Tubulin, the subunit protein of microtubules, has generally been thought to be exclusively a cytoplasmic protein in higher eukaryotes and an important target for anti-tumor drugs (Yeh and Luduena, 2004). Tubulin is structurally an α/β heterodimer (Bryan and Wilson, 1971). Abnormal expression of the specific β-tubulin isotype is related to chemotherapy resistance in solid cancers (Dumontet and Jordan, 2010; Kavallaris, 2010; Perez, 2009). This marker may assume a greater function in therapeutic decision making. Early detection of malignancies of the gastrointestinal tract can lead to improved survival of patients worldwide. Beta-tubulin is a cancer-specific antigen in patients with gastrointestinal malignancies, including EC, colorectal cancer, gastric cancer, and pancreatic cancer. Sensitivities range between 20% and 40% for various cancers with a specificity of 96% (Bouras et al., 2012). We identified that β-tubulin down-regulated in ESCC and showed diagnostic and therapeutic potentials for ESCC.
The results of the present study elucidated clearly the structure of filamin A, the first actin filament cross-linking protein or gelation factor identified in nonmuscle cells. Up to 35 years of filamin A research has identified over 90 binding partners including channels, receptors, intracellular signaling molecules, and even transcription factors (Hartwig and Stossel, 1975; Nakamura et al., 2011). Whether filamin A anomaly contributes to tumorigenesis remains unclear. In prostate cancer, cancer metastasis is correlated with the cytoplasmic localization of filamin A (Bedolla et al., 2009). Filamin A is required for an efficient recombination DNA double-strand break repair, suggesting that filamin A has a function in the maintenance of genomic stability (Yue et al., 2009). Compared with normal tissues, the expression of filamin A increases in lung, pancreatic, colorectal, and breast cancers (Alper et al., 2009; Keshamouni et al., 2006; Uhlen et al., 2005). Despite its involvement in many cellular activities, filamin A is dispensable for cell autonomous survival. Disrupted filamin A function may contribute to the biology of cancers. Filamin A modulates the functionality of growth factor receptors or signal transducing molecules and provides tumor cells with a growth advantage (Li et al., 2010). In the present study, overexpression of filamin A alpha isoform 1 showed a medium diagnostic ability. This study elucidated the diagnosis and pathology of ESCC.
The cytochrome b-c1 complex is a ubiquitous energy transducing enzyme involved in the electron transport chain of prokaryotes, mitochondria, and chloroplasts (b6/f) (Gabellini, 1988) and in energy production. These data provide new insights into the molecular mechanisms of various heart pathologies related to heart ischemia/reperfusion (Lin et al., 2012). Therapeutic mycophenolic acid (MPA) inhibits the proliferation of human embryonic kidney cell line 293 in a dose-dependent manner. A significant apoptosis was observed after MPA treatment, as shown by caspase 3 activity. After incubation with MPA, the expression of seven proteins, including cytochrome b-c1 complex subunit, significantly increased (Qasim et al., 2011). Cytochrome b-c1 complex subunit is one of the proteins most likely involved in mechanisms that allow the corpus luteum to produce progesterone during early pregnancy (Arianmanesh et al., 2011). Advances in understanding the biology of tumor progression and metastasis have clearly highlighted the importance of aberrant tumor metabolism, which supports not only the energy requirements but also the enormous biosynthetic needs of tumor cells (Singh et al., 2012). To the best of our knowledge, this study is the first to reveal the upregulation of the cytochrome b-c1 complex in ESCC. The cytochrome b-c1 complex is a potential diagnostic biomarker of ESCC and is involved in ESCC development.
In addition, this study is one of the few to screen ESCC-related proteins/peptides in sera by combining WCX-MB and MALDI-TOF-MS. The classification model (including tubulin beta chain, filamin A alpha isoform 1, and cytochrome b-c1 complex subunit 1) created in the present study may be used to provide alternatives for ESCC patient diagnosis. The dysregulation of tubulin beta chain, filamin A alpha isoform 1, and cytochrome b-c1 complex subunit 1 provides a better understanding of the pathogenesis of ESCC or aids in tailoring the use of chemotherapy to each patient, leading to improvements in patient outcome. Further research on the underlying pathophysiology of ESCC should be conducted for the development of more effective and better-tolerated therapies. Additional analysis of a larger set of individual samples in combination with more traditional immunoassays (such as ELISA) is required to confirm whether dysregulation of serum tubulin beta chain, filamin A alpha isoform 1, and cytochrome b-c1 complex subunit 1 increases the odds ratios of ESCC in a nested case–control study.
Briefly, these three dysregulated proteins/peptides could be involved in the pathogenesis of ESCC and are potential serological diagnostic biomarkers of ESCC. Moreover, they may contribute to the establishment of a novel diagnostic method and may facilitate personalized medicine for ESCC patients.
Footnotes
Acknowledgments
The authors gratefully acknowledge the assistance of Dr. Yan Li of Fanxing BioTech for her expertise in protein identification.
Disclosure Statement
The authors declare that no conflicts of interest exist related to the publication of this article.