




Abstract
Abstract
Towards unraveling the influenza A (H1N1) immunome, this work aims at constructing the murine host response pathway interactome. To accomplish that, an ensemble of dynamic and time-varying Gene Regulatory Network Inference methodologies was recruited to set a confident interactome based on mouse time series transcriptome data (day 1–day 60). The proposed H1N1 interactome demonstrated significant transformations among activated and suppressed pathways in time. Enhanced interplay was observed at day 1, while the maximal network complexity was reached at day 8 (correlated with viral clearance and iBALT tissue formation) and one interaction was present at day 40. Next, we searched for common interactivity features between the murine-adapted PR8 strain and other influenza A subtypes/strains. For this, two other interactomes, describing the murine host response against H5N1 and H1N1pdm, were constructed, which in turn validated many of the observed interactions (in the period day 1–day 7). The H1N1 interactome revealed the role of cell cycle both in innate and adaptive immunity (day 1–day 14). Also, pathogen sensory pathways (e.g., RIG-I) displayed long-lasting association with cytokine/chemokine signaling (until day 8). Interestingly, the above observations were also supported by the H5N1 and H1N1pdm models. It also elucidated the enhanced coupling of the activated innate pathways with the suppressed PPAR signaling to keep low inflammation until viral clearance (until day 14). Further, it showed that interactions reflecting phagocytosis processes continued long after the viral clearance and the establishment of adaptive immunity (day 8–day 40). Additionally, interactions involving B cell receptor pathway were evident since day 1. These results collectively inform the emerging field of public health omics and future clinical studies aimed at deciphering dynamic host responses to infectious agents.
Introduction
I
Recent high-throughput studies aimed at rationalizing the immune system as a whole and thus the concept of “immunome,” which represents the complete set of reactions of a given host interacting with a foreign antigen, was formed (Sette et al., 2005). Such efforts complemented substantially to those narrowed to single proteins in a single cell type (Braga-Neto and Marques, 2006; De Groot, 2006; McWilliam et al., 2012). In particular, the increasing availability of time series transcriptome data offered a golden opportunity to elucidate the host response mechanisms through the discovery of Gene Regulatory Networks (GRNs). It is well-established that the host response is a highly dynamical process (Handel et al., 2010; Pawelek et al., 2012; Saenz et al., 2010), where the underlying interplay among genes and pathways undergoes significant ‘rewiring’ in time rather than being invariant. Furthermore, recent studies on the emerging Systems Medicine (Auffray et al., 2009) and Systems Immunology fields (Shay and Kang, 2013) have shown that large-scale systems approaches, like GRNs, promise great rewards in terms of our understanding of the immune system, and assist in translating the findings to clinical use in disease diagnosis/prognosis and in the design of drugs and vaccines. Moving a step further, immunomics studies have been proved to be fundamental for the progress of vaccinomics studies, which in turn demand a deep understanding of the global architecture of the immune system for developing efficient vaccines and drugs (Bernstein et al., 2011; Loukas et al., 2011; Poland et al., 2011).
Lately, new techniques have been developed for GRN reverse engineering from time series data with satisfactory accuracy and good scalability. These approaches fall generally into two main categories, namely the model and the machine learning methodologies. The first category includes ordinary differentially equation (ODE)-based models such as network identification by regression (NIR) (Gardner et al., 2003), singular value decomposition and regression analysis (Yeung et al., 2002), time series network identification (TSNI) (Cantone et al., 2009), and Inferelator (Bonneau et al., 2006). Examples of the second category involve approaches like partial correlation (Schäfer and Strimmer, 2005), graphic Gaussian models (Villers et al., 2008), Dynamic Bayesian Networks (Zou and Conzen, 2005), state-space models (Li et al., 2006), Granger causality (Nagarajan and Upreti, 2010), and neural networks (Maraziotis et al., 2010).
In a recent study, based on time series gene expression data obtained from the lungs of C57BL/6J mice infected with a mouse-adapted influenza A (H1N1) virus, we described for the first time the entire host response kinetics to an acute influenza A infection (Pommerenke et al., 2012). In previous work (Dimitrakopoulou et al., 2011), preliminary results were presented regarding the interactome transformations during innate response (until day 4 post infection) with the use of a single GRN model. Extending this effort, the current work aims at setting the first systemic view of the pathway interplay in time after the H1N1 viral invasion. We explore the rewiring of pathway relations throughout response, from innate response to humoral and late repair phases, by combining dense time-sampled microarray data (until day 60 post infection) along with the modeling power of an ensemble of dynamic and time-varying GRN Inference methodologies. In addition, we provide evidence that there are common host response features between the mechanisms triggered by the murine-adapted PR8 strain and the mechanisms triggered by other influenza A subtypes/strains.
Among the plethora of algorithms proposed recently in the literature to solve the network inference problem, we selected one algorithm from each class of mathematical formalism: (a) an information theoretic model (Zoppoli et al., 2010), (b) a neurofuzzy recurrent network model (Maraziotis et al., 2010), (c) a differential equation-based model (Aijö and Lähdesmäki, 2009), (d) a kernel-reweighted logistic regression model (Song et al., 2009a), and (e) a time-varying dynamic Bayesian model (Song et al., 2009b). The latter two algorithms set the framework for monitoring the temporal evolution of the descended interactions by decomposing the static topology into a sequel of network snapshots.
Challenged by the need to define the network view of the high-order organization of the transcriptome (such as the interactions between pathways), we constructed networks of cluster centroids rather than of genes (Guthke et al., 2005; Inoue et al., 2007). Clusters (or modules) of co-expressed genes are associated with the pathway concept as entities with significant functional association (van Noort et al., 2003; Wei et al., 2006). The centroids descending from a clustering technique are considered as eigengenes that represent modules of co-expressed genes. Thus, eigengene network analysis serves as a network reduction scheme that moves analysis from the level of thousands of genes to a lower order meta-network involving module representatives (one eigengene per module) and simultaneously enables the visualization of pathway interactivity (Deng et al., 2012; Horvath and Dong, 2008; Langfelder et al., 2007).
In summary, the present immunomics analysis is the first attempt towards deciphering the time-varying features of the entire host response after an acute Influenza A infection and sets the basis for a detailed description of the pathway interactome based solely on transcriptome data. The findings of our study pose new challenges in the design of dynamic experiments; there is urgent need for a more in-depth surveillance of dynamic cellular processes, since increased sampling rate will substantially improve the predictive power of GRN Inference methodologies.
Materials and Methods
Gene expression data
The time-varying influenza A (H1N1) host response pathway interactome was designed based on the time series microarray dataset of Pommerenke et al. (2012). In detail, C57BL/6J mice were infected with a mouse-adapted influenza A virus PR8 (A/Puerto Rico/8/34 (H1N1)). RNA was prepared from whole lungs and processed for hybridization on Agilent 4x44k arrays. Three replicates, from three individually infected mice, were taken for each time point after infection (1, 2, 3, 5, 8, 10, 14, 18, 22, 26, 30, 40, and 60 days) and nine replicates from three mock-infected mice (day 0). The complete dataset is accessible through ArrayExpress database under the accession number E-MTAB-764. Preprocessing steps of the raw data comprised background correction, quantile normalization, probe summarization, and log2 transformation using the R environment and additional packages from Bioconductor (Gentleman et al., 2004). In order to deal with the variance across replicates, median values were calculated for each gene of 3–9 replicates. Subsequently, we identified the differentially expressed genes (DEGs) after running the EDGE software package (Leek et al., 2006), which is based on the Optimal Discovery Procedure (ODP) for estimating the optimal rule. We ended up with 3,480 unique DEGs after setting p-value<0.05 (Supplementary Text S1, Supplementary Figs. S1 and S2; supplementary material is available online at www.liebertpub.com).
Two other microarray datasets were employed for comparison and validation of the model predicted by the aforementioned dataset. The first dataset is deposited in the GEO database with accession number GSE33263. In detail, C57BL/6 mice were infected with influenza A/Vietnam/1203/2004 (VN1203) by intranasal instillation of 103, 104, or 105 PFU. At days 1, 2, 4, and 7 days post-infection, lungs were harvested and total RNA was isolated and subjected to microarray analysis. The experiment included 4–5 mice/time point/dose and three time-matched mocks. Also, there were only three samples at day 7 at 103 PFU and no day 7 samples at 104 PFU. A detailed description is provided in (McDermott et al., 2011). The second dataset is deposited in the GEO database with accession number GSE31022. In detail, C57BL6/J mice were infected with A/Mexico/4108/2009 (H1N1pdm) and profiling was applied on total RNA obtained from lung tissue at days 1, 2, 3, 4, 5, and 6 post infection. The experiment included three replicates per time point and three mock samples (day 0). A detailed description is provided by Paquette et al., (2012). Both datasets were further processed similar to the first dataset. However, in order to allow comparison with the first dataset, we isolated the expression profiles of the genes matched to the 3,480 DEG set; in total, 3,430 and 3,299 genes were present in the GSE33263 and GSE31022 datasets, respectively.
Gene clustering
Dealing with the limitations posed by the nature of our data, on one hand the small number of available time points, and on the other hand the irregular time sampling, we chose to cluster the temporal profiles by implementing the Fuzzy Short Time-Series (FSTS) clustering algorithm (Möller-Levet et al., 2005). In particular, the FSTS algorithm clusters temporal profiles based on STS distance, which in turn considers the relative change of expression and the corresponding temporal information (Liao, 2005). An important attribute of this algorithm is that it allows genes to belong to more than one cluster, contributing so to the widely accepted idea that genes have a broad functionality repertoire. The three user-defined parameters of FSTS algorithm are the number of clusters nc, the threshold of membership to form the final crisp clusters α, and the fuzziness parameter w. We set w=1.4, and with regard to parameter α, we threshold the number of clusters a gene could participate to three, so as to make feasible the interpretation of the forthcoming network structures. Furthermore, the optimal number of clusters was appointed both by means of the Dunn and Davies-Bouldin indices, as well as by Gene Ontology (GO) enrichment analysis. In detail, for the first dataset (E-MTAB-764), we applied the FSTS algorithm in the range of 2–200 clusters and calculated the respective index scores. The Dunn index score was maximal in the range of 27–33 clusters, while the Davies-Bouldin index score was minimal in the range of 28–35. However, the final cluster number was defined after examining the optimal cluster number range (appointed by the intersecting range of both indices) based on GO enrichment analysis. Our goal was to search for the optimal cluster number that provides the most biologically coherent clusters. In detail, we analyzed our clusters, with the use of DAVID functional annotation tool (Huang et al., 2009), for enriched GO terms, the percentage of genes related to that term and the corresponding EASE score (a modified Fisher Exact p value), and concluded that 29 clusters was the optimal number (Supplementary Fig. S3). In Supplementary Tables S1 and S2, we report the gene members of each cluster, as well as their over-represented GO and KEGG pathway terms (Fisher exact p value<0.05).
The same clustering process was applied in the other two microarray datasets (GSE33263 and GSE31022) and the optimal number was set to 23 and 25 clusters respectively (Supplementary Figs. S4 and SF5). In Supplementary Tables S3, S4, S5 and S6, we report the gene members of each cluster, as well as their over-represented GO and KEGG pathway terms (Fisher exact p value<0.05).
In each dataset separately, the centroid expression profiles were used as input to all network inference methods. However, the small number and the non-uniform separation of the time samples of E-MTAB-764 dataset imposed the need to approximate extra data points. To address this problem, piecewise cubic Hermite spline interpolation was applied, which fits a polynomial of third degree between every two consecutive time points. We selected this interpolation method because Hermite curves do not oscillate when the underlying function is not smooth and they can fit the data without under/over shooting between the basis points.
TimeDelay-ARACNE
TimeDelay-ARACNE (TD-ARACNE) is a gene network reconstruction algorithm based on information theory (Zoppoli et al., 2010). It is an extension of the ARACNE algorithm adapted to time course expression profiles. Its basic concept is to extract the dependencies between two genes at different time delays based on mutual information. The time-delayed dependencies among the expression profiles are identified after setting a stationary Markov Random Field as the underlying probabilistic model. In the final pruning stage, the weakest dependencies, in terms of information, are removed based on an auto-calculated threshold. The software package from Bioconductor (Gentleman et al., 2004) was downloaded and the algorithm was run with default parameters.
Evolutionary Neuro-Fuzzy Recurrent Network
The Evolutionary Neuro-Fuzzy Recurrent Network (ENFRN) belongs to the family of Recurrent Fuzzy Neural Networks (RFNNs) that deal with temporal and spatial/temporal problems via self-loops and backward connections in order to memorize past information (Maraziotis et al., 2010). The self-organized nature of ENFRN offers an adaptive number of temporal fuzzy rules, in the form of ‘IF gene x is highly expressed at time t, THEN its dependent/target gene y will be lowly expressed at time t+1’, that depict the relationships between ‘regulators’ and ‘regulatees.’ Furthermore, the embedded Particle Swarm Optimization (PSO) framework captures the nonlinear dynamics of gene regulatory networks.
The Matlab toolbox was downloaded (http://bioserver-1.bioacademy.gr/DataRepository/Project_ENFRN_GRN/) and the algorithm was run with default parameters; we denote that the maximum number of regulators was decreased to 2 (default parameter is 3) to keep low the model complexity. For the training phase of ENFRN, we used two expression datasets to prevent overfitting. Initially, we trained ENFRN with the whole gene expression dataset. Second, we created a similar ‘noisy’ dataset by adding Gaussian noise to the original data, with a mean of zero and a standard deviation proportional to the average fluctuation in the expression levels of the corresponding gene. Further, the test dataset included the centroid expression profiles. The derived network provided information about the exact nature of the regulation (activation or repression), an attribute not taken into consideration for comparison reasons with the rest network inference methods. Finally, we retained the interactions with composite score lower than 0.6.
AIJO
The AIJO (named after the first author name for simplicity reasons) gene network reconstruction methodology combines Bayesian analysis with ordinary differential equations (ODEs) and nonparametric Gaussian process modeling for defining the regulatory interactions (Aijö and Lähdesmäki, 2009). Its difference relative to classic ODE-based models is the use of nonparametric modeling that allows the inference of the type of regulation from the data without making any drastic assumptions beforehand; also, the Bayesian framework deals successfully with the considerable amount of uncertainty embedded in the data.
The available Matlab toolbox (http://www.cs.tut.fi/∼aijo2/gp/) was downloaded and the algorithm was run with default parameters. The final network topology contained only the regulatory interactions that had likelihood larger than the threshold proposed by the authors (p>0.05).
Kernel-reweighted logistic regression model
The Kernel-reweighted logistic regression model (KELLER) is a time-varying reverse engineering method that captures the undirected dynamic interactions between genes based on their temporal expression profiles (Song et al., 2009a). Initially, the neighborhood of each gene is separately estimated, and then the neighborhoods are joined to build the overall network structure. In other words, the network inference problem is reduced to a set of identical atomic optimizations. KELLER employs the l1-regularized logistic regression algorithm and models the distribution of interactions between genes as a binary pair-wise Markov Random Field. It displays the network topology ‘rewiring’ taking place in the underlying biological process, with temporal resolution up to every single time point based on the measurements of gene expressions.
The Matlab toolbox (http://www.sailing.cs.cmu.edu/keller) was downloaded and the algorithm was run after selecting the optimal solution by maximizing the Bayesian Information Criterion (BIC) via a grid search for the optimal value of lambda (as proposed by the authors). The approach considers the qualitative level of gene expression as important rather than its actual value. Therefore, it models the gene expression as either being up- or downregulated. For this reason, we binarized the gene expression levels of the centroids into X :={−1,1} (−1 for downregulated and 1 for upregulated).
Time Varying Dynamic Bayesian Network
The Time Varying Dynamic Bayesian Network (TV-DBN) method, as proposed by Song et al., (2009b), is an extension of Dynamic Bayesian Networks for modeling the directed time-evolving network structures of nonstationary biological processes. The successive networks are defined based on a kernel reweighted l1-regularized auto-regressive approach. As in KELLER, the network inference problem is reduced to a set of identical atomic optimizations, where on first level the neighborhood of each gene is separately estimated and then the neighborhoods are joined to build the overall network structure. The network estimation procedure is structurally consistent; as the time series data get denser, the higher the probability to capture the realistic network topologies.
The l1-regularization term λ affects the sparsity of the resulting networks and controls the tradeoff between the data fitting and the model complexity. Based on BIC score value, λ was set equal to 0.3 and h equal to 0.1, so that the weighting of observations was 2 days away from each time point. We implemented the algorithm in Python using the NumPy and Scipy libraries.
Results
Our immunomics study offers the first view of the time-varying influenza A (H1N1) host response pathway interactome based on time series transcriptome data of wild-type C57BL/6J mice infected with the mouse-adapted influenza A virus PR8 (H1N1). On first level, we refine our previous kinetic model (Pommerenke et al., 2012) after applying a more suitable clustering procedure tailored for unevenly time-sampled expression data. On the second level, a multi-level dynamic and time-varying network analysis, based on the derived clustering result, serves as the basis for shifting from the host response kinetic model to the time-varying host response pathway interactome; the first focuses on each pathway individually and highlights its expression fluctuations in time, while the latter defines the pathway dependencies in time. Finally, we provide evidence that the interactome defined for the mouse-adapted influenza A PR8 strain and those defined for other influenza A subtypes/strains (H5N1 and H1N1pdm) share many attributes during the early phase of response (day 1–day 7 p.i.).
Clustering
We performed global transcriptome analysis based on time series gene expression data of wild-type C57BL/6J mice infected with the mouse-adapted influenza A virus PR8 (H1N1) across one control (day 0: mock-infected) and 13 unevenly sampled time points post infection (1–60 days). In order to determine clusters of genes with similar expression trends, we applied the Fuzzy Short Time-Series (FSTS) algorithm (Möller-Levet et al., 2005) at 3480 differentially expressed genes (DEGs) and identified 29 clusters. A detailed analysis of DEGs with respect to Gene Ontology terms (Supplementary Figs. 1 and 2) was realized with the use of Cytoscape (Shannon et al., 2003) ClueGO plug-in (Bindea et al., 2009). The analysis showed that our DEG list is highly enriched in genes involved in immune process as well as other processes related to host response, enabling us rightfully to explore the response-related mechanisms. All derived 29 clusters were similarly evaluated using the DAVID tool (Huang et al., 2009), to identify over-represented GO and KEGG pathway terms (Fisher exact p value<0.05). We found 13 clusters related to immune response terms, while the remainders are mainly involved in system development, cell cycle, cell differentiation, cell communication, transport, and lipid metabolic process (Supplementary Table 2).
Figure 1 displays the dendrogram of the 29 cluster centroid expression profiles with respect to the log2 fold change in expression levels at each day compared to the control (day 0). The dendrogram (only across rows) was created with the respective clustergram Matlab function with STS distance as measure (details about STS distance in Materials and Methods section). Twelve clusters revealed a gradual increase in the fold change difference with a clear peak between 80-22 day p.i., followed by a gradual decrease until day 60 p.i., while five clusters displayed upregulation after day 10 p.i. and remained so until day 60 p.i. Also, thirteen clusters exhibited decline in the fold change starting from day 5 and remained so until day 60 p.i.

Cluster dendrogram illustrating the distance of cluster centroid profiles in the tree based on STS distance (see Material and Methods Section for the interpretation of STS distance). The colors according to the key display the log2 up- or down-fold change difference of the centroid expression profiles relative to day 0 (mock). Each line in the dendrogram corresponds to a cluster centroid (the number in the bracket indicates the size of the cluster).
Clusters (or modules) of co-expressed genes are good candidates for exploring the pathway interactivity. Therefore, the centroids, playing the role of eigengenes (or supernodes), alleviate the visualization of the high order view of the interactome (i.e., the pathway interactions). In Figure 2, we provide an overview of a network reduction scheme. Studies such as Guthke et al., (2005) and Langfelder and Horvath (2007) defined networks where the nodes represented modules from co-expression networks or clusters of co-expressed genes instead of genes.
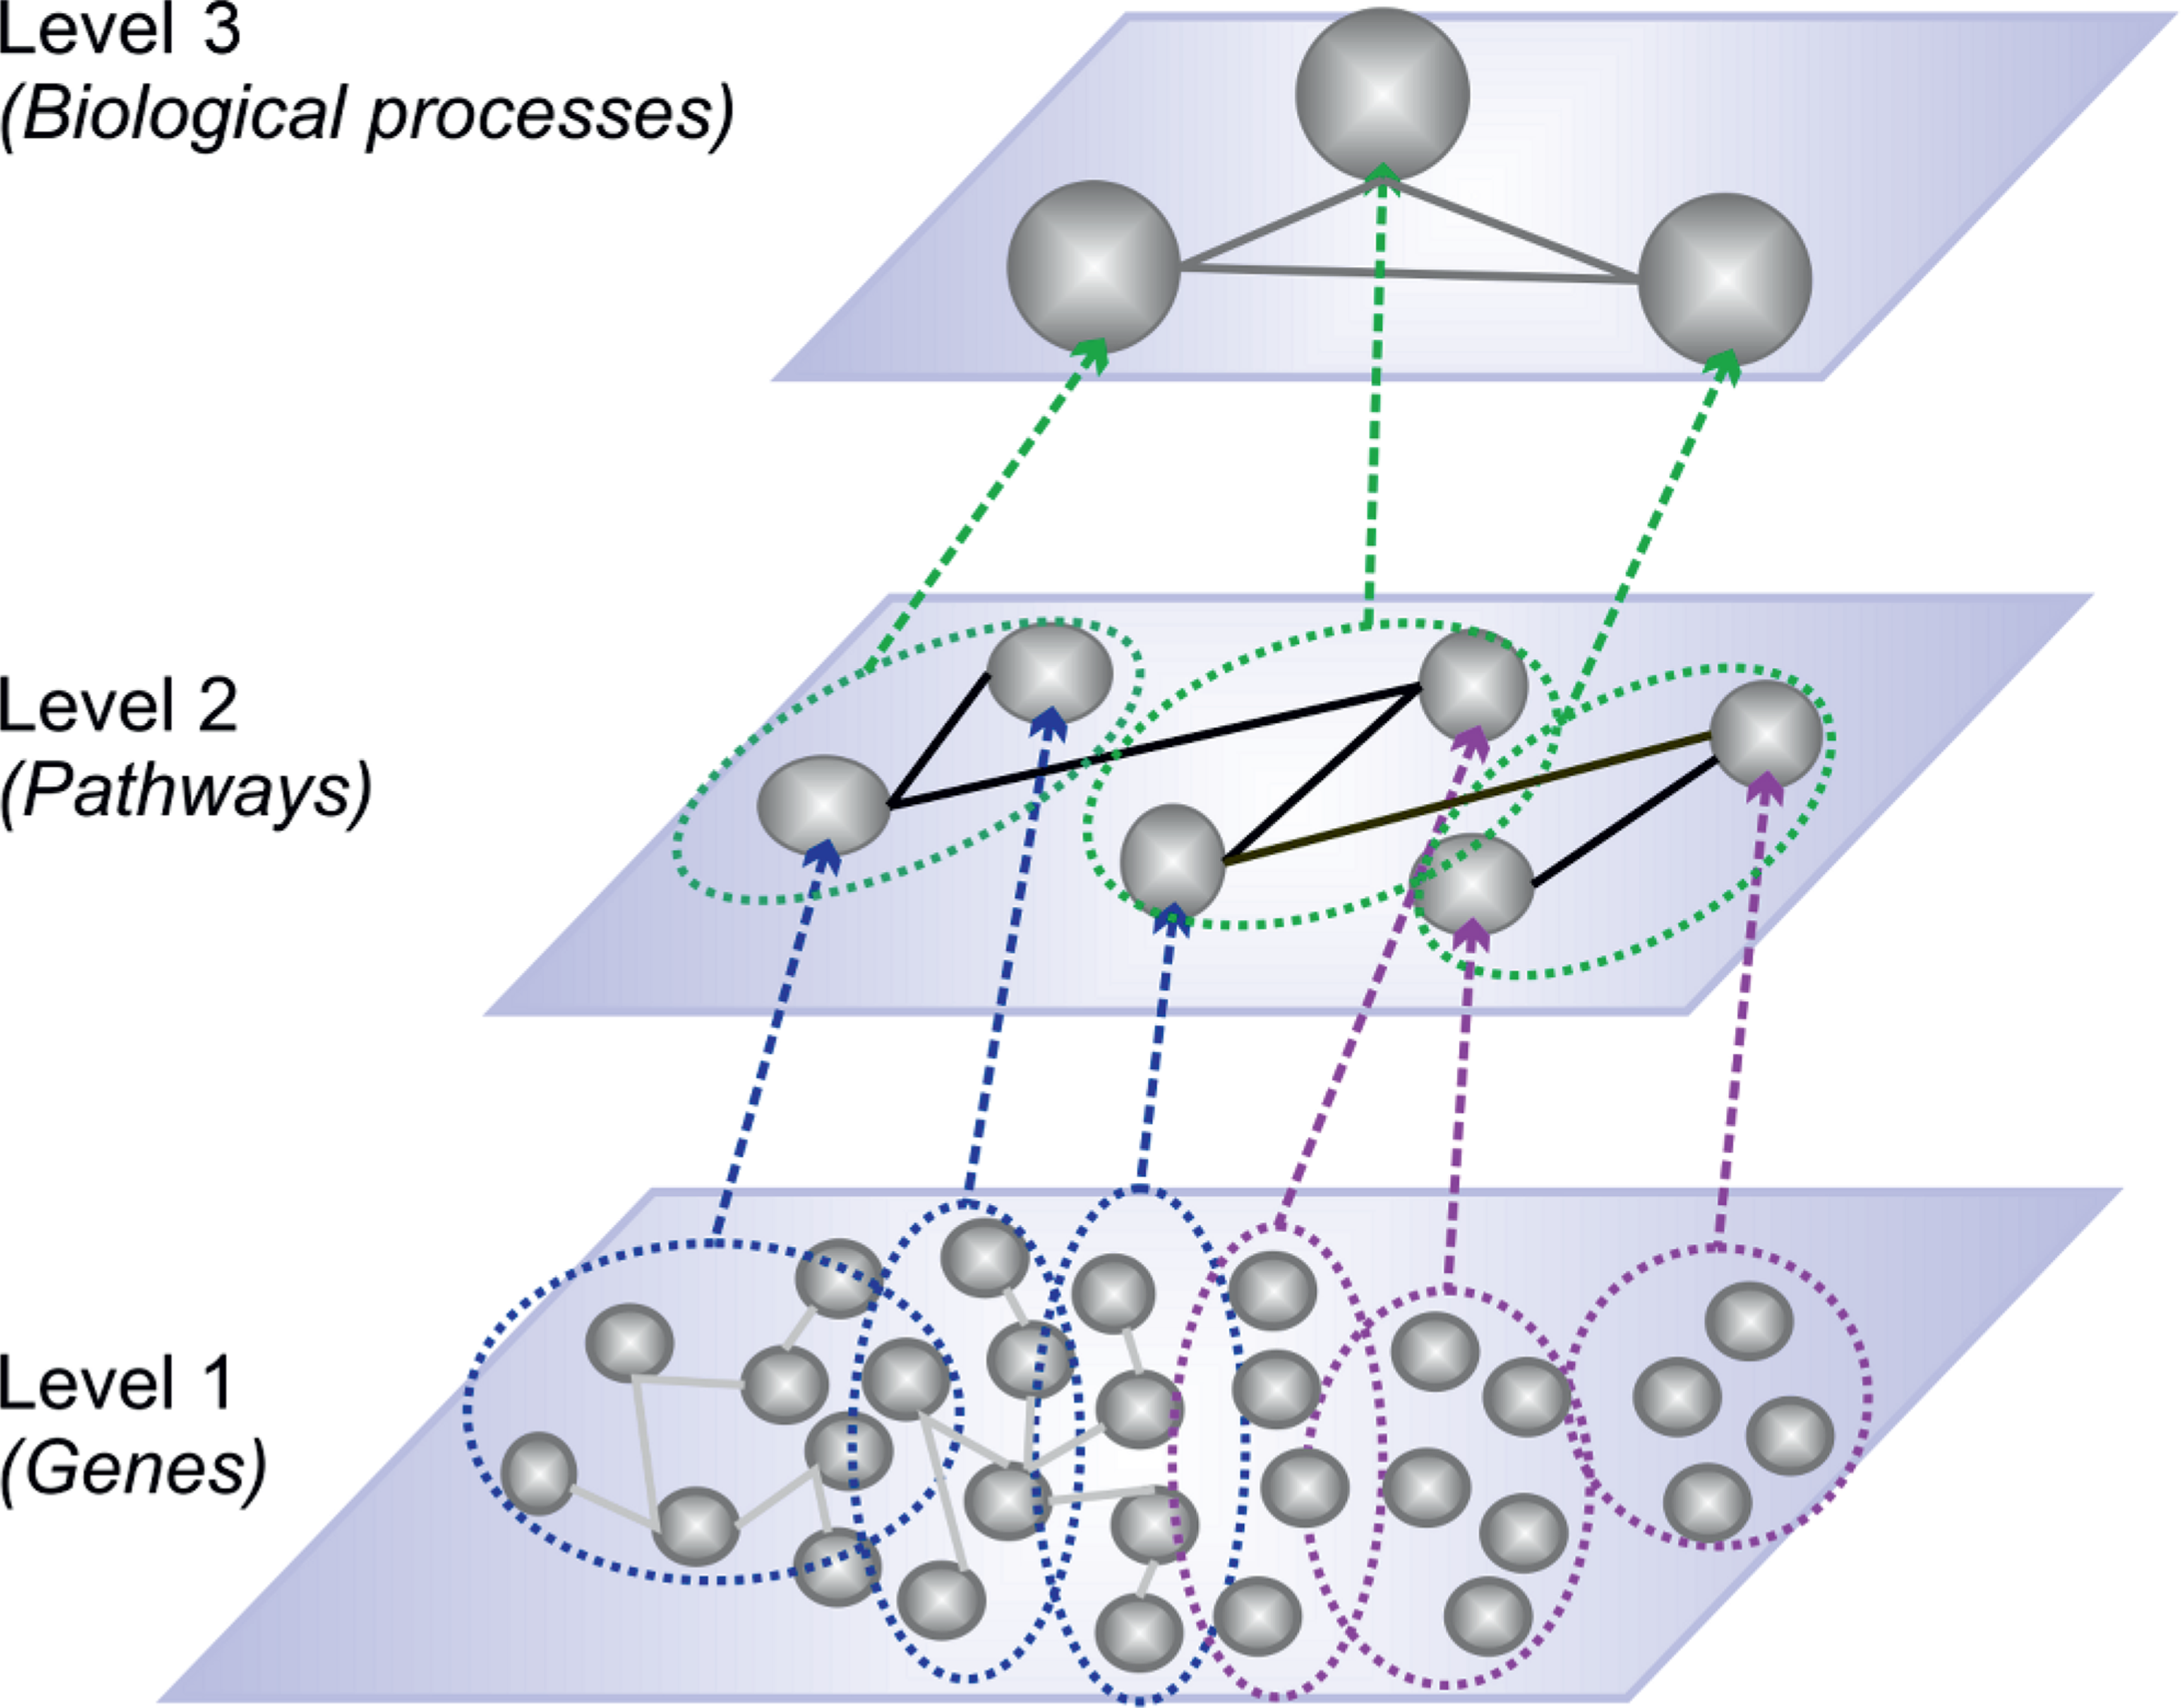
Network reduction scheme. Level 1 can represent two cases: gene co-expression networks (Horvath and Dong, 2008) (nodes connected with gray edges in blue dotted circles) and clusters of co-expressed genes (Guthke et al., 2005) (nodes included in purple dotted circles). Level 2 depicts a pathway meta-network with interactions between meta-nodes (eigengenes or supernodes or cluster representatives). The blue and purple slashed arrows show which group of genes each meta-node represents. Level 3 consists of higher order meta-nodes that represent modules of pathways (green dotted circles) and shows the interactivity among complex biological processes (gray edges). Similarly, the green slashed arrows show which meta-node represents each module of pathways. Our network analysis lies on level 2.
Overlapping network
On the next level, we performed multi-level dynamic network analysis based on the centroid expression profiles of the clusters with the scope to determine cluster–cluster interactions via their corresponding centroids. The network analysis involved the implementation of five distinct GRN Inference methodologies (ENFRN, TD-ARACNE, AIJO, TV-DBN, and KELLER), each one from a different class of mathematical formalism.
In order to build a reliable pathway interactome, one should deal with the idea that each GRN reconstruction methodology produces different network results (Altay and Emmert-Streib, 2010). In this work, we intersected the networks inferred by all algorithms (the concept is known as ‘wisdom of the crowd’) and retained the overlapping interactions (Bansal et al., 2007; Marbach et al., 2012) rather than compare all algorithms in terms of performance and select the network of the superior for subsequent analysis. In Figure 3, we provide a Venn diagram summarizing the common interactions for each combination of the five GRN methods. The idea behind this choice is that we expect unanimously voted interactions to be more reliable and realistic (Bansal et al., 2007). In our case, the cluster-based nature of the network inference problem, in which centroid profiles are in fact smooth curves representing groups of genes with much more abrupt curves, imposed the need to apply stringent criteria and to retain the fully overlapped interactions. However, one could argue that selecting the overlapping network instead of the superior does not reassure the highest values in terms of precision and recall. The analysis on synthetic, as well as on our experimental data, proved that the overlapping network acquires better F-score values (the geometric mean of precision and recall) compared to the networks descending from each algorithm individually (see Supplementary Text S2, Supplementary Fig. S6, S7, and S8).
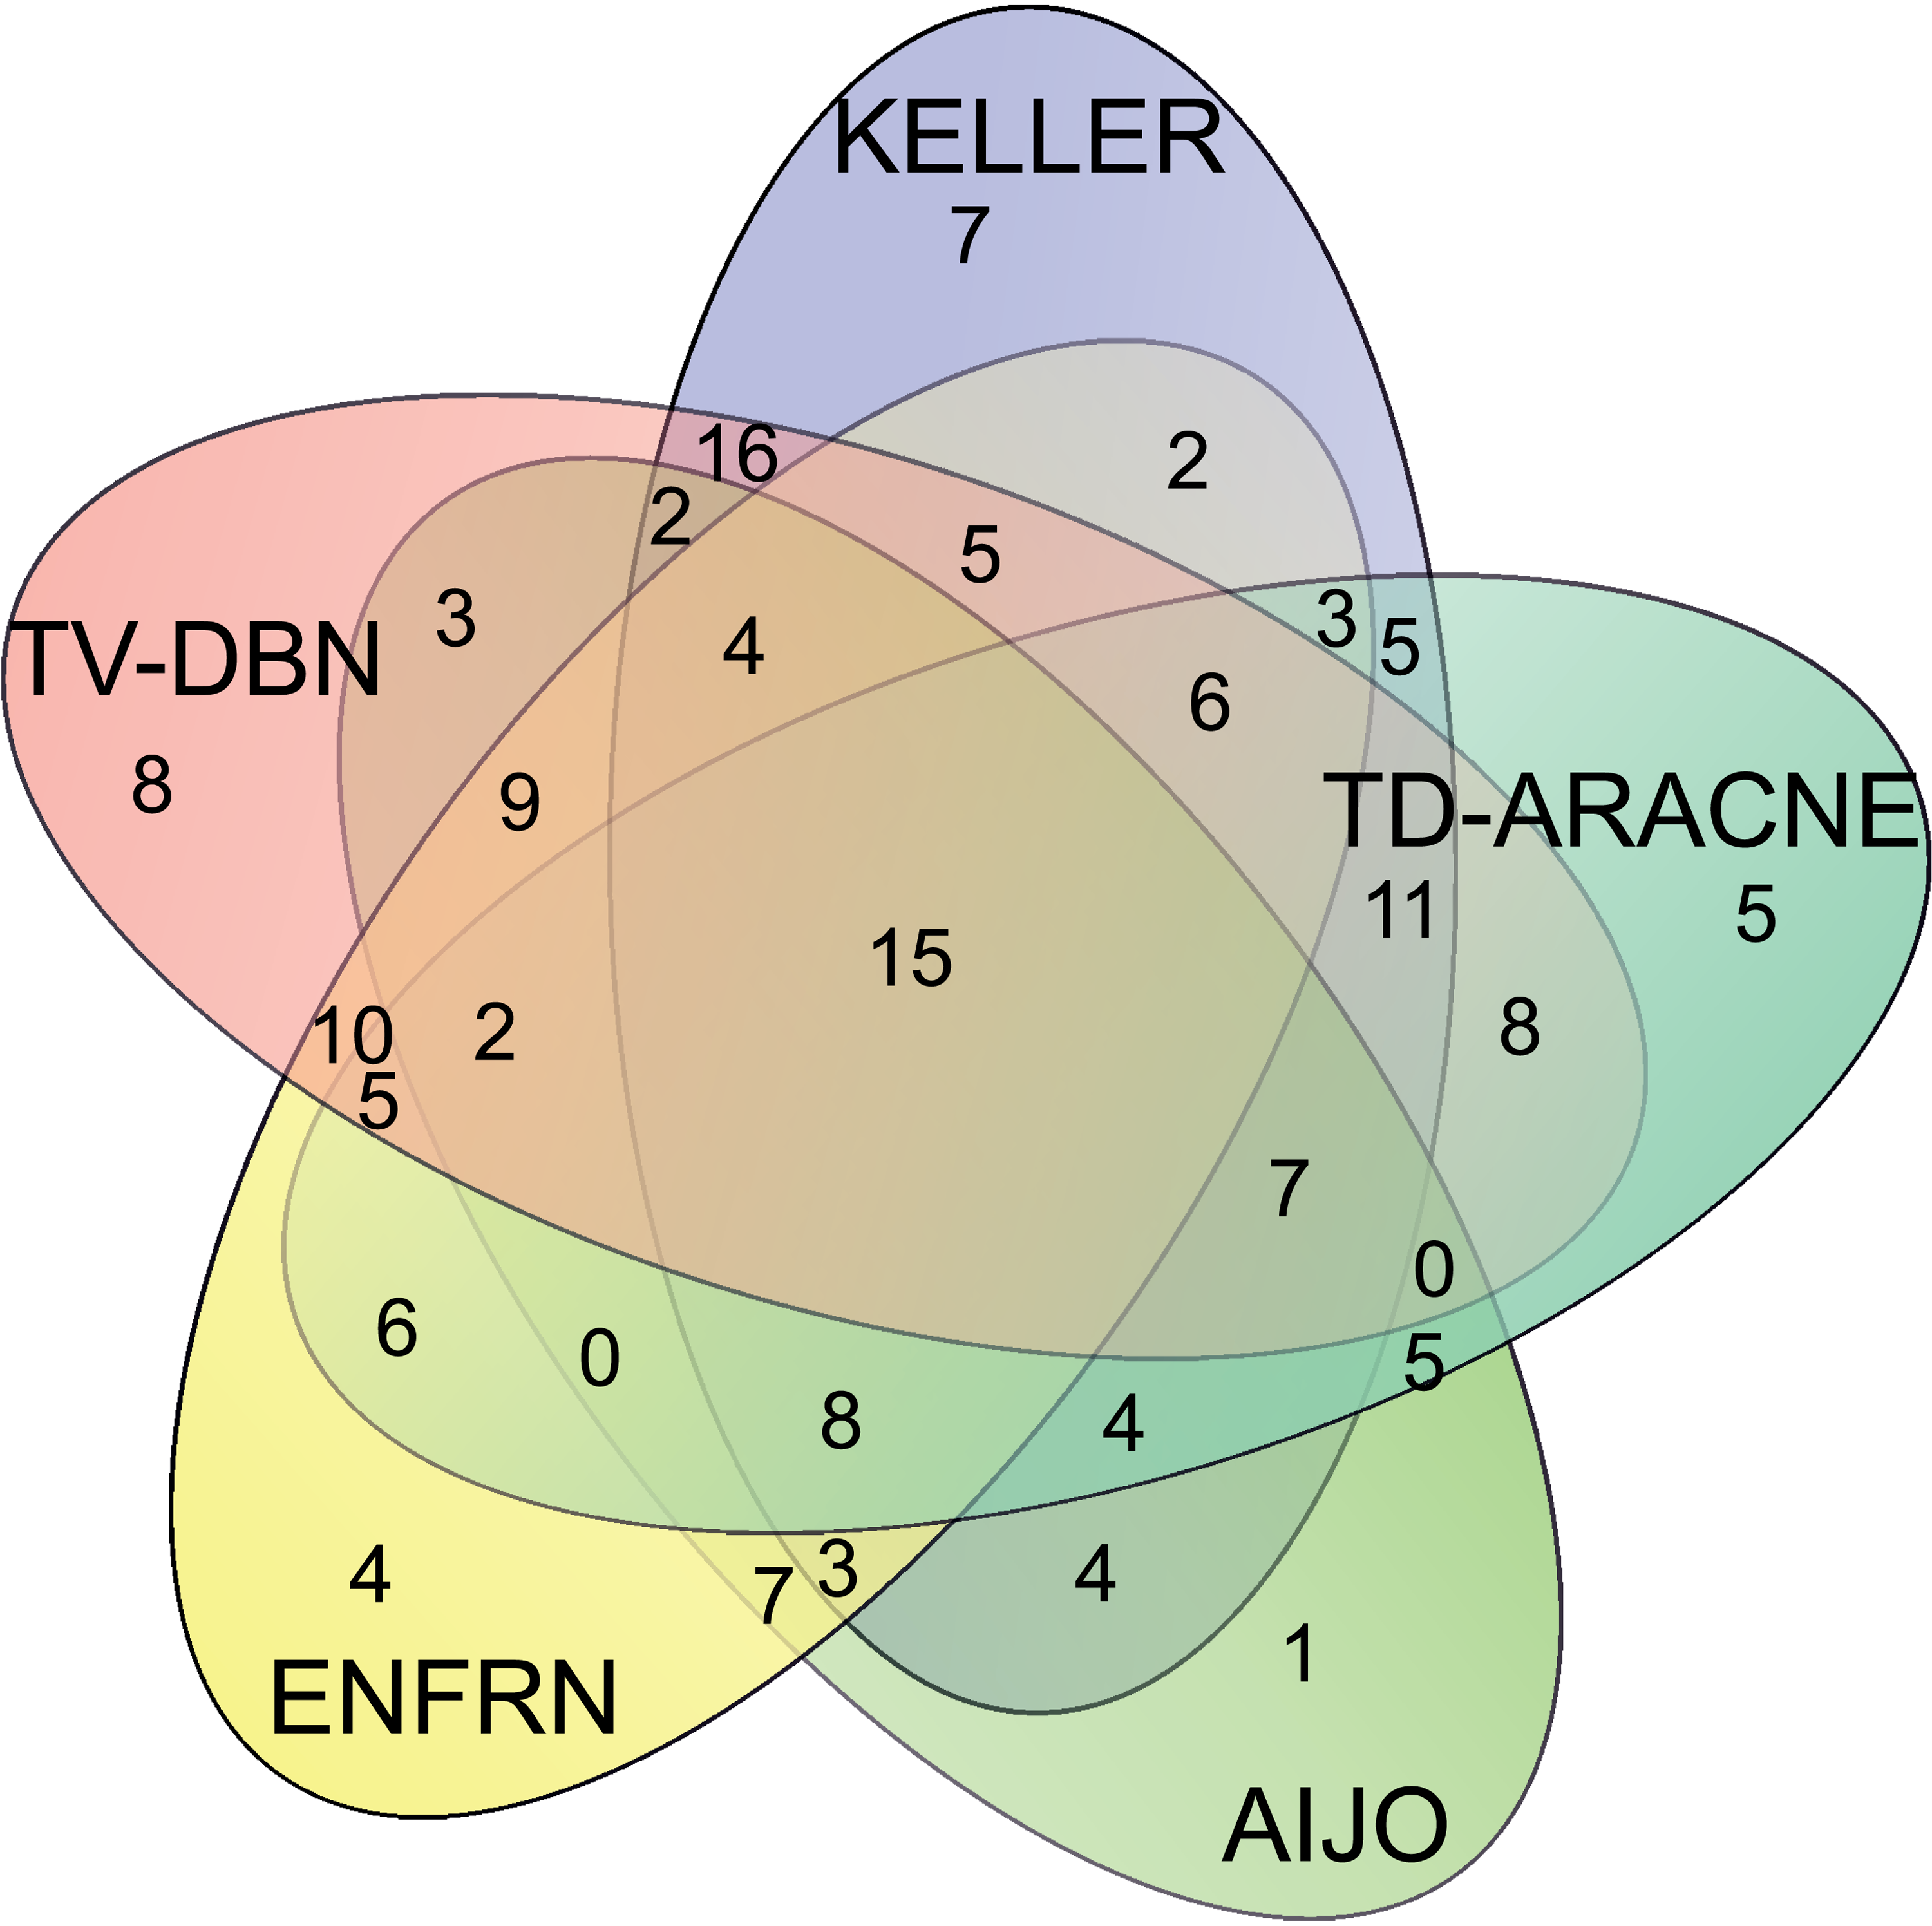
The five-way Venn diagram summarizes the number of common interactions in each combination of the five GRN Inference methods. As shown, 15 edges were common among all methods. We proved that the overlapping network of 15 edges was superior against the network descending from each network inference method based on F-score evaluation test (see Supplementary Text S2). Similarly, the overlapping network of 15 edges was superior, in terms of F-score values, against all the overlapping networks descending from every possible combination of methods (interactions supported by two, three, or four GRN methods).
The overlapping topology comprised of 15 nodes (out of the 29) and 15 edges out of the 105 possible edges of a complete graph (maximum number of edges=n (n−1)/2).
Evaluation of clusters in the overlapping network
With the scope to unravel the time-varying pathway interactome in response to influenza A infection, we focused on the overlapping network, including 15 clusters (out of the 29 in total) and 15 interactions verified by all GRN Inference methods. The cluster analysis highlighted the efficiency of FSTS algorithm in revealing the kinetics of many more other host response related pathways than those reported in our previous work (Pommerenke et al., 2012).
Cluster 7 was characterized by innate immune pathways such as NOD-like, Toll-like, cytokine–cytokine, and chemokine signaling. FSTS algorithm managed to capture the activity of NOD-like receptor pathway compared to the clustering result (8 identified clusters in total) of our previous work. Therefore, we add new knowledge about the activity pattern of this pathway, which was significantly activated at day 2 p.i. and remained so until day 10 p.i.
Another interesting case was cluster 2, which revealed antibody-depending mechanisms like phagocytosis, complement activation, and ADCC (antibody-dependent cytotoxicity). The significantly over-represented pathways were: NK cell mediated cytotoxicity, chemokine/cytokine signaling, and B cell receptor pathway, which are indicative of macrophage, NK, T, and B cell activation. As shown in Figure 1, the activation of cluster 2 started at day 2 p.i. with peak of upregulation at day 8 p.i., a time point that complied with the clearance of the virus from these cell populations. The identification of this cluster refines our previous kinetic model by setting part of B cell receptor pathway activation at day 2 p.i. instead of day 5 p.i.
Also, cluster 17 was characterized by the Fc-γ R-mediated phagocytosis pathway term. This cluster revealed the kinetics of phagocytosis, which was upregulated from day 18 p.i. until day 60 p.i.; this observation adds new knowledge to our previous kinetic model (Pommerenke et al., 2012).
Finally, clusters 12 and 27 were characterized by the PPAR signaling pathway. It has been reported that the activation of PPAR pathway can play a significant role in anti-inflammatory processes because it reduces the expression of several pro-inflammatory cytokines, chemokines, and cell adhesion molecules (Straus and Glass, 2007). Our results showed that this pathway remained suppressed in the whole time interval, which means that there was excessive inflammatory response to the virus. To this end, we re-address the so far perspective of the Influenza A kinetic model (Pommerenke et al., 2012) and argue that beyond activated also suppressed pathways, like PPAR, should be included.
KELLER vs. TV-DBN timeline
The overlapping network included the cluster–cluster interactions supported by all GRN reconstruction methods. In order to decipher the dynamics of the influenza A (H1N1) host response pathway interactome, we exploited the time-varying features of KELLER and TV-DBN methods. It should be noted that all implemented network inference methodologies are characterized as dynamic because they capture the features of a dynamical system; however, they provide a static summary network without defining the exact time of occurrence of each interaction. Nevertheless, TV-DBN and KELLER are both dynamic as well as time-varying methods, since they identify a series of network structures, one for each available time point. Although all GRN reconstruction methods participated in the construction of the interactome model, only TV-DBN and KELLER enabled us to set the timeline of the model.
As seen in Figure 4, KELLER predicted the occurrence of the majority of interactions in the time period (day 1–day 18 p.i.), while TV-DBN predicted the majority of interactions after day 8 p.i. The discrepancy between the two approaches is explained from the way the expression information is transformed; KELLER used the binarized form of the centroid expression profiles (see Material and Methods section), while TV-DBN used the continuous expression profiles. The binarization procedure intuitively raises questions about the resulting information loss. However, one may argue that binarization avoids the noise inserted from the data itself; the microarray data are derived from samples that constitute a mixture of cells such as, for example, epithelial or immune cells. At the technical level, noise is introduced during the hybridization, digitization and normalization processes.
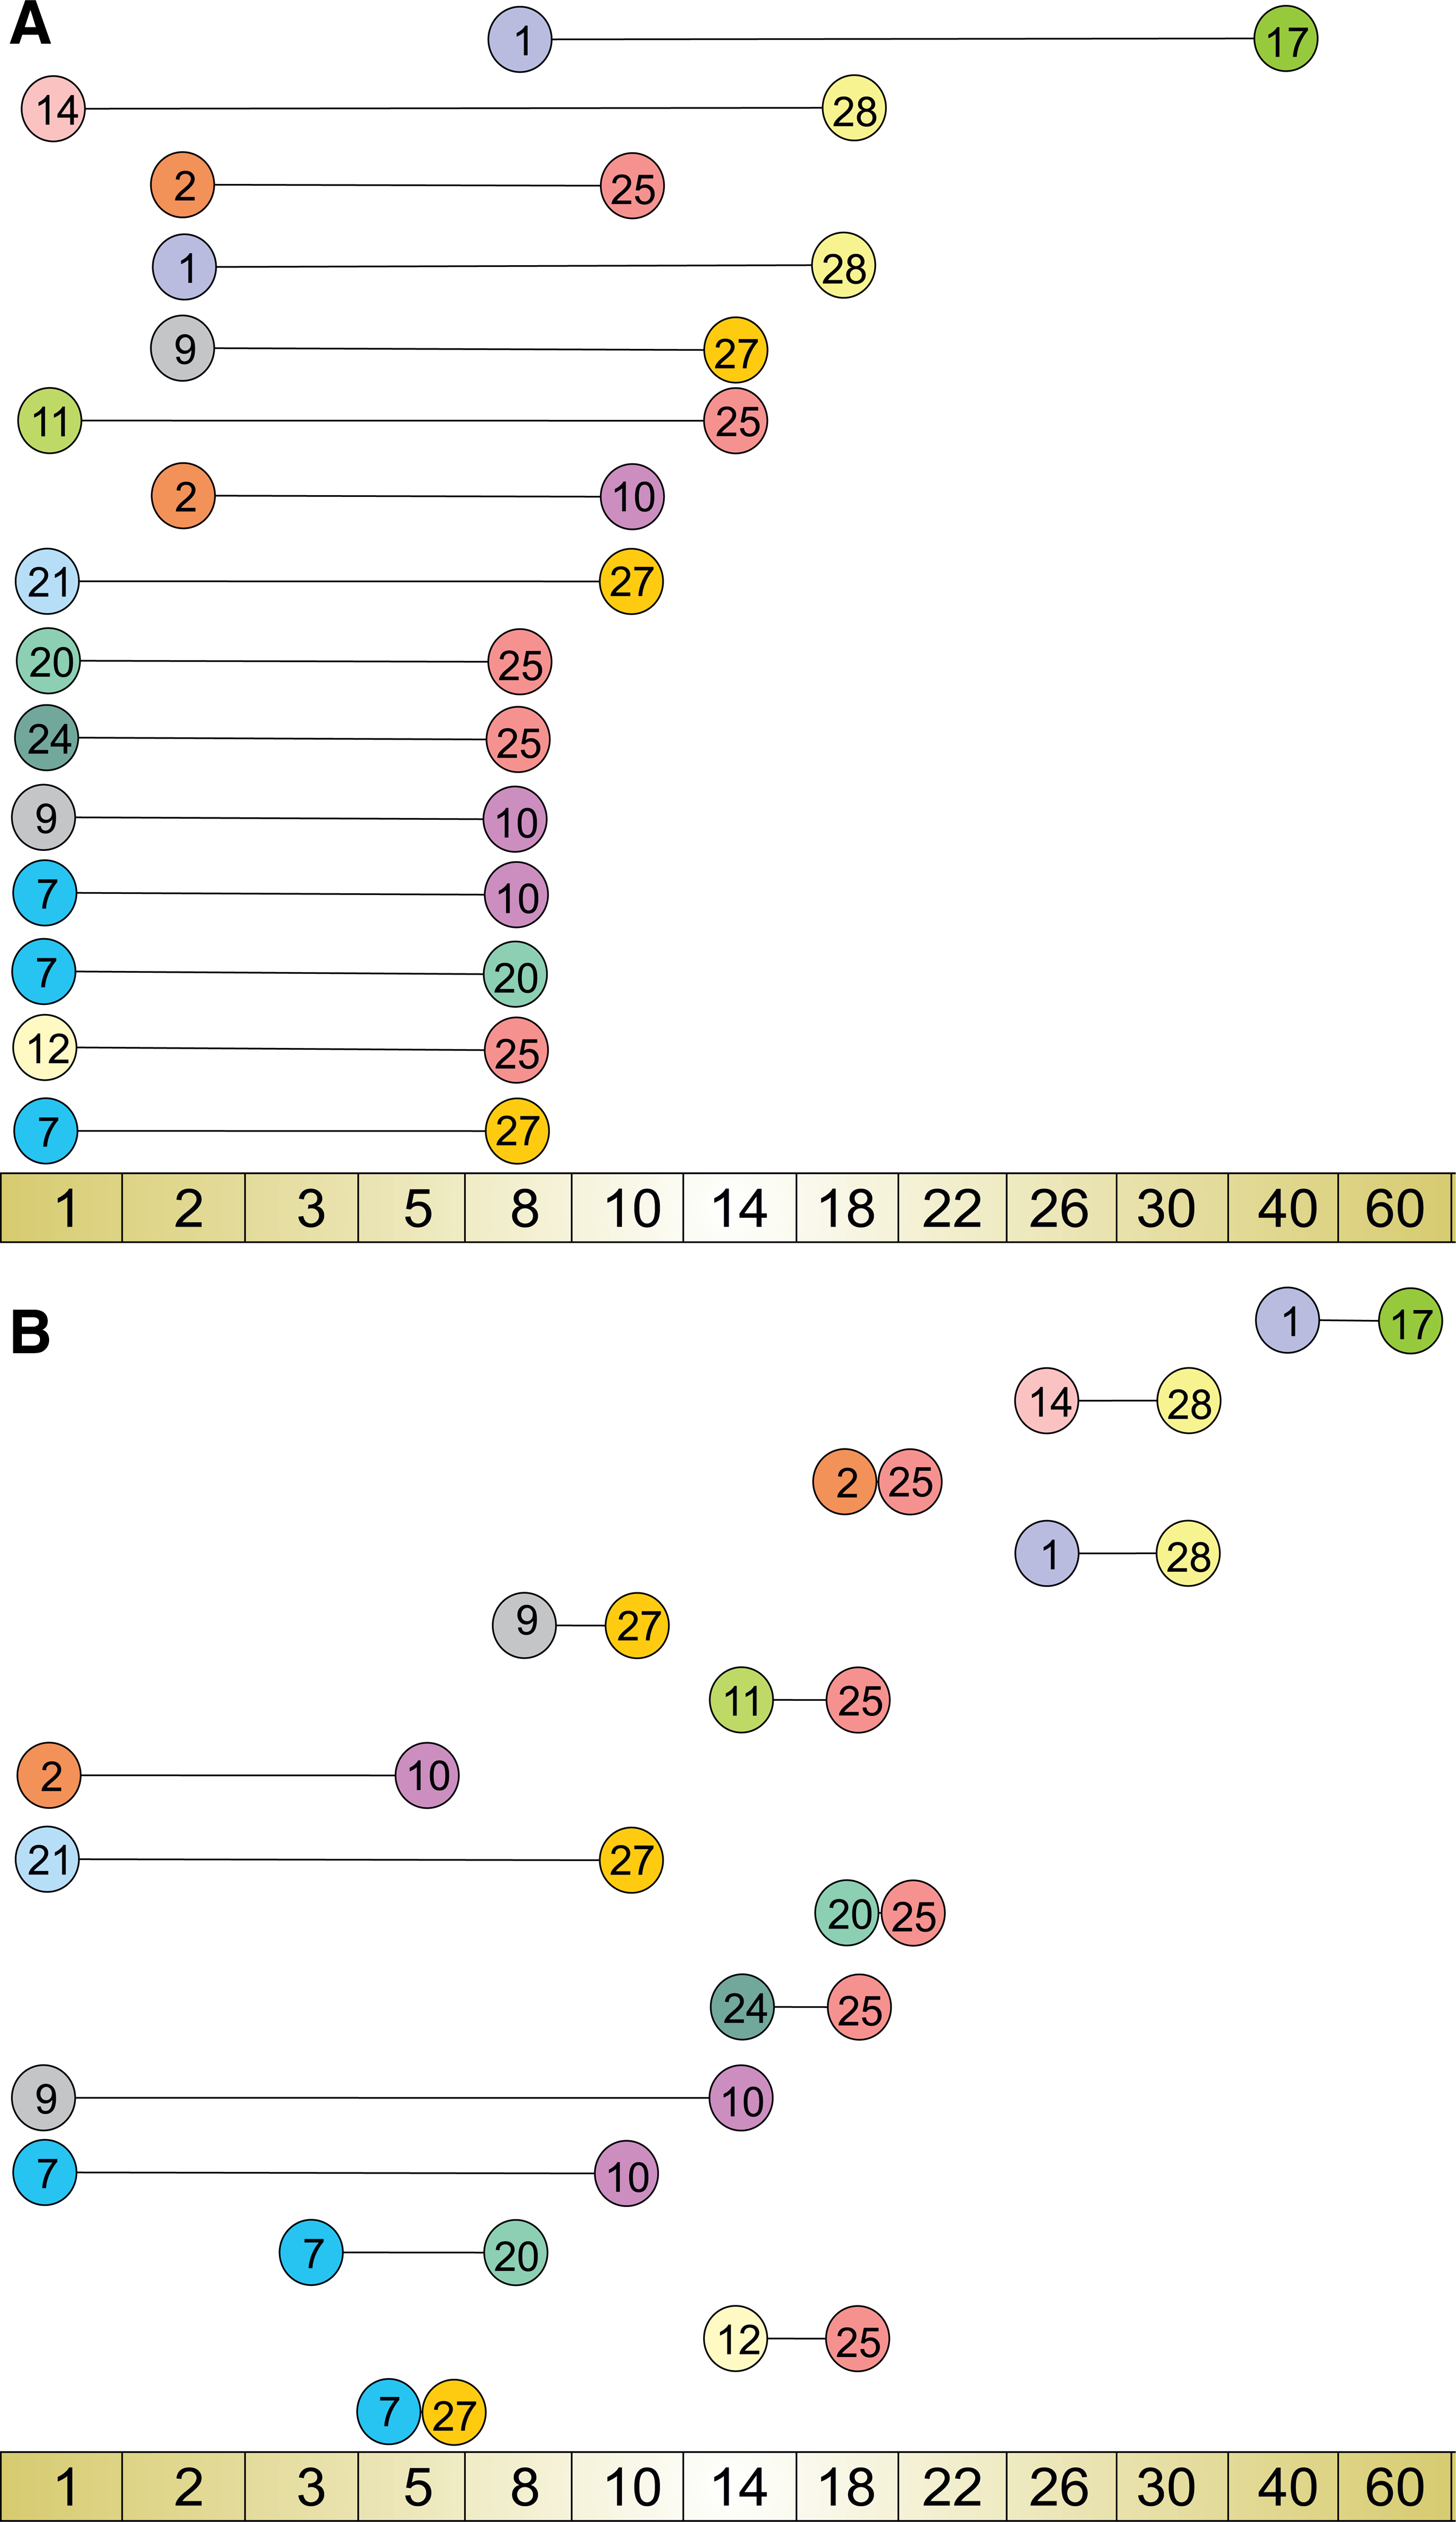
Timeline of the cluster–cluster interactions participating in the presented time-varying influenza A (H1N1) host response pathway interactome as predicted by
In this study, we chose to present the influenza A (H1N1) host response pathway interactome with the timeline proposed by KELLER, because it predicted the vast majority of interactions until day 8 p.i., a period that coincided with the kinetics of viral load, as shown in our previous work (Pommerenke et al., 2012), as well as with the period of activation of the main host response related pathways.
Time-varying influenza A (H1N1) host response pathway interactome
The influenza A host response pathway interactome was designed based on the interactions of the overlapping network and on the timeline predicted by KELLER method (Fig. 4A). To our knowledge, we offer the first draft of the pathway interplay of host response in time, thus all stated interactions along with the predicted time period of occurrence provide novel hypotheses without prior knowledge to be compared against.
The present model succeeds in depicting the following:
1. Host response mechanisms should be evaluated not by focusing on the kinetics of each pathway individually but rather through monitoring the time-varying features of the involved interactions. 2. The pathway interactivity undergoes severe ‘rewiring’ in time. 3. The timeline of pathway interactions does not necessarily coincide with the time points of peak activation/suppression of the involved pathways. 4. It appoints for the first time the role of suppressed pathways in host response; this attribute is neglected in the so far reported kinetic influenza A models in which only activated pathways are considered. 5. It gives a more realistic view of the host response.
In Figures 5 and 6, we provide an overview of the pathway interactivity transformations in time. As shown, the interactome complexity increased gradually with peak at day 8 p.i. and then gradually decreased with one remaining interaction at day 40 p.i. In Table 1, the 15 participating clusters are described with regard to over-represented KEGG pathway and GO terms (Fisher exact P-value<0.05).
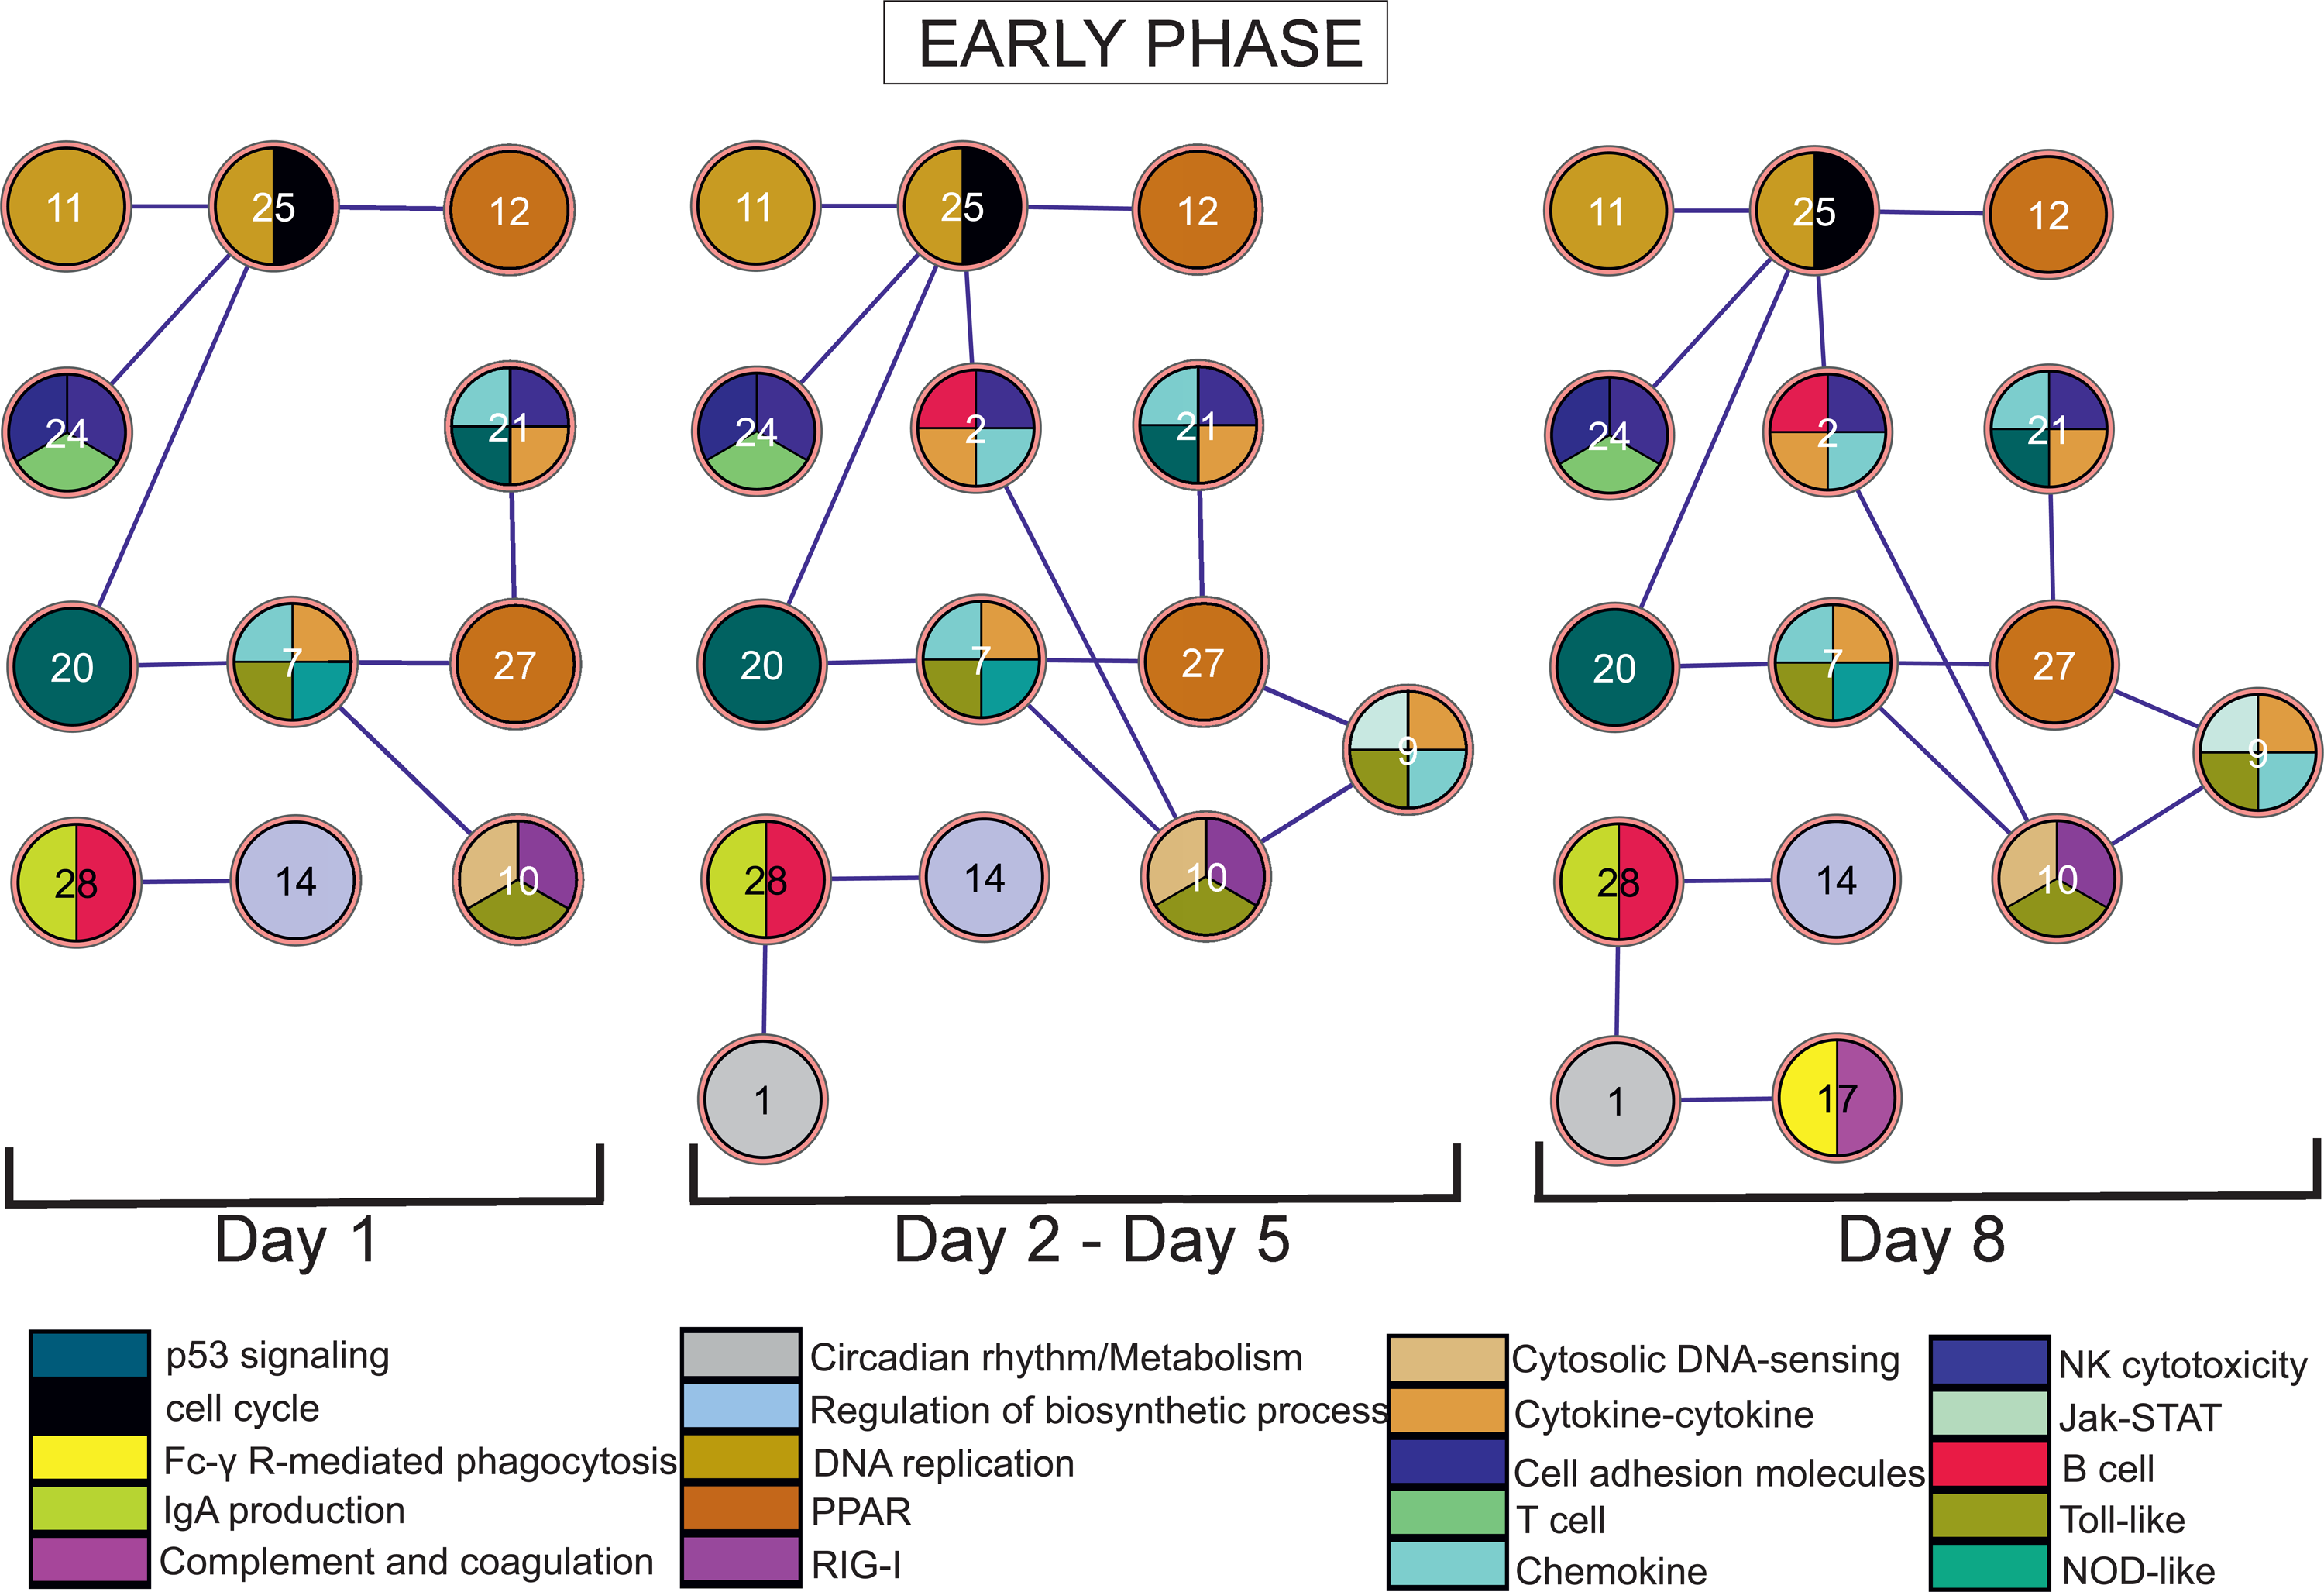
Time-varying influenza A (H1N1) host response pathway interactome. The complete time interval was divided into three phases: early (1–8 day p.i.), intermediate (10–18 day p.i.), and late (22–60 day p.i.). Only 15 clusters, out of the 29 clusters identified by FSTS, participate in the interactome. At each day (or time interval in case the network remains unchanged), the respective interactome is presented. The clusters are multicolored (with the use of ExprEssenceCytoscape plug-in by Warsow et al. (2010)) based on their over-represented KEGG pathway terms (Fisher exact p value<0.05). In this figure, only the early phase interactome is presented. As shown, the network expands with clusters 1, 2, and 9 during day 2—day 5 p.i. At day 8 p.i., the network reached its maximal complexity with one more cluster added (cluster 17).

Time-varying influenza A (H1N1) host response pathway interactome in intermediate and late phase (related to Fig. 5). Since day 10 p.i., the network complexity decreased gradually with one interaction at day 40 p.i.
KEGG pathway and GO analysis of the 15 clusters participating in the time-varying H1N1 host response pathway interactome. The first column corresponds to the cluster index, the second to the over-represented KEGG pathway terms, and the third to the over-represented GO terms (*p≤0.05, **p≤0.01, ***p≤0.001, ****p≤0.000001). Nd: Clusters with no enriched KEGG pathway terms were assigned as ‘not determined’.
Time-varying features of early phase (Day 1–Day 8 post infection)
On day 1 p.i. the interactome included several interactions. Surprisingly, this observation shows that there was strong coupling of pathways, although no pathway (except cluster 10) was significantly up/downregulated at this day. The interaction between clusters 11 and 25 (until day 14 p.i.), both characterized by cell cycle and DNA replication functions, was rather a self-loop. Interestingly, the interaction of cell cycle (cluster 25) with PPAR pathway (cluster 12) until day 8 p.i. raises new hypotheses; the PPAR pathway is usually involved in antagonizing core inflammatory pathways such as NF-kappaB, AP1, and STAT. Also, recent studies refer to the effect of activated PPAR-γ agonists in inducing cell cycle arrest and cell apoptosis (Bassaganya-Riera et al., 2010). In our case, the derived hypothesis is that the suppression of PPAR pathway may serve both in favor of the host in order to keep the anti-inflammatory processes low until viral clearance is achieved, as well as in favor or the virus in order to alleviate viral replication. Further, the interaction of cell cycle (cluster 25) with T cell receptor pathway (cluster 24) in the period day 1–day 8 p.i. suggests that another role of cell cycle may be the expansion of several immune cells such as cytotoxic T cells (He et al., 2010; Parnell et al., 2011; Yoon et al., 2010). In addition, we corroborate to the association of cell cycle processes (cluster 25) with the p53 signaling pathway (cluster 20), known for regulating DNA damage and inducing cell cycle perturbations in host cells (Terrier et al., 2011), and show that this interaction initiated from the very onset of infection and lasted until day 8 p.i.
Moving forward, we comment on the interaction between cluster 7 and 10 (day 1–day 8 p.i.), which shows the long lasting interplay of pathogen sensory pathways such as RIG-I, cytosolic DNA-sensing, NOD-like, and Toll-like, with cytokine and chemokine signaling. Also, at the same time period, cluster 7 interacted with cluster 29 (p53 signaling). Evidence of recent study (Muñoz-Fontela et al., 2011), in which p53 tumor suppressor is involved in regulating the cytokine production, provides a possible explanation why this interaction occurred since day 1 p.i.; it may serve the immediate need for cytokines, which in turn will activate immune cells. In addition, the interaction of cluster 7 with cluster 27 at the same time period indicates that the activation of inflammatory processes was also associated with the suppression of anti-inflammatory processes like PPAR pathway. This observation is further supported by the interaction of cluster 27 with cluster 21, also enriched in chemokine/cytokine signaling, NK cell cytotoxicity, and p53 signaling.
Further, we comment on the interaction of cluster 28, enriched in B cell and intestinal immune network for IgA production pathway terms, with cluster 14 enriched only in the GO term regulation of biosynthetic process. This interaction (until day 18 p.i.) indicates that the adaptive immunity was orchestrated from the very onset of the host response.
During the interval day 2–day 5 p.i., the network expanded with three more clusters (1, 2, 9), which can be interpreted as the recruitment of more genes related to the aforementioned pathways. Cluster 1, enriched in circadian rhythm pathway but also in the GO term regulation of metabolism, interacted with cluster 28. A possible explanation of this interaction lies in the findings of a late study which showed that there exist functional molecular clock mechanisms responsible for the expression fluctuations of B cell related genes at daily level (Silver et al., 2012). Cluster 2, enriched in B cell receptor, NK cell cytotoxicity, chemokine and cytokine signaling pathway terms, interacted with clusters 10 and 25. This interaction indicates that cell cycle was also responsible for the expansion of B and NK cells. Similar observations are obtained regarding cluster 9, which interacted with clusters 10 and 27.
Finally, at day 8 p.i. the network reached its maximal complexity with one more cluster added, which was correlated with the clearance of the virus from the lung and thus represents the peak of a successful immune response to influenza A virus. Cluster 17 introduced two other pathways, Fc-γ R-mediated phagocytosis and complement and coagulation cascades, which interacted with circadian rhythm and metabolic processes (cluster 1) until day 40 p.i. This interaction is supported by evidence that associate the formation and maturation of myeloid phagosomes for eliminating invading pathogens with the lipid metabolism (Yeung et al., 2006). Our network proposes that this was a process lasting long after viral clearance and establishment of adaptive immunity. Additionally, the interpretation of this interaction from the scope of circadian rhythm lies in the findings of Silver et al., (2012); and Keller et al., (2009), which revealed that the expression of many macrophage-related genes is regulated by functional molecular clock mechanisms.
Time-varying features of intermediate phase (Day 10–Day 18 post infection) and late phase (Day 22–Day 60 post infection)
On day 10 p.i., clusters 7, 10, 12, 20, and 24 were disassociated from their respective interactions in the topology. In general, these clusters reflected mainly part of the innate immune response mechanisms. On day 14 p.i., clusters 2 and 21 decoupled from the topology, which also reflected part of the innate mechanisms. On day 18 p.i., clusters 9, 11, 25, and 27 decoupled from the topology, indicating the end of cell cycle interactions (11 and 25) and the co-regulation of inflammatory processes with anti-inflammatory processes (27 and 9). Notably, the gradual decrease of network complexity in this phase correlated well with the formation of inducible bronchus-associated lymphoid tissue (iBALT) at the same time period as described in our previous work by Pommerenke et al. (2012)). The formation of iBALT is indicative of an effective immune response going along with the clearance of the pathogen. In the context of our approach, the dynamic transformations at the network level accorded well with the processes in the infected organ (Fig. 7). Finally, during late phase (day 40 p.i.), the network included only one interaction between cluster 1 and cluster 17.

Schematic representation of the increase and decline of the viral load, the formation of iBALT tissue, and complexity of the time-varying H1N1 host response pathway interactome in time. We note that the curves of viral load and iBALT tissue were built according to the findings of previous work (Pommerenke et al., 2012). The vertical dashed lines denote the time points where the peaks were found. The maximal value of complexity of the H1N1 model at day 8 p.i. (between the peaks of viral load and the formation of iBALT) shows that the dynamics of pathway interactivity transformations accord well with the two processes occurring in the infected organ.
Common host response interactivity features against murine-adapted PR8 strain and other influenza A subtypes/strains
Driven by the lack of other time series transcriptome datasets recording host response until 2 months after viral entrance, we employed two other time series microarray experiments that explored the host response of C57BL/6J mice against H5N1 subtype (McDermott et al., 2011) and H1N1pdm strain (Paquette et al., 2012). It should be noted that both experiments recorded the gene expression at a smaller time scale (until day 7 p.i.) compared to the scale of our experimental data (until day 60 p.i.). The different sampling resolution among experiments is a finite reason for discrepancies among models. However, we checked the hypothesis that the corresponding host response mechanisms share common features for the common time points. In detail, we applied the aforementioned cluster-based network approach on the 3,430 (H5N1) and 3,299 (H1N1pdm) genes matched with the predefined 3480 DEG set of H1N1 dataset. Next, the overlapping topology (with interactions supported by all GRN reconstuction methods), combined with the timeline predicted by KELLER method, was used to build the corresponding host response pathway interactomes. In Table 2 and Table 3, the timeline of pathway interactions is presented along with information regarding the overlap between models.
The H5N1 interactome was built on the same cluster-based multi-level network approach as in the H1N1 dataset. The overlapping cluster–cluster interactions of all GRN Inference methods along with the timeline defined by KELLER are presented. The second and fourth columns correspond to the over-represented KEGG pathway/GO terms (*p≤0.05, **p≤0.01, ***p≤0.001, ****p≤0.000001).
●: interaction present at the specific time point; †: interaction predicted by the H1N1 interactome; ‡: interaction predicted by the H1N1pdm interactome. With regard to H1N1 model, for comparison reasons, day 5 and day 8 were mapped with day 4 and day 7 of the H5N1 model, respectively. With regard to H1N1pdm model, day 6 was mapped with day 7 of the H5N1.
The H1N1pdm interactome was built on the same cluster-based multi-level network approach as in the H1N1 dataset. The overlapping cluster–cluster interactions of all GRN Inference methods along with the timeline defined by KELLER are presented. The second and fourth columns correspond to the over-represented KEGG pathway/GO terms (*p≤0.05, **p≤0.01, ***p≤0.001, ****p≤0.000001).
As observed, all models agreed on the enhanced long-lasting coupling of pathogen sensory pathways (e.g., RIG-I, NOD-like, cytosolic DNA-sensing) with other innate immune response pathways (e.g., NK cell cytotoxicity, Jak-STAT, chemokine and cytokine signaling) throughout the early phase. Also, all models supported the association of T cell receptor pathway with cell cycle since day 1.
Discussion
Immunomics is the combined application of systems-level methods on multiple omics data (transcriptomic, proteomic, metabolomic) with the scope to identify the immune reactions of a given host interacting with a foreign antigen (Braga-Neto and Marques, 2006; De Groot, 2006). In this regard, immunomics is the initial enabling step for the field of vaccinomics, since the first channels to the latter a set of candidate biomarkers as signatures of immune response that can lead to efficient vaccine development (Bernstein et al., 2011; Loukas et al., 2011; Poland et al., 2011). Towards this orientation, our immunomics study presents a robust ensemble modeling approach for revealing the dynamic pathway interplay throughout the host response to influenza A H1N1 infection based on transcriptome data. Driven by the scarcity of dynamic microarray experiments in influenza research, our approach is primarily tested on our previously published long-term transcriptome dataset obtained from lungs of C57BL/6J mice infected with a murine-adapted H1N1 (PR8) virus (Pommerenke et al., 2012). The derived observations are further compared side-by-side with the observations descending from two other dynamic but short-term transcriptome datasets from lungs of C57BL/6J mice infected with H5N1 and H1N1pdm. The lung pathology induced by the mouse-adapted viruses shows considerable similarities to that of human influenza pneumonia; thus, the changes that occur in the mouse lung can provide insight into the development of lung infection in humans (Ilyushina et al., 2010; Sweet and Smith, 1980). In this context, the proposed methodological framework pinpoints the value of dynamic microarray experiments and highlights the applicability of dynamic network inference algorithms in the comprehension of host response mechanisms in influenza and other complex infectious diseases. Our notion is that the extracted time-varying interactivity patterns cannot yet be regarded as testable, but rather as a push forward step for exploring the dynamics of host response in other mouse strains and other animal models such as ferrets, rats, guinea pigs, cats, dogs, and nonhuman primates. A collective host response model that replicates the major temporal features of illness in humans will have immediate impact on public health omics research, which in turn will translate the validated observations into public health interventions.
This work was inspired by the fact that classical clustering techniques, as employed in our recent work (Pommerenke et al., 2012), reveal the global dynamic expression pattern of a cell population or pathway individually but fail to set the dynamic dependencies among pathways or the time-varying aspects of these relations. Motivated by the aforementioned challenges, we aimed at capturing the transitional phases of the biological system after being challenged with a pathogen based on a time series of expression changes in the lung transcriptome. To accomplish that, we employed graph theory in representing the relationships among components. In particular, we combined the modeling power of several state-of-the-art dynamic and time-varying GRN Inference methodologies to retrieve a more robust network topology. In particular, we showed that intersecting the network results of all GRN methods is a more reliable approach than searching for the superior method and retain its network result for subsequent analysis. In parallel, in order to be able to present the ‘rewiring’ of pathway interactions in time, we re-addressed the network inference problem from the level of genes to the level of clusters. Co-regulated genes may be regarded as modules with shared features among the members. In this context, defining interactions among clusters reveals the high order organization of the interactome (i.e., the relationships among pathways).
The novel findings of the present work refer both to the gene clustering result as well as to the proposed time-varying influenza A (H1N1) host response pathway interactome. Compared to the clustering result of our previous work (Pommerenke et al., 2012), the efficient FSTS algorithm and the higher optimal number of clusters (29 clusters instead of 8) managed to reveal the kinetics of other host response related pathways (e.g., NOD-like receptor signaling, PPAR signaling, intestinal immune network for IgA production, and Fc-γ R-mediated phagocytosis). Also, we refined the kinetics of previously identified pathways, such as B cell receptor signaling, by setting its activation at day 2 instead of day 5 p.i.
The time-varying H1N1 host response pathway interactome had the following general attributes: (i) The overlapping topology included 15 out of the 29 clusters identified by FSTS clustering algorithm; the majority of remaining clusters were enriched in pathways related mainly to tissue repair processes. Therefore, our pathway interactome model was focused on the core host defense mechanisms against influenza A. (ii) The pathway interactions were significantly ‘rewired’ in time. (iii) At day 1 p.i., there was enhanced pathway interplay despite the fact that no pathway was significantly regulated. (iv) At day 8 p.i., the network reached its maximal complexity, a time point that correlated well with the viral clearance by the host and the initiation of formation of iBALT tissue. (v) An interaction between two pathways occurred in many cases at a different time point than the one in which the involved pathways displayed their peak/nadir activity in terms of up/downregulation. (vi) Interacting pathways displayed similar or anti-correlated expression patterns. (vii) Pathway interactivity lasted until day 40 p.i.
The main biological hypotheses extracted by our H1N1 model were the following: (i) Cell cycle had multiple roles in host response until day 14 p.i.: first, it was involved in the expansion of immune cells such as cytotoxic T cells, and second, its delayed activation could be mediated through PPAR and p53 signaling pathways. (ii) Many innate immune-related pathways affected the suppression of PPAR pathway until day 14 p.i., in a combined manner, to keep the anti-inflammatory processes low until viral clearance was achieved. (iii) The pathogen sensory pathways (e.g., NOD-like, Toll-like, and RIG-I) had a long-lasting effect upon cytokine/chemokine signaling pathways starting from day 1 until day 8 p.i. (iv) The interactivity potential of B cell receptor pathway started at the very onset of host defense (day 1 p.i.) and lasted until day 18 p.i. (v) Fc-γ R-mediated phagocytosis was associated with metabolic processes from day 8 until day 40 p.i., implying that the formation and maturation of macrophage phagosomes, as well as the ingestion of viral particles, was a process lasting long after the viral clearance and the establishment of adaptive immunity. (vi) There was long-standing cross-talk of the circadian clock with B cell receptor pathway, the intestinal immune network of IgA antibodies and Fc-γ R-mediated phagocytosis, which started from day 2 p.i. and lasted until day 40 p.i.
Further, we explored the idea that murine host response mechanisms against the mouse–adapted PR8 strain and other Influenza A subtypes or strains share many attributes with respect to pathway interactivity transformations in time. For this, the cluster-based network approach was applied at two time series transcriptome datasets from murine lung tissue after infection with H5N1 (VN1203) and H1N1pdm. Our analysis revealed that the derived interactomes agreed on the long-standing coupling of pathogen sensory pathways with innate immune pathways, as well as on the strong association of cell cycle activity with innate and adaptive immunity pathways throughout the early phase.
Finally, our findings pinpointed, among a large cohort of related studies, that mouse models provide an extremely valuable basis for understanding the immunome and set a knowledge reference system highly relevant for humans (Schughart et al., 2013). The mouse model is still under debate regarding the interpolation of findings to clinical research. Despite the drawbacks that make this model organism unsuitable for addressing certain virological questions, it has allowed the pre-clinical testing of several antiviral drugs and vaccines aimed at reducing morbidity and mortality in the population through amelioration of the virulence or transmissibility of influenza viruses (Matsuoka et al., 2009). Therefore, we argue rightfully that the described time-varying pathway interactome contributes substantially to our comprehension of the human immunome. In particular, dissecting the time-varying attributes of immunome is of great interest to drug design in the creation of effective “on time” vaccines to protect against particularly hyper variable viruses such as influenza A with great current impact on public health.
Conclusion
Our immunomics study represents an important enabling step towards unraveling the temporal evolution of regulatory networks directing the host responses to an acute infection. Our results show that the activation of the immune system provokes multiple underlying interaction ‘themes’ between pathways and such themes are dynamical. We provide a series of networks describing the fight of the host against influenza virus infection in the lung at the transcriptome level, and we show that such networks are context-dependent and undergo systematic rewiring. With this approach, we establish the first view of the time-varying pathway interactome that contributes to the comprehensive understanding of the murine host response system and provides a basis for new hypotheses. The extracted hypotheses should be further evaluated through other animal model transcriptomes before extrapolating the findings to clinical studies. Such systems biology efforts highlight the importance of temporal factor in the study of such multifactorial diseases such as influenza. The conceptual shift from studying the pathway dynamics to the dynamic pathway interactivity across various animal models will offer new scientific knowledge that will be translated into public health interventions.
In the future, higher time-dimensional and feature-rich gene expression data will allow us to further refine the resolution and structure of time-dependent networks and reveal additional novel interactions.
Footnotes
Acknowledgments
This research has been co-financed by the European Union (European Social Fund-ESF) and Greek national funds through the Operational Program "Education and Lifelong Learning" of the National Strategic Reference Framework (NSRF)—Research Funding Program: Heracleitus II. Investing in knowledge society through the European Social Fund. KS and EW are supported by the SYSGENET COST Action (BM0901):  .
.
Author Disclosure Statement
The authors declare that no competing financial interests exist.
References
Supplementary Material
Please find the following supplemental material available below.
For Open Access articles published under a Creative Commons License, all supplemental material carries the same license as the article it is associated with.
For non-Open Access articles published, all supplemental material carries a non-exclusive license, and permission requests for re-use of supplemental material or any part of supplemental material shall be sent directly to the copyright owner as specified in the copyright notice associated with the article.
