




Abstract
Abstract
Microarray experiments are a centerpiece of postgenomics life sciences and the current efforts to develop systems diagnostics for personalized medicine. The majority of antibody microarray experiments are fluorescence-based, which utilizes a scanner to convert target signals into image files for subsequent quantification. Certain scan parameters such as the laser power and photomultiplier tube gain (PMT) can influence the readout of fluorescent intensities and thus may affect data quantitation. To date, however, there is no consensus of how to determine the optimal settings of microarray scanners. Here we show that different settings of the laser power and PMT not only affect the signal intensities but also the accuracy of antibody microarray experiments. More importantly, we demonstrate an experimental approach using two fluorescent dyes to determine optimal settings of scan parameters for microarray experiments. These measures provide added quality control of microarray experiments, and thus help to improve the accuracy of quantitative outcome in microarray experiments in the above contexts.
Introduction
M
One potential area for technical improvement is the scanning process. The vast majority of the microarray platforms are fluorescence-based (i.e., using immobilized substrates to capture fluorescently-labeled targets through high-affinity binding). The fluorescence intensities of each microarray spot, representing the abundance of captured targets, are then converted into image files by means of a microarray scanner. Certain parameters of the microarray scanner such as the laser power and photomultiplier tube (PMT) gain can be adjusted by the end-user. While the laser power determines the amount of photons emitted from the fluorophores, the PMT amplifies the emitted photon signal detected. Thus, varying these parameters affects the total number of emitted photons and the amplified signal intensity of emitted photons. Although several studies indicate that scan conditions influence the readout of fluorescent intensities of microarray spots and subsequent data quantification (Lyng et al., 2004; Bengtsson et al., 2004; Shi et al., 2005), the impact of the laser power and PMT on the accuracy of microarray analyses remains inadequately understood, since many published articles do not mention scan settings in either Methods or Results sections, as if these were not relevant variables and their settings would not affect the experimental outcome. To explore further the impact of scan parameters on microarray data acquisition, the present study examined the effects of the laser power and PMT on the accuracy of antibody microarray analyses. The results show that the strength of the laser power and PMT of the microarray scanner can greatly affect the outcome of data analyses. More significantly, we demonstrate an experimental approach to determine the optimal settings of scan parameters. Because the strength of the laser power and PMT of each individual microarray scanner can be different, depending on the manufacturer, model, and age of the scanner, our data suggest that scan parameters need to be tested and optimized by determining the appropriate settings of the laser power and PMT in order to achieve the most accurate quantitation results.
Materials and Methods
The use of animals and the experimental procedures involving animals were approved by the Animal Care and Use Committee at Wake Forest University School of Medicine. Adult mice were euthanized with an overdose of pentobarbital (150 mg/kg body weight). Brain tissues were quickly dissected, frozen, and stored at −20°C. The procedure of antibody microarray experiments and data analysis was similar to that described previously (Gu et al., 2006, 2007; Chaga, 2008). It consisted of the following parts: 1) protein extraction from tissue samples; 2) protein labeling with Cy3 and Cy5 dyes; 3) removal of unbound dyes; 4) array slide incubation, wash, and dry; 5) array slide scans; and 6) data analyses. For protein extraction, 50–100 mg of frozen tissue samples were transferred to a pre-chilled mortar, and 0.25–0.5 g alumina (Sigma-Aldrich, St. Louis, MO) were added to the mortar (proportion: 0.5 g alumina per 100 mg tissue). The tissue was homogenized using a pestle until a paste was formed, and 1–2 mL of pre-chilled extraction buffer (Clontech, Mountain View, CA) were added (proportion: 2 mL extraction buffer per 100 mg tissue). The buffer and paste were well mixed and the extract was transferred to a pre-chilled microcentrifuge tube. The pestle and mortar were rinsed with 1–2 mL of pre-chilled extraction buffer, and the rinse was combined with the original extract. The suspension was centrifuged at 10,000 g for 30 min at 4°C. The supernatant was collected, transferred to a pre-chilled plastic tube, and stored on ice. The protein concentration was measured using a BCA Protein Assay Kit (Pierce, Rockford, IL) following the manufacturer's protocol. The protein concentration of each sample was diluted to 1.1 mg/mL by adding an appropriate volume of pre-chilled extraction buffer. For protein labeling, Cy3- and Cy5-dyes (0.1 mg in each vial, GE Healthcare, Piscataway, NJ) were dissolved in 110 μL of extraction buffers, respectively, by adding the pre-chilled buffer directly to the tube in which the dye was supplied. The tubes were thoroughly vortexed for 20 sec and spun down using a microfuge for 10 sec to recover the liquid in the bottom of the tube. Then, 50 μL Cy3 and 50 μL Cy5 solutions were each mixed with 450 μL protein solutions, respectively. The ratio (w/w) of proteins and Cy dyes was 10.89. The tubes containing the protein/dye mixtures were incubated on ice for a total of 90 min, during which the tubes were inverted once every 20 min. Then 4 μL of 1 M ethanolamine was added to stop the reaction, and the incubation continued on ice for another 30 min, during which the tubes were inverted once every 10 min. Unbound dyes were removed by gel filtration using PD-10 desalting columns (GE Healthcare) in a cold room (4°C). Each column was equilibrated with 5 mL of 1×desalting buffer (Clontech) three times. Cy3- and Cy5-labeled protein samples were applied to the respective columns and allowed to pass into the columns. 2 mL of 1× desalting buffer was added to each column and allowed to pass into the column to push the protein sample further along. Each protein sample was eluted by applying 2 mL of 1× desalting buffer to each column. The flowthrough was collected and stored on ice. The protein concentration in each sample was determined using BCA Protein Assay Kit (Pierce). Antibody microarrays targeted 507 distinct proteins (Table 1) were purchased from Clontech. Two antibody microarray incubation solutions were made with the following compositions: (1) 5 mL incubation buffer (Clontech), 33.4 μg of Cy3-labeled proteins, and 16.7 μg of Cy5-labeled proteins, and (2) 5 mL incubation buffer, 33.4 μg of Cy5-labeled proteins, and 16.7 μg of Cy3-labeled proteins. Each incubation solution was well mixed with gentle rocking for 5 min before an antibody microarray slide was added to the incubation tray. After 30 min incubation at room temperature with gentle rocking, each microarray slide was washed with seven gradual wash buffers provided by Clontech at 5 mL×5 min each, and dried by centrifugation (1000 g) in a swing bucket rotor for 25 min. The antibody microarray slides were scanned using a confocal microarray scanner (ScanArray Gx, Perkin-Elmer, Shelton, CT). The excitation wavelength and the emission filter wavelength for Cy3 and Cy5 were preset by the scanner's manufacturer at 543 nm/570 nm and 633 nm/670 nm (excitation/emission), respectively. Each microarray slide was scanned under different combinations of the laser power strengths and PMT levels (see Results section for details). The scanned images were saved as TIFF files. ScanArray Express (Perkin-Elmer) was used to analyze scanned array image files. A fixed-circle algorithm (diameter=200 μm) was applied to localize and quantify each microarray spot. The mean intensity of the fluorescent signal within each microarray spot circle, as well as the mean background intensity surrounding the microarray spot, was measured. The ratio of each target (T) at spot i (T
i
) between the two sample pools was calculated using the formula:
where Cy3Slide1 i =Mean intensity of Cy3 of spot i on slide #1 minus background;
Cy5Slide2 i =Mean intensity of Cy5 of spot i on slide #2 minus background;
Cy5Slide1 i =Mean intensity of Cy5 of spot i on slide #1 minus background;
and Cy3Slide2 i =Mean intensity of Cy3 of spot i on slide #2 minus background (Gu et al. 2007). The formula used to determine Ri has been validated previously in actual antibody microarray experiments and showed the benefit of eliminating or reducing the differential labeling effects caused by Cy3 and Cy5 dyes (Chaga, 2008).
Because four spot values are used in the above formula for the ratio calculation, the total signal intensity (I n ) of each target protein (n) was defined as the sum of the four: I n =Cy3Slide1 n +Cy5Slide2 n +Cy5Slide1 n +Cy3Slide2 n .
Results
We first performed conventional antibody microarray experiments as previously described (Gu et al., 2007). The microarray slides were scanned using either variable laser power with constant PMT setting or variable PMT settings with constant laser power. For instances, array slides were scanned using the laser power at 50%, 60%, 70%, 80%, 90%, and 100%, respectively, while the level of PMT was kept at 65%, or array slides were scanned using the PMT level at 50%, 60%, 70%, 80%, and 90%, respectively, while the laser power was kept at 90%. The intensities of the microarray spots on the microarray slides following different settings of the laser power and PMT were then quantified. To compare the results of different laser powers, we selected 80 array spots (40 Cy3 and 40 Cy5, respectively) at the laser power 50%, with an average intensity of 500 (n=10 for Cy3 and n=10 for Cy5), 1000 (n=10 for Cy3 and n=10 for Cy5), 1500 (n=10 for Cy3 and n=10 for Cy5), and 2000 (n=10 for Cy3 and n=10 for Cy5), respectively. The intensities of all these spots at the laser power strength 50%, 60%, 70%, 80%, 90%, and 100% are summarized in Table 2. The results show that with increased laser power strengths the intensity increase of Cy3 spots was always higher than that of Cy5 spots (Table 2). The differences became statistically significant when compared at the 60% level of the laser power and were true for all four spot intensity clusters (p<0.0001, respectively, t-test). Statistical differences between Cy3 and Cy5 spots were maintained at the 70%, 80%, 90%, and 100% levels of the laser power and for all four spot intensity clusters (p<0.0001, respectively). While Cy3 and Cy5 spots showed different intensity changes with changes of the laser power strength, the four clusters of either Cy3 or Cy5 (respective intensities at 50% laser power and 50% PMT=500, 1000, 1500, and 2000) displayed similar fold changes under the same laser power changes (Table 3).
Eight clusters of array spots were selected that had an average intensity around 500, 1000, 1500, and 2000, respectively, when scanned using 50% laser power. The intensities of these spots were followed by increased laser power strengths at 60%, 70%, 80%, 90% and 100%, respectively, while the PMT was kept constant at 65% for all these scans. SEM: Standard error of the mean.
Eight clusters of array spots were selected that had an average intensity around 500, 1000, 1500, and 2000, respectively, when scanned using 50% PMT. The intensities of these spots were followed by increased PMT levels at 60%, 70%, 80%, and 90%, respectively, while the laser power was kept constant at 90% for all these scans. SEM: Standard error of the mean.
By means of a similar approach, when comparing the results of different PMTs, we selected 80 array spots (40 Cy3 and 40 Cy5, respectively) at PMT 50%, with an average intensity of 500 (n=10 for Cy3 and n=10 for Cy5), 1000 (n=10 for Cy3 and n=10 for Cy5), 1500 (n=10 for Cy3 and n=10 for Cy5), and 2000 (n=10 for Cy3 and n=10 for Cy5), respectively. The intensities of all these spots at the PMT level 50%, 60%, 70%, 80%, and 90% are summarized in Table 3. Comparing Cy3 and Cy5 spot intensities under different PMTs, results demonstrated similar changes between Cy3 and Cy5 spots (Table 3). Statistical analyses revealed that, among the four spot intensities at power 50% and PMT 50% and among the tested PMT levels, only the 1500 and 2000 intensity clusters showed significant differences at 90% PMT level (p<0.01, t-test).
The data are further illustrated in Figure 1 to display changes of signal intensities of microarray spots at different laser power and PMT settings graphically, and how they behaved when the laser power and PMT settings were set at different strength levels. Based on these data, it could be concluded that intensity of neither Cy3-signal nor Cy5-signal was changed in a linear fashion with increased settings of the laser power or PMT, or changes in Cy3- and Cy5-intensity are not proportional to the setting changes of the laser power and PMT. In addition, changes in Cy3- and Cy5-intensity were not in parallel to each other with the same setting changes of the laser power (Fig. 1A–D), while this was also true when the setting of PMT was at high levels (Fig. 1G,H).

Effects of different strengths of the laser power
These data have several implications. First, spot intensities obtained using one combined setting of the laser power and PMT may not be simply extrapolated to another setting of the laser power or PMT without a proper testing or appropriate calibration. Consequently, ratios based on spot intensity measurements can differ considerably when the same microarray is scanned using different settings of the laser power and PMT. In addition, the fact that changes in Cy3- and Cy5-intensity displayed different magnitudes following the same setting changes of the laser power (Fig. 1A,D) or at high PMT setting levels (Fig. 1E,H) implies further complexity when both Cy3 and Cy5 are employed in the same microarray experiment.
To further assess that the laser power and PMT can affect not only the readout of microarray spots but also the final experimental outcome, we created an artificial ratio using a protein pool extracted from the mouse brain, conducted antibody microarray experiments, and compared the determined target ratios, as described previously (Gu et al., 2007). For the ratio assessment, total proteins extracted from mouse brains were used. It is conceivable that using real biological samples here would be closer to actual experimental situations and, therefore, more meaningful. The obtained protein samples were split in half, and labeled with Cy3 and Cy5, respectively. To create an artificial ratio of 2, we simply mixed 33.4 μg Cy3-labeled proteins with 16.7 μg Cy5-labeled proteins. To avoid potential labeling bias caused by the Cy-dyes, another mixture with 33.4 μg Cy5-labeled proteins and 16.7 μg Cy3-labeled proteins was made. No protein was artificially deleted from the protein samples. Thus, each of the CyDye-labeled protein portions contained all extracted proteins, and each protein in the mixtures of the CyDye-labeled protein samples had a ratio of 2 (Cy3- versus Cy5-labeled or Cy5- versus Cy3-labeled). Even though the abundance of each candidate protein in the extracted sample pool could differ considerably, the ratio of each protein, Cy3- versus Cy5-labeled in mixture #1 or Cy5- versus Cy3-labeled in mixture #2, was constant and equaled 2. Both mixtures were then applied in the same antibody microarray assay, using a reverse two-color and two-slide approach (Chaga, 2008). The advantage of using this strategy is that the theoretical ratio of the two protein samples is already known. If the experimental outcome matches the theoretical ratio, it would indicate that the settings of the laser power and PMT were optimal. By contrast, if the experimental ratios were significantly different from the theoretical ratio, it would suggest that the settings of the laser power and PMT were suboptimal.
Figure 2 illustrates examples of ratios that represent different values under a given setting of the laser power and PMT, and how they changed when the laser power (Fig. 2A) and PMT (Fig. 2B) were adjusted, stepwise, to higher levels. The numerical values of these targets and their percentage deviations from the theoretical score are further detailed in Table 4 for the laser power and Table 5 for the PMT, respectively. The ratios ranged from 1.27 to 2.79 for the laser power, and 1.26 to 2.63 for the PMT, respectively, and the maximal deviation was near 40% from the theoretical score R=2. These results show that the determined ratios of identical protein targets on the same microarray spots can differ considerably when using different settings of the laser power and PMT, thus confirming that these parameters can have profound effects on the accuracy of experimental outcomes.
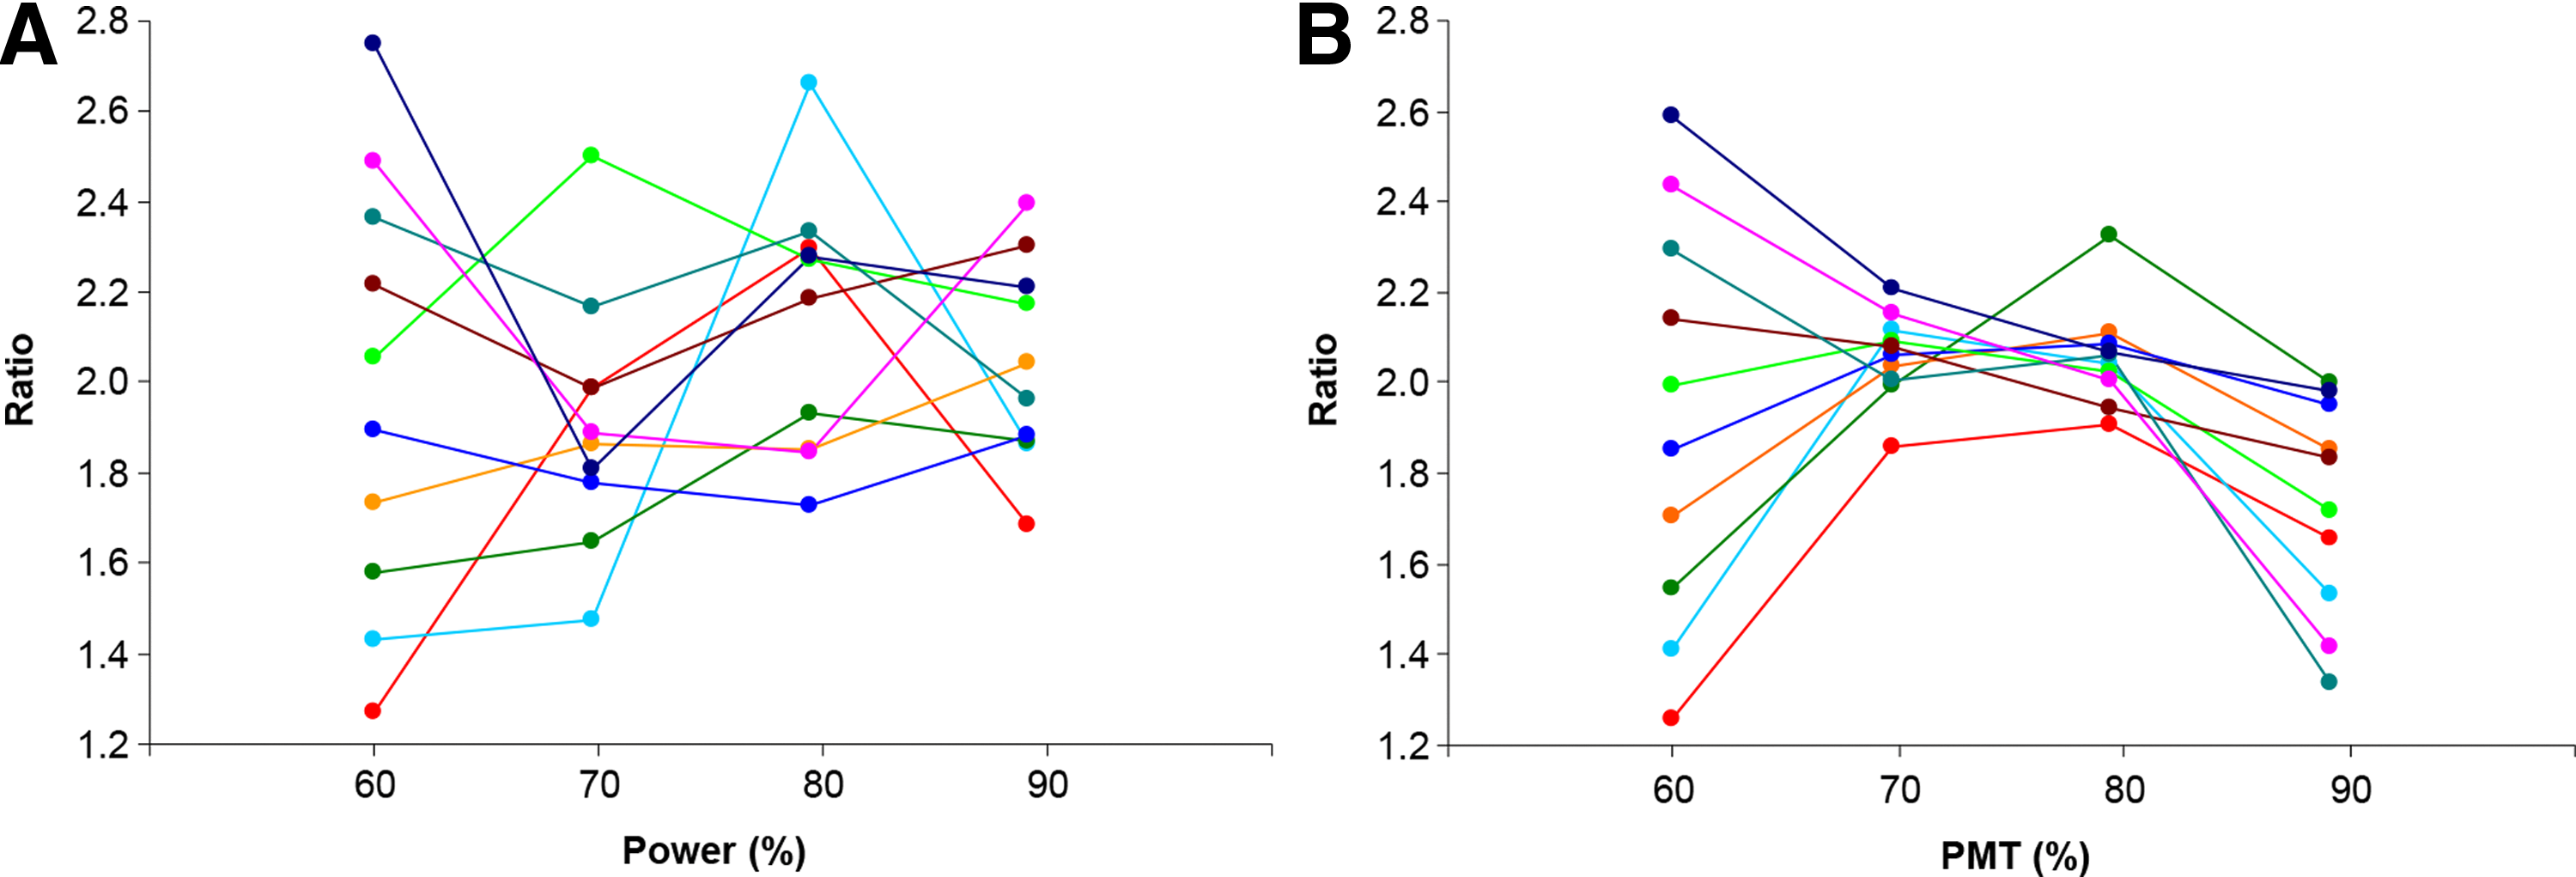
Examples showing effects of different settings of the laser power
Ten targets with ratios span throughout the ratio spectrum were selected when scanned using 60% laser power. The calculated ratios were followed by increased laser power at 70%, 80%, and 90%, respectively, while the PMT was kept constant at 65% for all these scans. A negative percentage indicates that the determined ratio is below the theoretical ratio, while a positive percentage indicates that the determined ratio is above the theoretical ratio.
Ten targets with ratios span throughout the ratio spectrum were selected when scanned using 60% PMT. The calculated ratios were followed by increased PMT levels at 70%, 80%, and 90%, respectively, while the laser power was kept constant at 90% for all these scans. A negative percentage indicates that the determined ratio is below the theoretical ratio, while a positive percentage indicates that the determined ratio is above the theoretical ratio.
We then systemically examined the overall effects of different combinations of the laser power and PMT settings on the ratios of all protein targets on the microarray slides. By means of the aforementioned approach, antibody microarray experiments were conducted five times. The evaluated combinations of the laser power and PMT settings were specified in Figure 3, as well as in Table 6.

Identification of the optimal level of the laser power and PMT based on five repeated experiments. In (
For this calculation, if the mean±error bar of an intensity interval in Figure 3 was completely out of the optimal range (outside of the dotted line range in Figure 3), the number of all targets within that intensity interval was counted as “out of the optimal ratio range.” The number in bracket is expressed as a percentage of the total targets. Based on these calculations, the combined setting of 80% laser power and 65% PMT generated the least number of ratio errors.
Since the microarrays targeted 507 distinct proteins and each antibody was double-printed on the array slides, a total of 5070 ratios were generated under each combination of the laser power and PMT settings. The total intensity (I n ) of each of these 5070 targets was calculated using the formula I n =Cy3Slide1 n +Cy5Slide1 n +Cy3Slide2 n +Cy5Slide2 n . Based on its I n value, each target was assigned to a group with similar I n values. When I n was ≤1000, an interval increment for each group of targets was 100 (e.g., Group 1 contained all targets with a total intensity I n ≤100; Group 2 contained all targets with a total intensity from I n =101 to I n =200; and so on), while when I n was >1000, an interval increment for a group of targets was 1000 (e.g., Group 11 contained all targets with a total intensity from I n =1001 to I n =2000; Group 12 contained all targets with a total intensity from I n =2001 to I n =3000; and so forth). The ratios of all targets within each group were averaged (mean±standard error) and plotted against the mean of the total intensities of that group (Fig. 3). This way, we were able to determine whether protein targets with the total intensity in a particular intensity interval could be vulnerable and generate inaccurate outcome under a specified laser power and PMT combination. The results in Figure 3 not only showed that different combinations of the laser power and PMT could generate different ratio outcomes, but in addition that protein targets with low I n values, likely representing low abundance, often generated inaccurate ratios, while protein targets with high I n values, likely representing high abundance, also showed inaccurate ratios when the laser power setting was high (Fig. 3C, 3D, and 3H). Moreover, Figure 3 provided an overall picture of all array targets under different laser power and PMT combinations, including the best results in Figure 3G (laser power 80% and PMT 65%) among all combinations of the laser power and PMT settings tested. Further calculations based on the number of targets outside of the optimal range (Table 6) gave the conclusion that the combination of 80% laser power and 65% PMT settings yielded the least error number of targets and therefore the overall best outcome.
Discussion
Our results showed differential changes in Cy3- and Cy5-signal intensities when the laser power setting was changed in the same magnitude. Such a disparity could be explained by the fact that Cy3 and Cy5 are excited by two separate laser sources. Even though the laser power setting indicates the same changes in magnitude for both, the actual changes in excitation of the two dyes might not be the same, thereby causing the differential signal intensity changes between Cy3 and Cy5. By contrast, at the post-excitation amplification stage, emitted photons of both Cy3 and Cy5 are amplified by the same photo multiplier, and therefore the same adjustment of PMT settings should generate identical changes in Cy3 and Cy5 signal intensity. The difference in intensity changes between Cy3 and Cy5 signals at high PMT settings could be explained by saturation of some pixels that were not equal at the low setting of PMT between the two dyes, since the intensity of each spot was calculated as the average of all pixel intensities within the spot. When array spots were scanned with increased laser power strengths, not only the Cy3/Cy5 molecules got excited but nonspecific photon signals from the bound proteins/antibodies on the same array spot might become apparent and be added to the total signal intensity, and thereby causing a nonlineal biphasic shape of these dose-response curves as displayed in Figure 1A–1D.
Our data suggest that under different settings of the laser power and PMT the experimental outcomes are mainly dependent on the total signal intensities of the targets (Fig. 3). The inaccurate ratios were especially prominent at the low and the high end of signal intensities. It is conceivable that array spots with low signal intensities could have bigger errors because the signal-to-noise level is relatively lower, while array spots with high signal intensities, which are at or close to the saturation level, could suppress the determined ratios because some pixels of the spots could be saturated. Only under the optimal scan condition was the number of inaccurate targets at a minimum (Fig. 3G), whereas suboptimal scan parameters could increase the number of inaccurate targets and therefore could be a direct cause of low quality microarray data. While our microarray scanner demonstrated a broad range of signal intensities with accurate ratios, it does not necessarily mean that other scanners could achieve the same results, since the actual levels of the laser power and PMT of each individual microarray scanner may not be the same, owing to differences in manufacturers, models, ages, confocal versus nonconfocal, etc. Only after proper quantitative assessments can the accuracy of the scan conditions be determined.
In the present study, we demonstrated the proof-of-concept as how the optimal settings of the laser power and PMT can be determined using two-color microarrays. To expand this approach, one could also use the principle described here to design experiments to determine optimal scan parameters for one- or multi-color-based microarrays, namely 1) create an artificial ratio between the target proteins, 2) perform microarray experiments, 3) scan array slides using different combinations of the laser power and PMT settings, and 4) determine the optimal setting of these scan parameters.
In order to detect targets of low abundant (i.e., to increase microarray sensitivity), high setting levels of the laser power or PMT are often used, which might not be the optimal combination for overall microarray scans. However, when applying such high scan settings in the testing experiments with an artificial ratio, the obtained results can be utilized to calibrate the true ratio. For example, if the theoretical ratio is 2:1 and a target shows an outcome of 1.5:1, then the result of the target in real experiments with a ratio of 1.5:1 would mean a true ratio of 2:1 under the same scanning parameters. If necessary, the target samples could be artificially diluted in the testing experiments to match the low concentration range of real biological samples. Thus, this approach would also be useful for an accurate ratio determination of low abundance targets.
In our experiments, real biological samples (i.e., mouse brain proteins) were used, which included both high and low abundant proteins. Since all protein spots on the antibody microarray slides were used for quantitative data analyses, and included in Figure 3, our results represent real biological samples with both high and low abundant proteins. In extreme cases when specific proteins with ultra low or very high abundance in biological samples have to be examined, we suggest artificial enrichment of ultra low abundant proteins and dilution of very high abundant proteins before actual antibody microarray experiments.
Several factors highlight the significance of the present study. First, our experimental approach has the ability to show quantitatively for each scan condition where the accuracy limits are. A number of previous studies suggested using multiple scans to determine a middle dynamic range of signal intensities for data quantitation (Lyng et al., 2004; Bengtsson et al., 2004; Shi et al., 2005; Khondoker et al., 2006; Piepho et al., 2006; Skibbe et al., 2006). However, since there is no common guideline available to define the middle dynamic range, the previously suggested approaches are qualitative and arbitrary and can differ from laboratory to laboratory. In biological systems, protein levels could have a very large dynamic range (i.e., the concentration difference between proteins of highest and lowest abundance). Therefore, it is possible that even using the best combination of the laser power and PMT settings, some proteins with extremely high or low concentrations could still result in inaccurate measurement. In such cases, the results of the testing experiments, especially at the low and/or high end of the intensity, could be utilized as standards to determine the deviation of each target from its true ratio, and to make appropriate corrections if needed.
Second, our results show that not only does PMT influence experimental outcome, as reported previously (Lyng et al., 2004; Bengtsson et al., 2004; Shi et al., 2005), but the laser power could also affect the accuracy of microarray data. The fact that the signal disparity between Cy3 and Cy5 was much greater under variable laser power than under equivalent changes in PMT (Fig. 1) suggests a larger contribution of potential errors from the laser power than from PMT. A possible explanation behind this observation is that, because Cy3 and Cy5 are excited by two different wavelengths, even under the same strength of the laser power (e.g., power=50%) different numbers of photons could be generated from Cy3- and Cy5-molecules. With increased laser power strengths the disparity of the difference could become more apparent. On the other hand, PMT is designed to detect and amplify the photon signals of exited fluorophores. Thus, if the difference between Cy3- and Cy5-generated phonons was small at the beginning (in our case PMT=50%), increasing PMT levels should not make photon signals of one dye proportionally more than the other, and therefore, should have limited impact, if any, on the signal disparity between Cy3 and Cy5.
Third, while saturated spots can be easily recognized as a potential source of errors, our results also show that weak spots could cause considerable errors under certain sub-optimal scan conditions (Fig. 3). Therefore, one should be cautious with results based on high as well as low intensity microarray spots if the scan parameters have not been evaluated.
Finally, since different types of microarrays use the same principle, namely utilizing a microarray scanner to capture fluorescent signals for target quantitation, the proposed experimental approach may also serve as a guide for optimizing scan parameters in microarray experiments dealing with DNAs, oligo-nucleotides, or other types of targeted molecules.
Several studies have examined the influence of scan parameters using cDAN microarrays, and different approaches for the optimization of scanner parameters have been proposed (Lyng et al., 2004; Bengtsson et al., 2004; Shi et al., 2005). Compared to these different approaches, our method possesses the following advantages: First, while previous studies used a sample ratio 1:1 for data assessments, we proposed a sample ratio that is different from 1:1 (2:1 in our case). That way, not only false-positive but also false-negative candidates could be identified. In addition, as the sample ratio is artificially created and constant for each target, there is no need to “spike-in” a standard. This is especially beneficial for antibody microarray assays, because not only synthesizing or purifying a protein and to make a sufficient quantity as a standard would be costly but a specific antibody that binds this protein must also be present on the microarray slides. Furthermore, since real biological samples are utilized in this method, they already contain high and low abundant candidates at their natural levels, and therefore the test results would reflect more closely their actual abundance levels of all candidates in these biological samples. Compared to other proteomics analyses, antibody microarray assays took only a small portion of the proteomics field based on the number of publications (Gu and Yu, 2014). It is hoped that the described approach here could facilitate future quality control of microarray experiments and data analyses.
Footnotes
Acknowledgments
This work was supported by Mr. and Mrs. Tab Williams Jr. and Family Neuroscience Research and Program Development Endowment. We thank Bryan Lamoreau for assistance in data analyses. The views expressed here are those of the authors and not necessarily those of the U.S. Food and Drug Administration.
Author Disclosure Statement
The authors declare that no conflicting financial interests exist.