




Abstract
Abstract
COV2HTML is an interactive web interface, which is addressed to biologists, and allows performing both coverage visualization and analysis of NGS alignments performed on prokaryotic organisms (bacteria and phages). It combines two processes: a tool that converts the huge NGS mapping or coverage files into light specific coverage files containing information on genetic elements; and a visualization interface allowing a real-time analysis of data with optional integration of statistical results. To demonstrate the scope of COV2HTML, the program was tested with data from two published studies. The first data were from RNA-seq analysis of Campylobacter jejuni, based on comparison of two conditions with two replicates. We were able to recover 26 out of 27 genes highlighted in the publication using COV2HTML. The second data comprised of stranded TSS and RNA-seq data sets on the Archaea Sulfolobus solfataricus. COV2HTML was able to highlight most of the TSSs from the article and allows biologists to visualize both TSS and RNA-seq on the same screen. The strength of the COV2HTML interface is making possible NGS data analysis without software installation, login, or a long training period. A web version is accessible at https://mmonot.eu/COV2HTML/. This website is free and open to users without any login requirement.
Introduction
N
All NGS technologies pose several challenges in terms of results analysis and visualization of mapping coverage of NGS data. There are many applications that have been developed for browsing, visualizing, and interpreting these mapping files. For example, Generic Genome Browser (GBrowse) (Stein et al., 2002) and Javascript-based genome browser (JBrowse) (Skinner et al., 2009) are designed to visualize genome assemblies, IGV (Robinson et al., 2011) is a multiple genome browser and BamView (Carver et al., 2012) manages both viewing and reading of short-read data. All these viewers load large mapping file with a consequent amount of time. Moreover, managing these files is laborious and most of the analysis programs require to be installed, a fact that is not completely obvious for biologists. Currently, some research groups visualize and analyse large-scale data sets from multiple NGS experiments by using available, but often modified, bioinformatics tools (Kroger et al., 2012). In fact, the readers usually reach only a minimal part of the huge information obtained and analyzed in publications. The remainder has to be interpreted, but that involves tools dedicated to users with a minimum of programming skills.
As more and more NGS data sets are made available, their analysis becomes more diverse and complex and, as a consequence, needs experienced and skillful experts. On the other hand, the main bottleneck for biologists to perform their own global and specific analysis is the use of dedicated tools without the help of a bioinformatics expert. Ideally, biologists should have a ‘plug and play’ software for such studies. Thus we developed COV2HTML, an accessible visualization and analysis tool for biologists, which consists of two distinct and highly dependent programs. The first one, MAP2COV, (i) calculates the genome coverage from the heavy mapping file, reaching several Gb, and (ii) extracts gene, rRNA, tRNA, and ncRNA information from annotation files to create light result files of a few Mb. This reduction greatly simplifies data management for the further NGS analysis and facilitates saving of data on a classical computer. Actually, large files could pose some informatics issues such as an incompatibility with old file systems (FAT32) that do not accept files of more than 4 Gb, or with less powerful computers that lag due to the high amount of data. Furthermore, size reduction makes results transfer by e-mail or upload for instance much easier. The second program is a visualization tool dedicated to investigate the coverage of genes or their promoter region according to DNA-, RNA-, ChIP-seq, or TSS experiments. One or two conditions with a maximum of four replicates per condition can be processed, or up to eight experiments of diverse types can be visualized in parallel. Zoom on both axes (X, Y) and a down-drop list to pack replicates into one mean coverage view are available. Finally, the analysis is managed by two filtering criteria: gene coverage level and fold change. Statistical results can be integrated from any source by using a tabulated text file, and if this is not available, coverage results can also be standardized in the software. The strength of the COV2HTML is to easily analyze and share data without software installation, login, or a long training period.
Methods
Implementation
COV2HTML is a web interface designed for biologists that allows coverage visualization of NGS data before being studied. In order to ease both data loading and processing, COV2HTML uses its own coverage format instead of directly handling huge alignment map or coverage file. Thus, after having been mapped against the reference genome, the NGS data are converted by the tool MAP2COV provided with the visualization interface. MAP2COV is written in Python 2.6 (http://www.python.org/) and is available both in command line and in “one click” graphical versions (require Python 2.6 or 2.7 and Tcl/Tk installed). COV2HTML is a web interface implemented in PHP 5.0 (http://www.php.net/) to generate dynamic HTML content. The web version (https://mmonot.eu/COV2HTML/) is currently running on a PC server with Ubuntu Linux using an Apache HTTP server to support web services. The source code and documentation are freely available at http://cov2html.sourceforge.net/ under a GPL license (GPL 3.0). Moreover, for better understanding of the code source, an effort was done to annotate Python and PHP functions of each program.
MAP2COV: Conversion of NGS data
MAP2COV is useable on three operating systems (Linux, Mac OS X, and Windows) in command line or through a graphical interface written in Tcl/Tk (http://www.tcl.tk/software/tcltk/license.html). For the two latter platforms, we used PyInstaller (http://www.pyinstaller.org/) to generate “one click” binary executables. MAP2COV works with three mandatory inputs (Fig. 1): (i) a file containing the annotated reference sequence previously used for the mapping assembly in GenBank (Benson et al., 2012) or EMBL (Kulikova et al., 2007) format, or two files, one containing the reference sequence in Fasta format, and the second one containing annotations in GFF3 format (Stein, 2010) or features nucleotide sequence in Fasta format; (ii) an alignment map file in SAM’/’BAM (Li et al., 2009), ELAND (http://ccg.vital-it.ch/chipseq/elandformat.html), or WIG format (http://genome.ucsc.edu/goldenPath/help/wiggle.html). Users also have to select the type of data contained in the alignment file, DNA (DNA-seq), RNA (RNA-seq), TSS (Transcriptional Start Site), or ChIP (Chromatin ImmunoPrecipitation); and (iii) optional parameters. Anonymize data (default: No): replace identifier (ID) of genes with CDS numbered from the origin (CDS1, CDS2…), and remove their description. Read-length threshold (default: 20 bp): remove reads from the alignment file shorter than the threshold in order to avoid nonspecific aligned reads. Strand-specific data (default: No): generate an output file for each strand from the alignment. Genetic Elements Coverage Value (default: Mean Coverage): coverage of genes and intergenic regions is calculated either as the mean coverage or as the number of reads that match on them (Raw Counts).
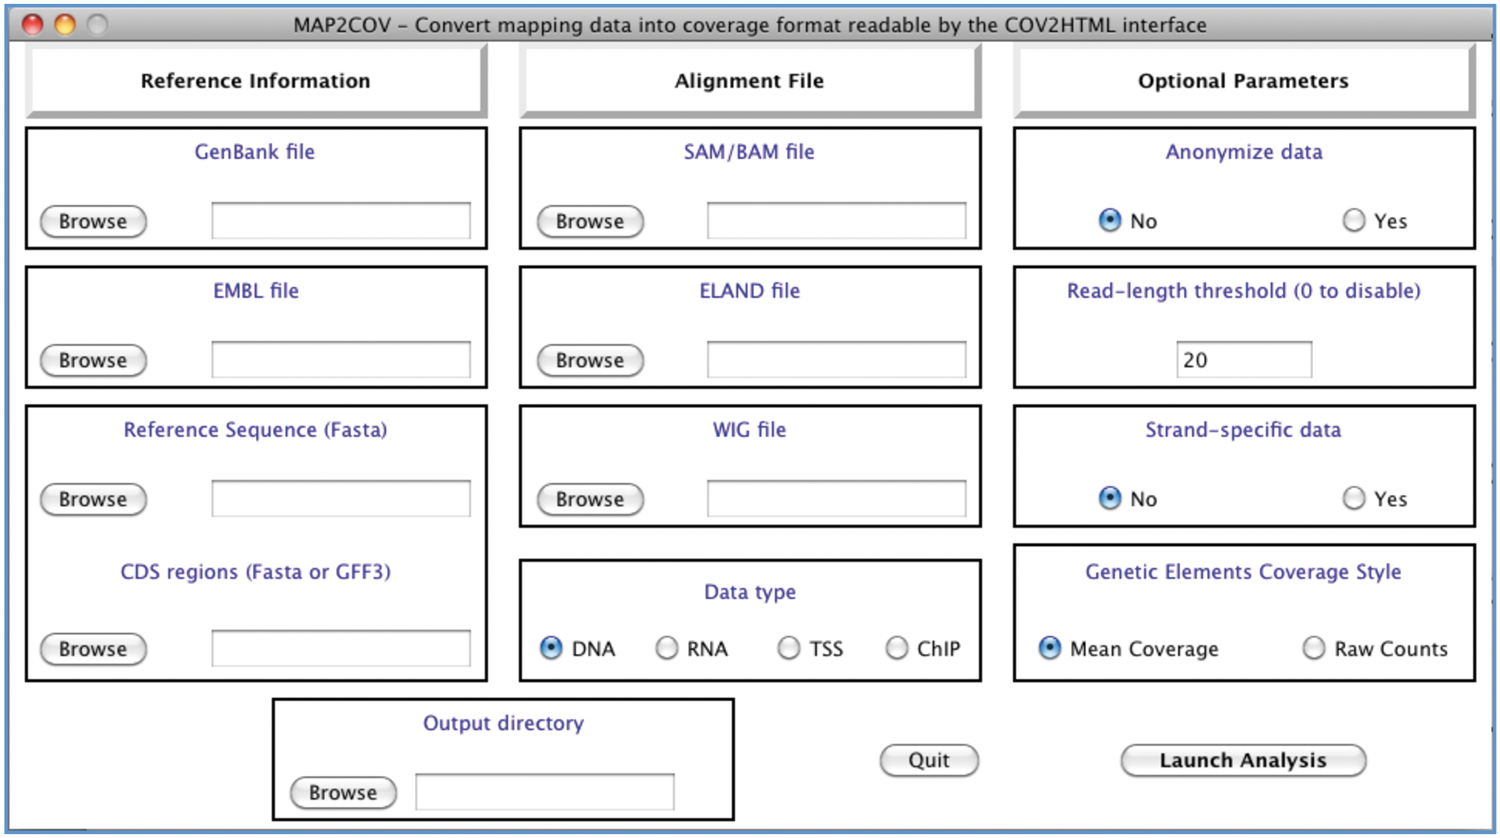
MAP2COV Tcl/Tk graphical interface. Three parts must be filled out (i) Reference information: GenBank, EMBL file, or Genome and Annotation files; (ii) Alignment File: SAM/BAM, Eland, or Wig files; Data type: DNA, RNA, TSS, or ChIP; (iii) Optional parameters: Anonymize, Read-length, Strand-specific, or Genetic Elements Coverage Style.
MAP2COV extracts first the interesting features in extenso CDS, rRNA, tRNA, ncRNA, and reference sequence length contained in complete GenBank, EMBL files or Fasta, GFF3 files. Feature information (ID, position, strand, type, and description) is recovered directly from these files. For the gene nucleotide sequences in Fasta format, an alignment step is performed to find out their position in the genomic sequence. The ‘find’ function of python is used to get back the position of the first exact match of each CDS in the genomic sequence plus and minus strand. In order to prevent that exactly duplicated genes correspond to only a single position on the reference genome, once a match has been found, one part of the corresponding sequence is masked by Ns in the reference genome before subsequent searches. Only part of the match is replaced to avoid losing the information necessary for overlapping genes. As this step could not be 100% accurate, users are advised to use EMBL, GenBank, or GFF3 file whenever it is possible. Finally, intergenic region (IGR) elements are created and begin one base after the stop codon of the previous gene, and end one base before the start of the next gene, except in case of overlapping genes where IGR are ignored. IGR are numbered from the origin and their description contains the ID of the surrounding genes.
The position and direction of the read matches present in the alignment file are used to calculate the coverage of the reference genome except for the WIG format, which contains only the genomic coverage information. In the case of alignments performed against more than one reference genome and stored in the same SAM/BAM file (e.g., bacteria genome and plasmid), MAP2COV retrieve the reads from the right alignment using the genome reference length. The reads are stacked on the reference genome to compute the genomic coverage. Then the coverage of genes and IGR is calculated according to the selected coverage style. For the mean coverage method, the read summation is divided by the length of the genetic element, whereas the raw count method is defined by a single hit per read, so only the first-base position of the read is used. If the data type TSS or ChIP are provided, the coverage is calculated in the expected promoter region, from 250 bp upstream of gene start codon to 100 bp downstream.
The output file is formatted as follow: the data type, the specified strand (in the case of stranded analysis), the genomic reference coverage, the coverage of the mapped-read first-base (TSS processing only), the annotation (ID, position, strand, type, and description, if available) and the coverage value of each CDS and intergenic regions, respectively. By default, the coverage value of genetic elements is summed for both strands. In case of a strand-specific processing, the coverage is given for each strand and two output files are generated (plus and minus). Coverage data are given for each position with 10,000 values per line. To avoid overwriting issue, the output name is automatically generated as ‘export_map2cov.txt’ with an incremental number at the end if the name already exists. The coverage output file is then bzip2 compressed to speed up online loading in COV2HTML.
COV2HTML interface: Integration, visualization, and analysis of NGS data
The compressed coverage files from MAP2COV have to be directly visualized by submitting them into the COV2HTML interface. COV2HTML uses simple HTML code that assumes the low-technology style of the interface, allowing larger browser compatibility (Supplementary Table S1; supplementary material is available online at www.liebertpub.com/omi) and better swiftness, with a high real-time reactivity. The interface is divided into 2 PHP web pages, «connexion.php» for data integration and «visualization.php» for data visualization.
Data integration
In the «connexion.php» web page, analyses are entered into database or selected from down-drop lists. Each analysis is defined by the title and two conditions can be compared with a maximum of four replicates per condition (Fig. 2a). Otherwise, COV2HTML can be used to visualize up to eight experiments of diverse type performed on the same genome. The title should be chosen to describe analysis carefully as there is no link between coverage files and experiments. A label of up to four characters could be attached to each condition and numbered per replicate, for example, ‘WT1, WT2’ (mandatory if statistical results are provided). Users could also integrate statistical results obtained from any source using a tabulated text file with the following columns: gene identifier (ID), each condition numbered per replicate (e.g., WT1, WT2, rpoN1, rpoN2), each condition normalized value (e.g., WT, rpoN), fold change value (FC), p value (pvalue), and a significativity column with 0 or 1 value (significant). Analysis integration into database takes approximately 30 seconds for each file, depending of the Internet connection (see below performance test). The analysis is saved in the YOUR Analysis down-drop list of the «connexion.php» page (Fig. 2b). As there is no login requirement, analysis is linked to a cookie created in the web browser for 2 years. Case studies are stored in the TUTORIAL Data down-drop list. Articles that used COV2HTML are stored in the PUBLISHED Analysis down-drop list. Finally a REMOVE Analysis button is present to erase one or all of the analyses attached to the computer's browser.
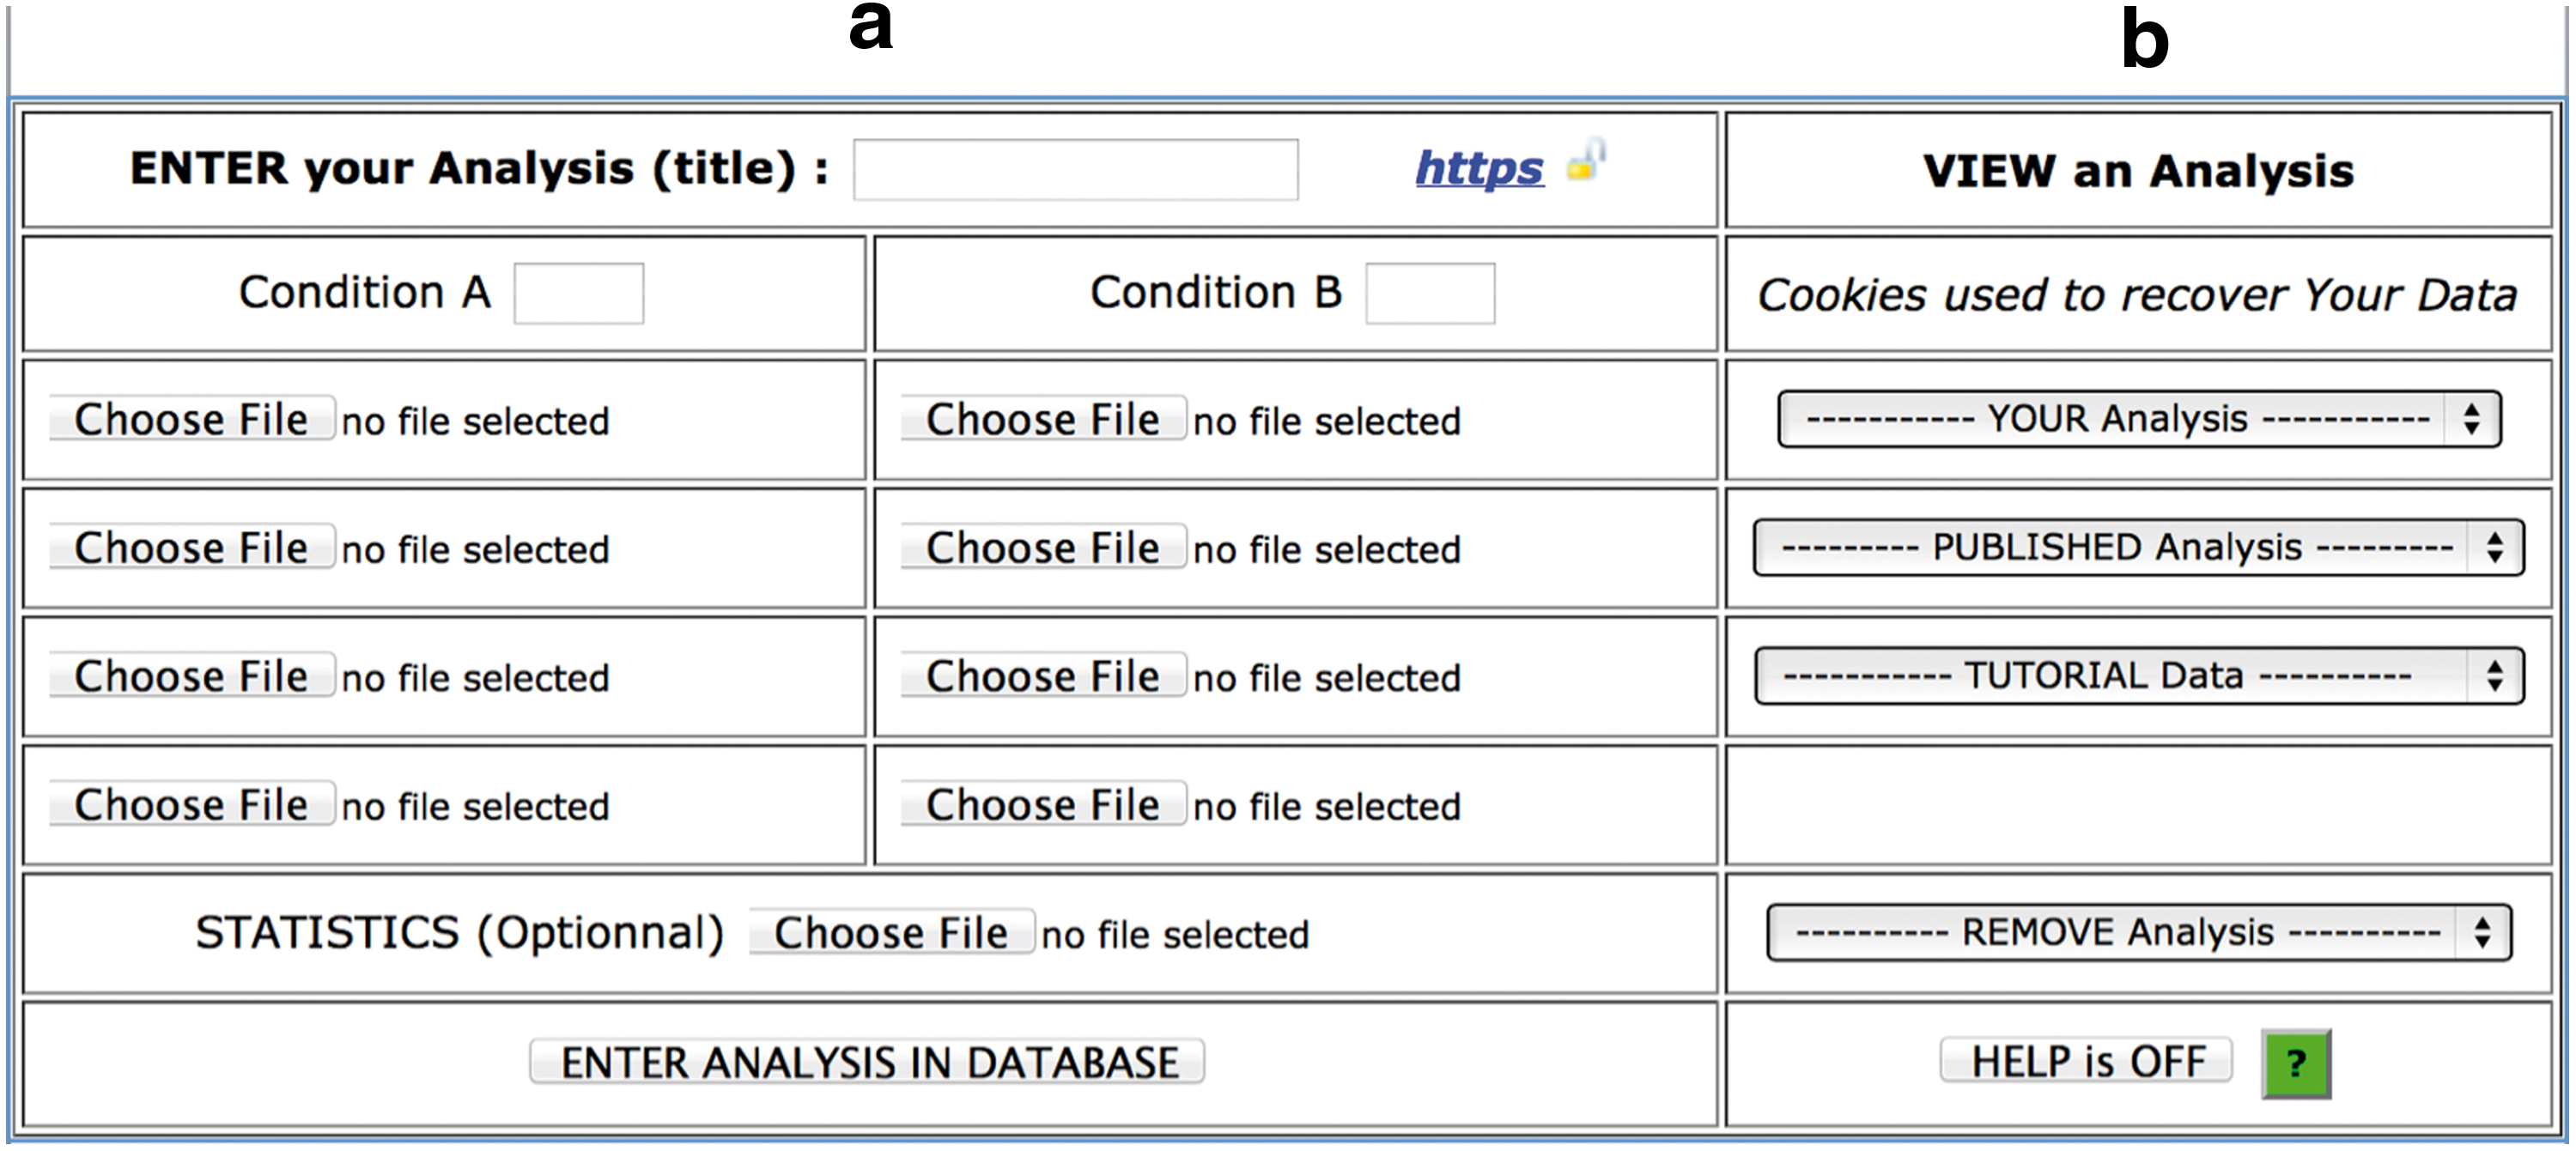
COV2HTML connexion.php web page.
Data visualization
In the «visualization.php» web page, the analyses are described and the coverage value of gene and IGR can be investigated. The different parts of an analysis page example are shown in Figure 3. The search function can be used either with the ID of genetic element or by using a genomic position. The genomic coverage is drawn as a bar chart for each sample, using a compression factor of 5 folds (0 -> 0; 1–5 ->5; 6–10 ->10…) to gain in performance. For TSS experiments, we added green lines that represent the first-base coverage of sequence reads. The coverage values for each replicate, the mean coverage, and conditions ratio are indicated on genetic-element information.

COV2HTML visualization.php web page. We divided the webpage into color boxes to separate each part. [Gray box] Analysis title and strand. [Orange box] Information of Gene or IGR: gene ID or IGR ID; position; strand; type; product; coverage for each replicates; the mean value per condition; the ratio of conditions A/B. [Purple box] Navigation tools. A view pack/full down-drop list to pack replicates into one mean coverage view (two conditions only). ZOOM Y-axis button to change coverage scale from 1–250 to 1–10,000. ZOOM X-axis button to change genomic scale from 1–1300 to 1–6500. Current gene or IGR surround with link to the previous and next one. [Blue box] Genetic elements and their labels. Genes are in blue, rRNA/tRNA are in red, and ncRNA are in gray. [Yellow box] Sample's coverage: analysis condition and replicate genomic coverage views. [Green box] Gene or IGR filters to analyze coverage data. At the top others tools: search for a position or a gene ID; activate help boxes; export all or filtered results in a comma-separated value file (Excel compatible).
The navigation bar contains X and Y zoom buttons, a down-drop list to pack replicates into one mean coverage view (two conditions only), and buttons and links to move through genome by feature or a fixed distance in bp.
Data analysis
The analysis of features and IGR is managed by filters based on their coverage value. In the filter box (Fig. 4), a button permits switching from genes: GENE to intergenic regions: IGR analysis. If a statistical file is integrated, a Statistics button is present and permits to switch on/off the statistical results. In case of a two-condition comparison without statistical file, a standardize button is present to normalize the coverage between conditions. We normalize the mean coverage of each replicate to the mean coverage of all replicates. The deduced replicate correction factor is applied to each genetic-element coverage value (Fig. 5a). To avoid that a small proportion of genes affects the normalization (Bullard et al., 2010), the 5% top covered genes are not used for the calculation. For instance, in RNA-seq bacterial experiments, the rRNA are the main contaminants and high differences of rRNA quantities between samples could be recovered even after depletion of the rRNA (Chen and Duan, 2011). Removal of their values gives a more truthful correction. The strength of this correction is indicated by the color of the button, which is related to the highest correction factor (green<2; pink<5; red>5).
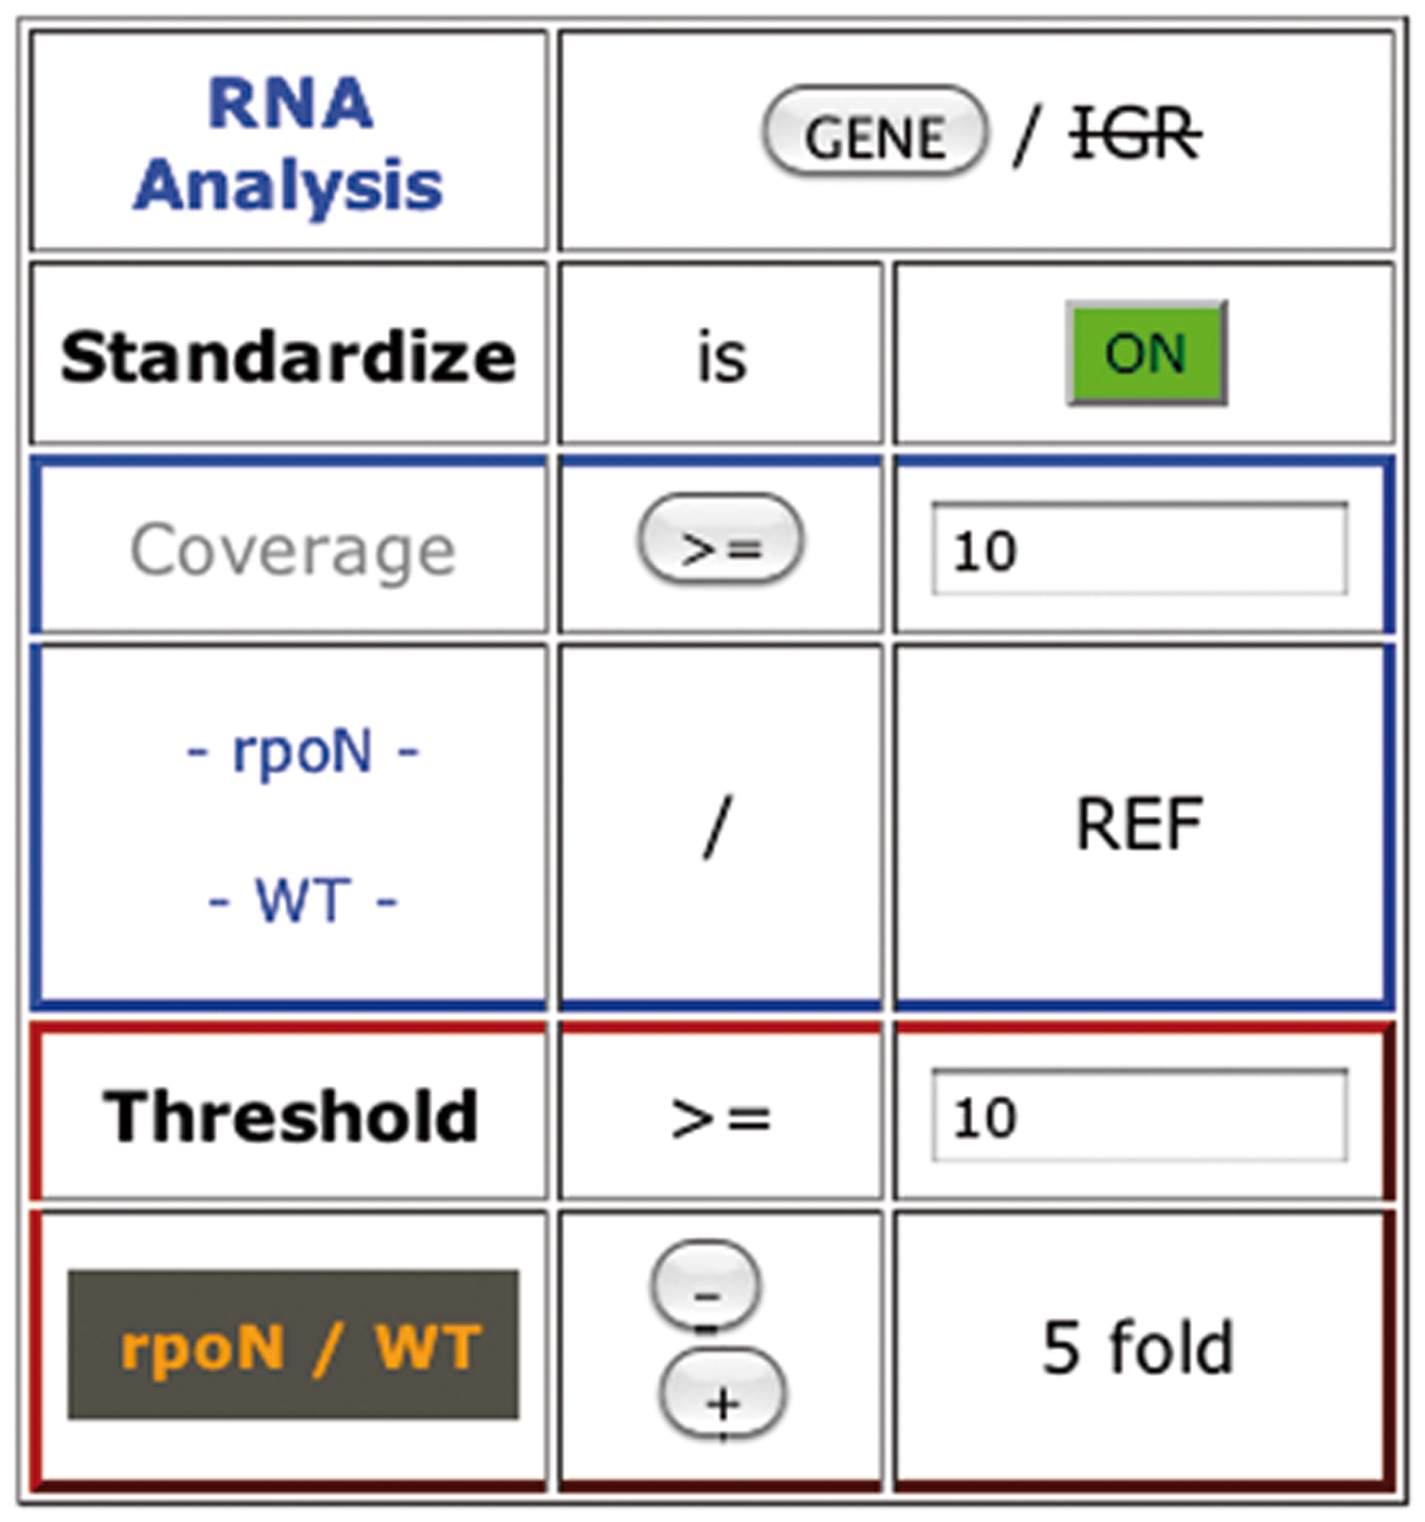
COV2HTML Genetic elements filter box. Example of a two-condition RNA-seq experiment without statistics. From top to bottom: Experiment type selection switch between Genes and IGR analysis; Standardization ON/OFF: Switch button to equilibrate the mean coverage of each sample (Fig. 5a); the blue rectangle represents the one condition panel: Filter genetic elements by their coverage. The red rectangle represents the two condition comparison panels: Filter fold change differences by setting the minimum coverage value assigned to genetic elements before ratio calculation (threshold); Results are displayed below the filter box (Fig. 3). If statistical results are present, ‘Standardization’ is replaced by ‘Statistics’ and ‘threshold’ option disappears.

COV2HTML Filter box options.
The analysis of genetic-elements coverage can be performed in two different ways (Fig. 4). When we compare one experimental condition against the reference genome, the genetic elements are filtered according to their coverage, either lower or upper than a desired value. To compare two conditions, a coverage threshold and a fold change (FC) have to be selected. The threshold represents the minimum coverage value assigned to a genetic element before calculating the ratio. Thus with a gene coverage value of 2 in condition A and 30 in condition B, the real FC is 30/2=15, but it is decreased to 3 when using a threshold of 10 (30/10) (Fig. 5b). This threshold permits limiting the background of the experiment due to low-level coverage value. The threshold modification is not available for statistical results. The fold change (FC) level is customisable by using ‘+’ or ‘−‘ buttons. Finally the filtered genetic elements are displayed in co-localized groups, named as ‘ID of the first element-ID of the last one’, with the number of members indicated in brackets.
Case study: Testing COV2HTML with recently published RNA-seq data
To test COV2HTML, we searched among the NGS publications of the year 2011 for suitable random NGS data. However only few of them published raw or coverage data and gave a clear description of their analysis methods. Finally we chose two studies, one concerning RNA-seq comparison with two conditions and the other one combining transcriptional start site (TSS) analysis and RNA-seq data sets. The first study is a RNA-seq analysis performed in Campylobacter jejuni, which consists of a nonstranded RNA-seq comparison of two conditions with two replicates per condition (Chaudhuri et al., 2011). Because only raw data were available [ENA:ERP000728], we aligned the reads by using Bowtie (Langmead et al., 2009) to get a mapping file in SAM format (Li et al., 2009). Then we used MAP2COV with the C. jejuni genome sequence [GenBank:AL111168] and the mapped file to test COV2HTML for each condition's replicate. A statistical result file was created by using information from Table S3 available in the supplementary results of the publication. The second study contains stranded TSS and RNA-seq data sets on the Archaea Sulfolobus solfataricus recovered from multiple conditions (Wurtzel et al., 2010). The authors provided raw data files for TSS and WIG-like coverage files for RNA-seq [GEO:GSE18630]. For the TSS approach, Bowtie (Langmead et al., 2009) was used to create stranded condition mapping files (+and -) which gather three pooled conditions. Then MAP2COV was launched to convert them into coverage files along with the S. solfataricus genome sequence [GenBank:NC_002754] which will be used to validate COV2HTML. These studies are available in the tutorial part of the website and files can be uploaded from sourceforge (http://cov2html.sourceforge.net/).
COV2HTML interface: A web and a local version
The web interface https://mmonot.eu/COV2HTML/ runs on a PC server (Core I3 at 3,4 Ghz with 16 Gb of RAM and a 2-Tb HDD drive), with Ubuntu Linux using Apache HTTP server to support web services. Data generated by COV2HTML are stored in a MySQL database split into 10 sub-bases. Each sub-base is limited to 100 stored analyses (1000 analyses in total). We set a maximum genome size which can be uploaded at 10 megabases. This website is free and open to any users without login requirement.
A local version of the COV2HTML interface can also be set up by downloading the PHP and SQL source files from http://cov2html.sourceforge.net/, together with a package that contains at least the Apache web server, MySQL, PHP, and phpMyAdmin. We suggest using the XAMPP Apache distribution (http://www.apachefriends.org/en/xampp.html) for performing the local installation in three steps : (i) install the XAMPP version for the operating system; (ii) decompress the COV2HTML_PHP.zip file to copy the resulting COV2HTML folder into the “htdocs” folder of XAMPP; and (iii) launch the XAMPP control panel to start Apache and MySQL, and then in the localhost/xampp/web pag,e go to “phpmyadmin” to import the COV2HTML.sql file decompressed from the COV2HTML_SQL.zip file. Finally, the local version of COV2HTML can be accessed via the “localhost/COV2HTML/” web page with the Internet browser.
COV2HTML web interface: Performance test
We tested performances of the COV2HTML interface both for analysis uploading and visualization by using the Apache JMeter desktop application (http://jmeter.apache.org/). We performed several test plans simulating a succession of steps executed by JMeter during the data handling, integrating multiple criteria: simultaneous users, database load (0, 250, 500, 750, 1000 analyses) and use of secure Internet protocol or not (HTTPS, HTTP). The first test plan built in JMeter simulated 1, 3, 5, or 10 users simultaneously uploading data from the Campylobacter jejuni RNA-seq analysis (Case study 1) through the “connexion.php” web page, and then accessing to the “visualization.php” web page. The second test plan simulated 10, 50, 100, 150, 160, 180, 200, or 250 users simultaneously refreshing the “visualization.php” web page every 5 to 10 seconds. These two test plans were launched 10 and 100 times, respectively, to collect mean response time and standard deviation (Supplementary Table S2 and Supplementary Fig. S1).
Both test plans showed that the mean insertion time depends on the number of simultaneous users and varies from 30 to 90 seconds according to the data tested. The maximum of simultaneous uploadings into the database is reached with 10 users; at this point some users could receive an error message. There is no difference in insertion or visualization time relative to the database load. Since the internet protocol (HTTP and HTTPS) does not influence the swiftness of the connection with our tests, we set the secure protocol as default.
To limit database congestion, user sessions are deleted after 6 months if no analysis insertion or visualization has been done, and the 15 oldest analyses are removed when one sub-base reaches 100 analyses. To keep a good visualization time (<0.5 second), we limited the number of simultaneous connections to 150.
Results
According to biological questions, handling and analyzing NGS experiments require a long treatment process that can be heavy to complete for biologists without strong bioinformatics skills, in particular the aspect of data analysis. First, they have to prepare different biological samples (DNA or RNA) and send them to the sequencing platform that provides sequence reads. Then, sequence reads are sent back to biologists either as a raw data file (i.e., Fastq), when the laboratory has the resources to achieve the alignment on the reference genome, or directly as an alignment file (e.g., in SAM/BAM format). Moreover a statistical file is also sent taking into account the experimental conditions and replicates. This is the point where difficulties for the processing of NGS data begin for the biologists, due to the lack of adapted and easy analytical tools. The aim of this work was to develop a program that makes NGS data analysis simpler and autonomous for biologists.
COV2HTML can be used either directly by NGS platforms providing their own specific coverage files, or by biologists with coverage files converted by MAP2COV. For this last option, the coverage file for each experiment is created with MAP2COV by providing the reference genome information, the alignment file as well as the data type and optional parameters (Fig. 1). The analysis can be then performed in the COV2HTML connexion.php web page (Fig. 2), by filling the title box and by uploading the right coverage files. For each condition a short label can be attached and it is possible to compare two conditions with a maximum of four replicates per condition (Fig. 2a). The statistics results could be also integrated by using a specific formatted file. COV2HTML can also be used to visualize up to eight experiments of diverse type performed on the same genome. Finally, the analysis is saved in the ‘YOUR Analysis’ down-drop list of the «connexion.php» page (Fig. 2b).
Identification of mapping errors
The first step of the visualization permits a quick detection of errors due to the alignment that are not always detectable in the alignment software logs. Once validated, the NGS data can be analyzed according to biological questions. The mapping of sequence reads against a reference genome greatly depends of the filters applied on reads or of the options chosen for the alignment. A frequent error is to retain low complexity reads or trimmed reads whose sequences are not long enough to have a statistically unique match. As a consequence, these sequences create mapping artefacts by matching several times onto the genome. Actually, the read-length limitation depends both on the genome size and on its bases composition. To illustrate this problem, we simulated from a RNA-seq experiment a high proportion of small sequences by filtering the reads with poor-quality ends before alignment against our reference genome (unpublished data set). Then we converted the mapping file with and without the read-length limitation option of MAP2COV. As illustrated in Figure 6, we observed an accumulation of suspect reads without using the limitation (Fig. 6a), which disappeared when the limitation was applied (Fig. 6b). This read-length option is useful for bioinformaticians to check the mapping quality and for biologists, as well to adapt filtering criteria without requiring an expert.
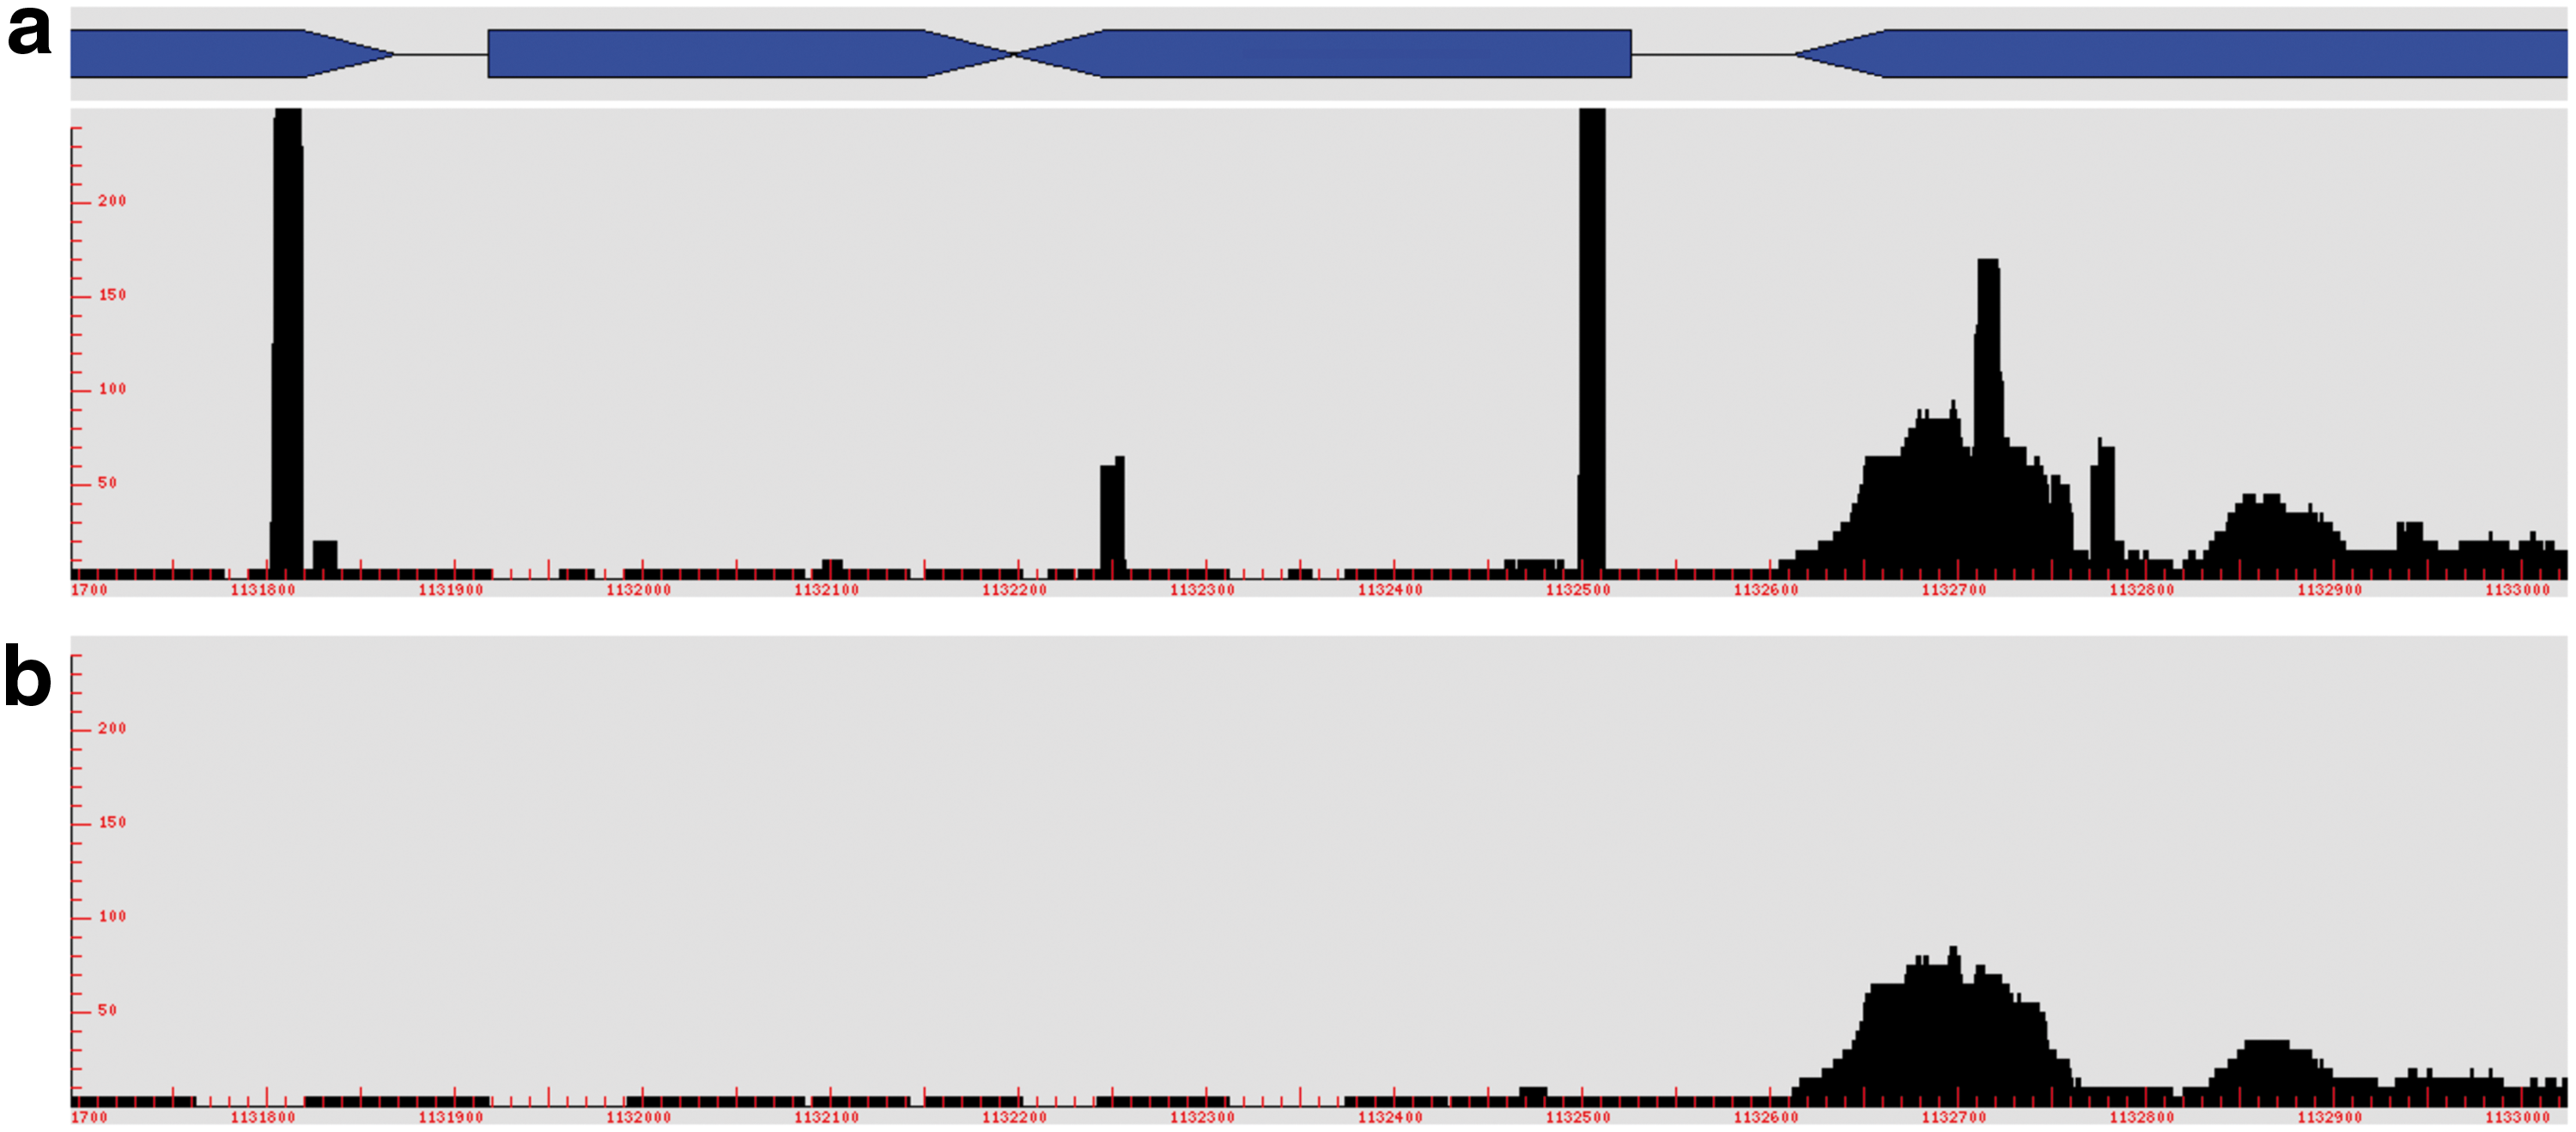
Identification of mapping error. COV2HTML visualization of the same mapping file converted with MAP2COV by using two different read-length option:
Case study 1: Analysis of recently published RNA-seq data by COV2HTML
The aim of the RNA-seq analysis is to determine the impact of the various growth conditions or gene mutations on the transcriptional expression and to identify which genes are differentially expressed. Visualization of the results is critical and can quickly highlight unexpected differences. To validate the relevance of COV2HTML for a RNA-seq analysis, we tested the program with NGS data of a C. jejuni RNA-seq study recently published (Chaudhuri et al., 2011), corresponding to a standard comparison of two experimental conditions (wild-type and mutant strains) with two replicates. This study showed that the expression of 27 genes was significantly altered in the mutant compared to the wild-type strain with a minimal fold change of 5 (Table 2). This analysis was well described, the raw data were available online and we could therefore integrate them in COV2HTML. The statistical results were also entered into COV2HTML. In the publication, the gene-coverage calculation style was the raw counts, whereas MAP2COV was configured to convert data either with the ‘Mean coverage’ or the ‘Raw counts’ styles. To compare with statistical results of the publication, we simulated the C. jejuni RNA-seq analysis according to the author's conditions by setting in COV2HTML the gene filter standardization on “ON” with a minimum fold change difference of 5 (FC<0.20 or FC>5) without coverage value limit (threshold=1). With these criteria, we were able to recover at least 26 out of 27 genes highlighted in the published data whatever the coverage calculation style (Table 2).
Results from Wurtzel et al. publication (Wurtzel et al., 2010) on C. jejuni RNA-seq experiments are compared to COV2HTML analysis. The coverage style, normalization method, threshold, and fold change are indicated for each. Fold change of genes that are not present in COV2HTML analyses are given in bold red surrounded by stars.
Case study 2: Analysis of a recently published TSS experiment by COV2HTML
Transcription start site (TSS) sequencing or 5′-end sequencing experiments are used to identify the exact 5′-end of transcripts. The sequences derived from the 5′-end approach may correspond either to real start of transcripts existing in the native cell or to break points of degraded RNA molecules. In addition to characterize the 5′-start of genes, such data need to be analyzed by visualization tools in order to highlight the transcript sense and noncoding RNA (ncRNA) as well as cis-antisense transcripts. With COV2HTML, the TSS coverage is calculated from the most probable region of a transcriptional start corresponding to the position −250 to +100 bp relative to the translational start points. Afterwards, a manual curation of the putative TSS found can be done using the first-base coverage of sequence reads represented in the coverage view of the sample as green lines (Fig. 7). In order to demonstrate the relevance of COV2HTML for the TSS analysis, we used data of the TSS experiment performed in the Archaea S. solfataricus (Wurtzel et al., 2010). The raw data were also available online and converted by MAP2COV into coverage files and the analysis was simulated through COV2HTML by using only the default coverage filter (coverage>10) without manual curation. The authors found 960 TSS on both strands, which were verified by combining the coverage of TSS experiments along with an incisive examination of the nucleotide composition upstream to these sites. By using COV2HTML, a list of 755 and 817 TSS were detected for strand plus and minus (Supplementary Table S3), respectively, which contains near 80% of the TSS published (Table 3). Thus, even with a simple criteria and without further manual analysis, COV2HTML was able to highlight most of the TSS results of this article.

COV2HTML combine analysis. Three coverage profiles from two experiments done with the same reference genome, RNA-seq and TSS, were mixed in one view:
In the publication, TSS considered by an accumulation of more than 10 reads. For COV2HTML, the filter used was «coverage>10».
Case study 3: Combined analysis of RNA-seq and TSS data by COV2HTML
The visualization of multiple RNA-based NGS analyses can offer the possibility to detect new transcript genes or the presence of ncRNAs and cis-antisense transcripts that could be responsible of transcriptional regulation. A single-nucleotide resolution map of the transcriptome of S. solfataricus was recently generated (Wurtzel et al., 2010), by combining two independent transcriptome sequencing approaches: a whole-transcript sequencing (RNA-seq) and a 5′-end sequencing (TSS). Both converted files were entered into COV2HTML in the following order: TSS+(strand plus), RNA-seq (nonstranded), and TSS - (strand minus). This order was chosen to visualize (i) the transcript sense and the corresponding TSS; (ii) the putative novel transcripted-protein coding genes, and (iii) the noncoding RNA (ncRNA), or cis-antisense transcripts. As an example, three transcriptional starts and the expression of two genes are illustrated in Figure 7. The RNA-seq coverage (Fig. 7b) indicated that two genes were expressed, SSO0048 and a new transcript. In the TSS strand plus (Fig. 7a), the 5′-ends of gene SSO0048 and SSO0049 are shown in black pillars bordered by a green line. The same profile was observed in the TSS strand minus (Fig. 7c) for the new transcript but with multiple right green lines. By changing the Y-scale to view high coverage (1–2500), two main green lines are found that could correspond to (i) the 5′-end of the gene already annotated (SSO0047) with a post-transcriptional maturation or (ii) the 5′-end of a new transcript identified by the RNA-seq coverage. In addition in the same study (Wurtzel et al., 2010), a proteomic analysis was performed and confirmed that this new transcript encodes a protein. The visualization tools given with this publication (Wurtzel et al., 2010), combining in one graphic all the results, are remarkable but not easily accessible for the biologists without bioinformatics skills. COV2HTML allows biologists to combine and visualize their raw data and data from publications prior to access sophisticated analysis tools.
COV2HTML security
The security of the COV2HTML website https://mmonot.eu/COV2HTML/ is enhanced by default using a HyperText Transfer Protocol Secure (HTTPS). It provides authentication of the website by authoritatively signed certificates (Go Daddy Secure Certification Authority) and bidirectional encryption of communications between client and server. As the encryption could delay the website, we add the possibility to switch between HTTP and HTTPS protocols (lock image next to the analysis title in the “connexion.php” page).
The security of the analysis is managed by a cookie coded inside the web browser with a combination of the date and a unique identifier from the database. In the case of computer sharing, the analysis can be erased manually or by removing cookie information at the end of their session. Furthermore, coverage files do not contain any sequence or information regarding the experimental conditions and it is possible to anonymize gene information by using the appropriate option in MAP2COV.
Discussion
COV2HTML provides an easy and ‘in home’ web interface for biologists, allowing coverage visualization of the NGS alignment needed for the analysis. It combines two essential processes: (i) MAP2COV, a tool that converts the huge NGS mapping or coverage files into light specific coverage files containing genetic-elements information (Table 1); and (ii) an online coverage viewer allowing a real-time analysis of data using statistical results if available with selected criteria. This interface offers a visualization of NGS mapping coverage data (DNA-, RNA-, ChIP-seq, and TSS), performed with prokaryotic organisms (bacteria, phages) under different experimental conditions (such as mutant versus wild-type strains or cells in different growth states), which facilitates studies.
Mapping file contains read information. Coverage file contains the genomic coverage. MAP2COV file contains the genomic and genetic-elements coverage and their annotation.
Several NGS visualization tools are available online, such as Integrative Genomics Viewer (IGV) (Robinson et al., 2011), Generic Genome Browser (GBrowse) (Stein et al., 2002), Javascript-based genome browser (JBrowse) (Skinner et al., 2009), and BamView (Carver et al., 2012). These interfaces are high-performance visualization tools for interactive exploration of large integrated genomic datasets. Although many features overlap with these interfaces (Table 4), COV2HTML offers facilities for the biologist users as follows. First, a complex installation procedure is mandatory for GBrowse or JBrowse (server) but IGV, BamView, and COV2HTML are given directly as a graphical interface. IGV and BamView are written in Java, making them portable between platforms in theory, whereas a web browser is sufficient for JBrowse (client) or the COV2HTML visualization interface. Second, the NGS results can be sent in many formats to biologists. If IGV, GBrowse, and JBrowse support a wide variety of NGS format, BamView has been developed to visualize exclusively indexed ‘BAM’ files. For COV2HTML, it will use its own coverage format thanks to the converter provided, MAP2COV, which supports files that are commonly attached to publications. Third, the visualization of all gene coverage is crucial for the analysis. Actually, the automatic zoom of IGV, GBrowse, and BamView can be a problem to visualize weakly-covered gene, and particularly those, which are next to a strongly-covered gene. In JBrowse, zooming in and out can be done without communicating with the server making them faster and more fluid than in GBrowse. In COV2HTML, zoom on both axes (X, Y) are usable for the data coverage visualization. This option allows users to see different expression levels without being overwritten by an automatic zoom. Finally, the analysis of genes or IGR coverage is not present in IGV, GBrowse, and JBrowse. BamView can normalize data with the read per kilobase per million of mapped reads (RPKM) (Mortazavi et al., 2008), and write an output file that can be used for further statistical analysis. In COV2HTML, the interpretation of aligned reads is screened out by using filters on genes or IGR with or without integrated statistical results. COV2HTML offers users to change analysis criteria in real-time, depending on the results visualization.
Software utilization, data visualization, and data handling compared in COV2THML, GBrowse, JBrowse, IGV and Bamview.
If optional statistical result file is provided; **optional plug in could be implemented.
Availability and requirements
Project name: COV2HTML
Project home page: http://cov2html.sourceforge.net/
Operating system(s): Platform independent
Programming language: COV2HTML: PHP, MAP2COV: Python
Other requirements: COV2HTML: up-to-date internet browser (Supplementary Table S1). MAP2COV: Python 2.6 or 2.7 including Tcl/Tk.
License: General Public License version 3.0 (GPL3.0)
Any restrictions to use by nonacademics: No
Conclusions
As more and more NGS data become accessible online, scientists are attracted to exploit diverse experimental results. However this often requires bioinformatics skills, which may prevent them from undertaking such studies. Thus, COV2HTML has been designed as an easy and accessible interface to simplify analysis of NGS data recovered from laboratory experiments or from databases. Furthermore information sharing is enhanced by a new tiny coverage format. At the time of publication, the sourceforge project recorded 218 downloads from 25 countries. An overview of the current server charge is accessible at https://mmonot.eu/COV2HTML/statistics.php/.
To date, a local version of COV2HTML has run for 2 years, in collaboration with biologists of 8 groups inside and outside of our laboratory. So far, 21 RNA-seq and 2 TSS experiments have already been processed by using COV2HTML and two analyses are already published and viewable in the ‘PUBLISHED Analysis’ down-drop list of the «connexion.php» page.
Footnotes
Acknowledgments
We would like to thank Corinne Levi-Meyrueis, Françoise Norel-Bozouklian, and Thomas Dubois, which have tested COV2HTML. We thank Dr. Thierry Garnier for suggestions and comments of the manuscript. This work was supported by Institut Pasteur and Grant ERA-PTG/SAU/0002/2008 (ERA-NET PathoGenoMics) for Bruno Dupuy and Marc Monot.
Author contributions; MM and CB wrote the COV2HTML code. MO and MM wrote the MAP2COV code. EC tested the software. MM, EC and BD wrote the manuscript, all authors have contributed to it and have read and accepted the final version.
Author Disclosure Statement
The authors declare that there are no conflicting financial interests.
References
Supplementary Material
Please find the following supplemental material available below.
For Open Access articles published under a Creative Commons License, all supplemental material carries the same license as the article it is associated with.
For non-Open Access articles published, all supplemental material carries a non-exclusive license, and permission requests for re-use of supplemental material or any part of supplemental material shall be sent directly to the copyright owner as specified in the copyright notice associated with the article.
