
Abstract
Abstract
The aim of this study was to characterize the composition of follicular fluid (FF) collected from the small and large follicles of three mammalian species, Bos taurus, Sus scrofa domesticus, and Equus ferus caballus, that display distinct ovulatory properties. For each species, five large FF samples and five small FF samples were analyzed using 1H-NMR spectroscopy. The FF metabolic profiles of the three species were very distinct. In cows and mares, the metabolic profiles of large FF and small FF were also very distinct. The concentrations of seventeen identified metabolites differed significantly between the sample groups. In mares, fourteen metabolites were found at much greater concentrations in large FF than in small FF (p<0.05). In cows, four metabolites differed in concentration between the large FF and small FF samples (p<0.05). A common feature of the monovulatory species was that the concentrations of α- and β-glucose were much greater in large FF compared with small FF (p<0.05). Sow FF was characterized by the apparent absence of citrate (detected in cow and mare FF), and the presence of succinate (not detected in cow and mare FF). Another obvious difference between species was the concentration of lactate, which was minimal in mare FF compared with cow and sow FF (p<0.05). The findings provide valuable insights into reproductive physiology broadly, and indicate that the activities of central metabolic enzymes differ enormously between these species. Future investigations into species-specific differences in follicle metabolism would increase our understanding of the processes critical to folliculogenesis and the acquisition of oocyte developmental competence.
Introduction
I
Within the mammalian ovary, follicular fluid provides the in vivo extracellular environment of the oocyte. It accumulates to form the ovarian follicular antrum, and is in part an exudate of serum, as the “blood–follicle barrier” is permeable for proteins below 500 kDa (Gosden et al., 1988). Follicular fluid is also composed of locally produced substances that are related to the metabolic activity of ovarian cells (e.g., steroids, growth factors, and other peptidergic factors) throughout follicle growth and development (Fortune et al., 2004). Thus, the composition of follicular fluid reflects the physiological status of the ovarian follicle, and its characterization is of major interest to better understand ovarian follicular development and the acquisition of oocyte quality (Revelli et al., 2009).
Numerous studies have examined the levels of specific hormones and growth factors in follicular fluid, and the amino acid constituents have been identified using HPLC techniques in humans (Jozwik et al., 2006) and animals (Orsi et al., 2005). Also, the ionic composition of follicular fluid (Leroy et al., 2004; Nandi et al., 2007; Sutton et al., 2003) and the presence of glucose, lactate, urea, and lipids has also been determined (Orsi et al., 2005). Nonetheless, only a few studies have described the changes in follicular fluid composition that occur during the ovarian cycle (Gérard et al., 2002). Considering the physiological events taking place as a follicle prepares to ovulate a mature oocyte, we can hypothesize that the biochemical changes in the corresponding follicular fluid are most probably critical for the required events to proceed.
Using the 1H-NMR spectroscopy metabolomic approach, over 200 compounds can be targeted and quantified in biofluids (Bouatra et al., 2013; Wishart et al., 2008). This technique, which has been used to elucidate both endogenous and drug-related metabolites, has proved to be an effective method for monitoring disease states and has been used to study the metabolism and toxicity of pharmacologically active agents (Gavaghan et al., 2001). In biochemical research, urine and plasma are the most widely used samples (Barton et al., 2008; Coen et al., 2008; Holmes et al., 2008). Moreover, there is increasing research on pregnancy focusing on metabolomics, including studies based on maternal serum/plasma (Kenny et al., 2008, 2010), embryonic culture medium ( Nadal-Desbarats et al., 2013; Seli et al., 2007, 2008), amniotic fluid (Graca et al., 2008), oocytes (Pinero-Sagredo, et al. 2010, Romero et al., 2010), and placental tissue (Heazell et al., 2008, 2011). The metabolomic profiles that are obtained by NMR analysis can act as fingerprints of a biological fluid at a specific time, state, or stage within a tissue or an organism. Consequently, 1H-NMR spectroscopy was used in the present study to characterize the metabolic profiles of cow, sow, and mare follicular fluid, in relation to the physiological stage of folliculogenesis.
Materials and Methods
Collection and preparation of samples
Porcine and bovine ovaries were collected at a local slaughterhouse and transported to the laboratory in saline at 34°–38°C. As the samples were obtained from a slaughterhouse, no ethics approval was required. Follicular fluid samples were obtained by puncturing follicles with a 20G needle and aspirating the contents into collection tubes. Varying volumes of fluid were collected for each follicle size and species. To obtain sufficient sample (500 μL) to perform 1H-NMR analysis, it was necessary to pool the fluids from multiple follicles for some of the sample groups. For porcine, the fluids from the 2–3 largest follicles (3–5 mm in diameter; 200–250 μL/follicle) of the same ovary were pooled in one tube, and the fluids from the smaller subordinate follicles (1–3 mm in diameter; 0.5–15 μL/follicle) were pooled in a separate tube. For bovine, the fluid from the largest dominant follicle (15–25 mm in diameter; >500 μL/follicle) was collected individually in one tube, and the fluids from the smaller subordinate follicles (1–5 mm in diameter; 0.5–65 μL/follicle) were pooled in a separate tube. Equine follicular fluid was collected by ultrasound-guided transvaginal aspiration when the largest follicle was determined to be 33 mm in diameter, as previously described (Duchamp et al., 1987). For each ovary pair, the largest dominant follicle (>33 mm in diameter; >500 μL/follicle) and a smaller subordinate follicle (8–18 mm in diameter; >500 μL/follicle) were punctured individually and the fluids were collected in separate tubes. After collection, the follicular fluid samples were centrifuged for 10 min at 3000 g and stored at −80°C until further processing. Only follicular fluid samples free from blood contamination were kept for further analysis. All procedures used for mare follicular fluid collections were approved by the French agricultural and veterinary agencies (approval number C37-175-2/37-035) and conducted in accordance with the guidelines for care and use of agricultural animals in agricultural research and teaching.
Sample preparation
The follicular fluid samples were thawed at room temperature, and centrifuged at 3000 g for 5 min. Five hundred μL of supernatant was added to 100 μL of deuterium oxide solution before being transferred to a 5 mm NMR tube (CortecNet, Paris, France) for 1H-NMR analysis.
Magnetic resonance spectroscopy
As previously described (Bertoldo et al., 2013), the 1H-NMR spectra were performed on a Bruker DRX-500 spectrometer (Bruker SADIS, Wissembourg, France), operating at 11.7 T, with a Broad Band Inverse (BBI) probe head equipped with a Z gradient coil. Conventional 1H-NMR spectra were recorded at 298 K with 90° pulse with residual water presaturation (single-frequency irradiation during the relaxation delay). 1H spectra were collected with 64 transients (and 8 dummy scans) in 32 K data points with a spectral width of 7500 Hz, and a recycling time of 5 sec. Carr-Purcell-Meiboom-Gill (CPMG) spin echo spectra were carried out with 80 ms total echo times and 32 K data points. This spin echo sequence avoided broad short T2 resonance. Sample shimming was performed automatically on the water signal. Spectra were processed using WinNMR version 3.5 software (Bruker Daltonik, Karlsruhe, Germany). All spectra were corrected for phase distortion and the baseline was manually corrected for each spectrum. Each spectrum was integrated using the WinNMR software integral function. To quantify, the Electronic REference To In vivo Concentrations (ERETIC) signal (Barantin et al., 1997) was used. Spectral 1H assignments were achieved according to the literature values of chemical shifts in various media and biofluids (Gerard et al., 2002; Maillet et al., 1998; Nicholson et al., 1995; Pinero-Sagredo et al., 2010; Wishart et al., 2008) and the Human Metabolome Data Base (HMDB) (Wishart et al., 2007).
Data analysis
A supervised method, partial least-squares discriminant analysis (PLS-DA), was performed with SIMCA P+ software (version 12.0, Umetrics, Umea, Sweden). Data were scaled using unit variance (UV) scaling prior to PLS-DA. PLS-DA is a multivariate projection method that provides a plot of variance importance, which presents the most important variables of the separation useful in classifying samples according to their common spectral characteristics. PLS-DA takes advantage of class information to attempt to maximize the separation between groups of observations. The overall quality of the models was judged by the cumulative R2, and the predictive ability by cumulative Q2. R2 is defined as the proportion of variance in the data explained by the model and indicates goodness of fit. Q2 is defined as the proportion of variance in the data predictable by the model and indicates predictability. The model was so considered well-guarded against overfitting and validated after a 200 random permutation test as Q2 line intercepted the Y axis at a negative value (Westerhuis et al., 2008).
Statistical analysis
As previously described (Bertoldo et al., 2013), a linear mixed model was fitted to the data using the statistical software package GenStat 14th edition (VSN International, Ltd., Hemel Hempstead, UK). For each metabolite, the treatment effects “follicle type” and “species” were assessed for significance (p<0.05), as was treatment interaction. The term “sample”, which specified individual samples, was included as a random term. Residual plots were examined to confirm model assumptions. When a treatment interaction was detected, approximate Least Significant Differences (LSDs) were used to compare pairs of treatment means.
Results
1H-NMR metabolic profiles of follicular fluid
For each species, 1H-NMR spectra were obtained for five samples of large follicular fluid (large FF), and five samples of small follicular fluid (small FF). A representative 1H-NMR spectrum of a follicular fluid sample collected from a mare is shown in Figure 1. Given that follicular fluid is a complex biological fluid, numerous aliphatic structures were identified. The spectra were dominated by a number of metabolites, including amino acids (alanine, valine, histidine, tyrosine, and phenylalanine), creatine-creatinine, organic acids (lactate, citrate, succinate, acetate, and formate), carbohydrates (glucose), trimethylamine groups (-N(CH3)3 as choline, phosphocholine, glycerophosphocholine), N-acetyl groups, and methyl moieties of lipid chains.
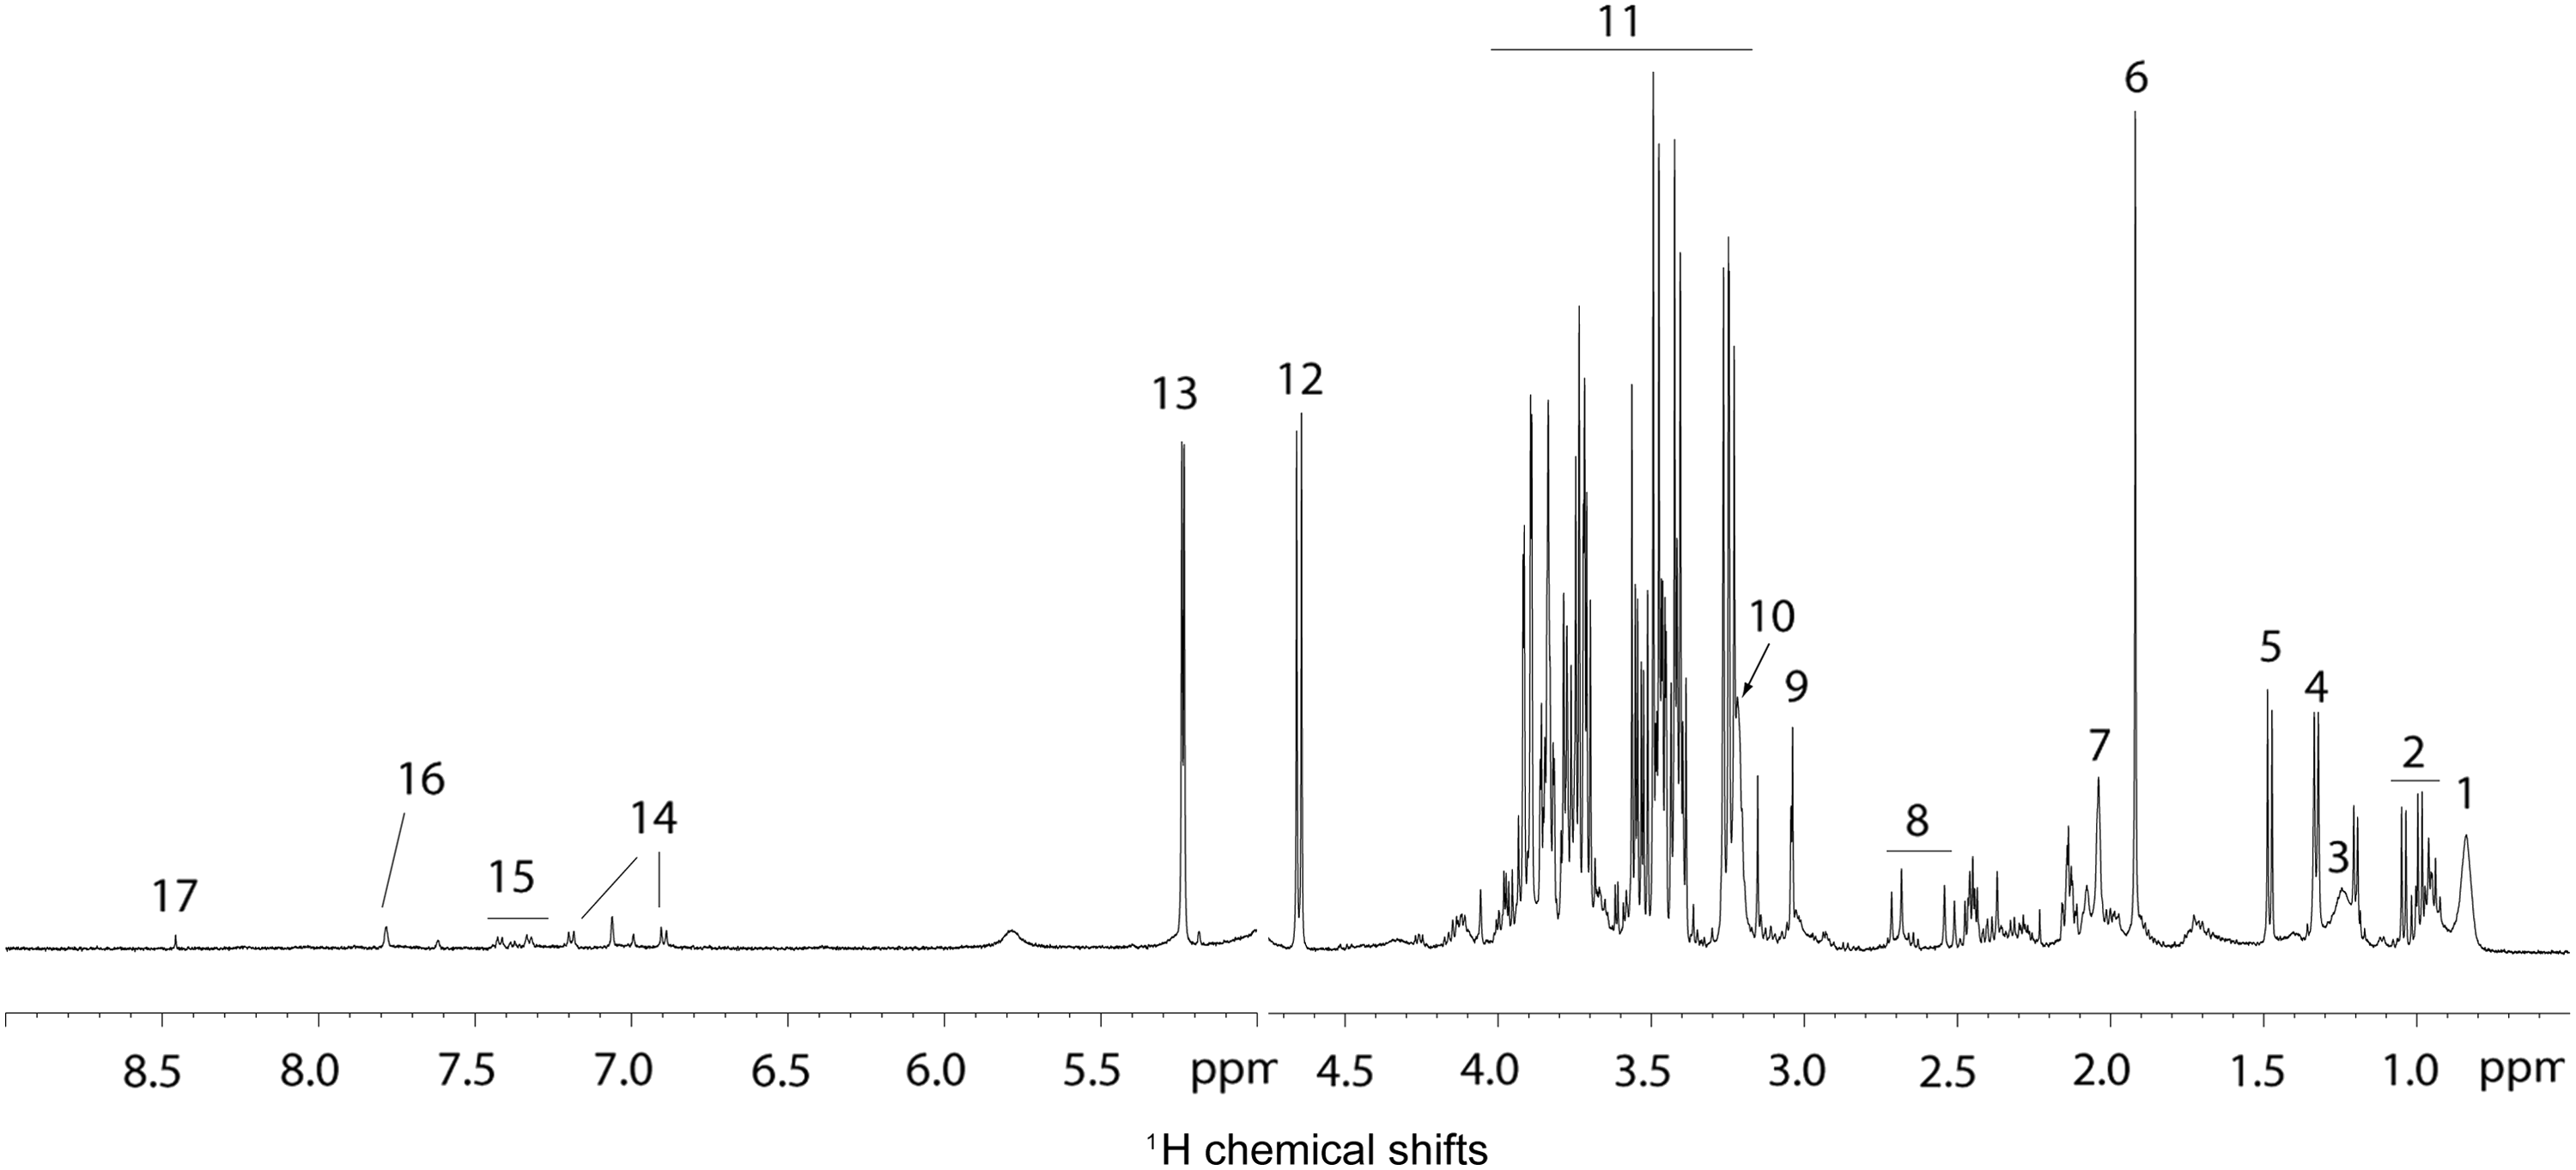
A representative T2 filtered (CPMG) 1H-NMR spectrum of equine follicular fluid. (1) CH3 lipid moieties, (2) valine, leucine, Isoleucine, (3) CH2 lipid moieties, (4) lactate, (5) alanine, (6) acetate, (7) N-acetyl groups, (8) citrate, (9) creatine-creatinine, (10) N(CH3)3 groups, (11) glucose, (12) β-glucose, (13) α-glucose, (14) tyrosine, (15) phenylalanine, (16) histidine, and (17) formate.
Partial least-squares discriminant analysis (PLS-DA) revealed clear separation between the three species for large follicular fluid (Fig. 2A), with a goodness of fit of R2X=0.93 and R2Y=0.96, and a predictability of the model of Q2=0.83. The corresponding loading plot allowed identification of the metabolites responsible for the separation between the three species. Similarly, PLS-DA revealed clear separation between the three species for small follicular fluid (Fig. 2B), with a goodness of fit of R2X=0.97 and R2Y=0.98, and a predictability of the model of Q2=0.89. The corresponding loading plot allowed identification of the metabolites responsible for the separation between the three species. The PLS-DA scores scatter plot containing all the data from the three species and the two follicle types, is shown in Figure 2C. Well separated clusters for the three species were again revealed, with a goodness of fit of R2X=0.94 and R2Y=0.93, and a predictability of the model of Q2=0.89. In addition, within the cow and mare clusters, distinct follicle type subclusters were observed (Fig. 2C), (Supplementary Fig. SF1).

PLS-DA scores scatter plots obtained from the analysis of 1H-NMR spectra of large (dot) and small (triangle) follicular fluid from cows (blue), sows (green), and mares (red). There was clear separation of the principal components between the species, as indicated by the circles, for large (
Effects of follicle type and species on the concentrations of individual metabolites
Due to the clear differences in follicular fluid metabolite profiles between the species, and between the follicle types in cows and mares, it is not surprising that significant species and follicle type interactions were observed for nearly all the metabolites identified.
The concentrations of α-glucose and β-glucose were about 2-fold greater in the large follicular fluid (large FF) of mares compared with those in the large FF of cows, which in turn were about 3-fold greater compared with those in the large FF of sows (Fig. 3). In both cows and mares, the concentrations of α-glucose and β-glucose in the small follicular fluid (small FF) were much lower than those in large FF (p<0.05). Glucose levels in small FF were similar among the three species, and did not differ significantly from the levels in the large FF of sows.

Concentrations (mean±S.E.M.) of α-glucose and β-glucose in follicular fluid collected from small/subordinate follicles (light gray bars) and large/dominant follicles (black bars) in cows, mares, and sows. Bars with different letters differ significantly (p<0.05).
The concentrations of the organic acids acetate, citrate, cis-aconitate, formate, and lactate are shown in Figure 4. The concentration of acetate in the large FF of mares was 4- to 5-fold greater than that in the small FF and large FF of cows and sows, and about 13-fold greater than that in the small FF of mares. In contrast, acetate levels did not differ between the follicle types in cows and sows. A similar pattern, although less pronounced, was observed for the concentrations of cis-aconitate. The concentration of citrate was also greatest in the large FF of mares, which was about 2-fold greater than that in the small FF and large FF of cows, and about 7-fold greater than that in the small FF of mares. Citrate was not detected in any of the sow FF samples. Conversely, succinate was detected in sow FF (0.38±0.02 mM), but not in cow FF or mare FF (Supplementary Fig. SF2). The formate levels in small FF and large FF differed significantly in mares (0.011±0.005 mM vs. 0.039±0.006 mM; p<0.05), but not in cows and sows. Conversely, the lactate levels in small FF and large FF differed in cows (12.0±1.1 mM vs. 6.2±0.6 mM; p<0.05), but not in mares and sows. The mean concentration of lactate in mare FF (0.70±0.18 mM) was significantly lower than that in cow FF (9.11±1.14 mM) and sow FF (15.3±1.1 mM).

Concentrations (mean±S.E.M.) of organic acids identified in follicular fluid collected from small/subordinate follicles (light gray bars) and large/dominant follicles (black bars) in cows, mares, and sows. Bars with different letters differ significantly (p<0.05).
The concentrations of the amino acids alanine, histidine, phenylalanine, tyrosine, and valine are shown in Figure 5. In mares, the concentrations of alanine, histidine, tyrosine, and valine were all at least 4-fold greater in large FF compared with small FF (p<0.05). In cows, tyrosine was the only amino acid that differed significantly in concentration between small FF (0.126±0.018 mM) and large FF (0.049±0.006 mM). In sows, none of the amino acids differed in concentration between small FF and large FF (p>0.05). Phenylalanine was the only metabolite that differed in concentration due to species alone (i.e., there was no interaction of species and follicle type). The mean concentration of phenylalanine in sow FF (0.131±0.006 mM) was significantly greater than that in cow FF (0.093±0.015 mM) and mare FF (0.067±0.011 mM).

Concentrations (mean±S.E.M.) of amino acids identified in follicular fluid collected from small/subordinate follicles (light gray bars) and large/dominant follicles (black bars) in cows, mares, and sows. The follicle groups are combined (dark gray bars) for phenylalanine because there was no interaction of follicle group and species. Bars with different letters differ significantly (p<0.05).
The concentrations of creatine-creatinine, methyl groups, N-acetyl groups, and trimethylamine are shown in Figure 6. In mares, the concentrations of these metabolites were all at least 5-fold greater in large FF compared with small FF (p<0.05). In cows and sows, these metabolites did not differ in concentration between small FF and large FF (p>0.05).

Concentrations (mean±S.E.M.) of metabolites identified in follicular fluid collected from small/subordinate follicles (light gray bars) and large/dominant follicles (black bars) in cows, mares, and sows. Bars with different letters differ significantly (p<0.05).
Discussion
Using high resolution proton nuclear magnetic resonance (1H-NMR) spectroscopy to identify and quantify the metabolites in follicular fluid (FF), the results of this comparative study reveal several insights into bovine, equine, and porcine follicle metabolism. The findings demonstrate distinct ovarian metabolic activity, which may be attributed to species-specific regulatory mechanisms of ovarian function, including follicular selection, growth and atresia, and ovulation. Numerous follicle size differences in metabolite concentrations were observed in cows and mares, but the variations were not significant in sows, suggesting the involvement of disparate mechanisms, at least in part, within each species.
A total of fourteen of the identified metabolites changed significantly in concentration in mare FF, with the levels of all of these metabolites being greater in the fluid from dominant follicles compared with the fluid from subordinate follicles. A previous analysis of mare FF composition found relatively small, yet significant changes in a number of metabolites (acetate, alanine, methyl groups, sugar chains, and trimethylamine) as the dominant follicle developed from the early dominant to the preovulatory stage (Gérard et al., 2002). The results of the present study extend these previous findings by showing that the FF composition of subordinate follicles differs enormously to that of follicles at the late dominant stage. For all the metabolites found to differ in mare FF, the increase in their concentration in large FF, as a proportion of their concentration in small FF, ranged from 250% to 1200%. This suggests that the metabolic activity of the granulosa cells within subordinate follicles is much lower than that of the granulosa cells within dominant follicles. Alternatively, the differences may be due to a change in the permeability of the blood–follicle barrier or, given the large difference in follicle diameter, a difference in the relative numbers of granulosa cells per unit volume of FF.
In both cows and mares, the concentrations of α- and β-glucose were much greater in large FF than in small FF. Apart from this glucose change, the variation in metabolite concentrations differed completely between cows and mares. Only two other metabolites differed in concentration between the FF groups in cows. The amino acid tyrosine differed in concentration between the cow FF groups in a way that was precisely opposite to that observed in mare FF. Also, the level of lactate in large FF was about half that in small FF in cows; conversely, the level of lactate in mare FF was much lower and did not differ between the follicle groups. It should be noted that the observed changes in lactate and glucose concentrations in cow FF were highly consistent with the changes reported by Leroy et al. (2004).
Surprisingly, no significant metabolite concentration differences were found between the small FF and large FF samples in sows. Consequently, in large follicles, the concentrations of α- and β-glucose, alanine, phenylalanine, lactate, creatine-creatinine, and N-acetyl groups differed significantly in sows, compared with those in cows and mares. Clearly, follicle development progresses quite differently in pigs, a polyovular species, compared with monovular species. While mares have a single preovulatory follicle that reaches an average diameter of 40 mm (Aurich, 2011), and cows have a single preovulatory follicle that ranges in diameter from 12 to 20 mm (Kanitz, 2003), domestic sows have as many as 30 preovulatory follicles on both ovaries, each with a diameter of about 8 mm (Soede et al., 2011). Therefore, one would expect the FF changes taking place as the follicles of sows increase in size to be more subtle than those occurring as the follicles of cows and mares attain dominance. Recently, Bertoldo et al. (2013) reported an effect of follicle size on the metabolic profiles of sow FF and found differences in the concentrations of numerous metabolites that were also identified using 1H-NMR spectroscopy. Despite the fact no significant differences were detected in the present study between the small FF and large FF samples in sows, the concentrations and relative variations of seven metabolites (acetate, alanine, glucose, lactate, phenylalanine, N-acetyl groups, and succinate) corresponded very closely with those for the same seven metabolites reported by Bertoldo et al. (2013). A possible explanation for the disparate findings in sows is that the diameters of the follicles aspirated differed slightly between the studies (small: 1–3 mm vs. 3–4 mm; large: 3–5 mm vs. 5–8 mm). Also, in the present study, the number of samples analysed (small FF: n=5; large FF: n=5), was less than that in the Bertoldo et al. (2013) study (small FF: n=17; large FF: n=30). The smaller sample size may not have allowed statistically significant differences to be detected between the FF groups in sows; however, this sample size was sufficient to detect the numerous metabolite concentration differences between the FF groups in cows and mares.
It is well known that the developmental potential of oocytes is related to the size of the follicle from which they are collected. Numerous studies have shown that oocytes collected from large dominant follicles have a greater developmental potential than oocytes collected from small subordinate follicles (Bagg et al., 2007; Crozet et al., 1995; Grupen et al., 2007; Iwata et al., 2004; Kauffold et al., 2005; Lequarre et al., 2005; Marchal et al., 2002). Therefore, in the present study, the metabolite changes associated with follicle size may indicate specific metabolic pathways involved in the acquisition of oocyte developmental competence. Alternatively, the metabolite differences may signify metabolic deficiencies that relate to the reduced oocyte quality in small subordinate follicles.
Many of the metabolites found to differ in concentration between small FF and large FF can be linked to the tricarboxylic acid (TCA) cycle, a major energy generating pathway of cells that also provides precursors and co-factors for other cellular processes. Acetate, in the form of acetyl coenzyme A, is consumed by the TCA cycle, citrate and cis-aconitate are TCA cycle intermediates, and alanine, histidine, tyrosine, and valine can all be derived from TCA cycle intermediates. Of particular note is the fact that the concentrations of α- and β-glucose were greater in large FF than in small FF. Glucose is metabolised by cumulus-oocyte complexes via the glycolytic pathway to provide pyruvate for energy generation (Sutton-McDowall et al., 2010).
Glucose can also be utilized by the pentose phosphate pathway to regulate oocyte nuclear maturation and redox state and by the hexosamine biosynthesis pathway to provide substrates required for processes such as cumulus expansion and cell signalling (Sutton-McDowall et al., 2010). Lactate dehydrogenase catalyses the conversion of pyruvate to lactate, which in cows was at a reduced level in large FF compared with small FF. The finding that glucose levels increased and lactate levels decreased as follicle size increased is consistent with previous findings in cattle (Landau et al., 2000; Leroy et al., 2004), sheep (Ying et al., 2011), buffalo (Nandi et al., 2008), and pigs (Bertoldo et al., 2013). These results support the proposal that there is a distinct shift in carbohydrate metabolism as follicle development progresses and dominance is attained. Conversely, we found lactate secretion to be unaltered during mare follicle development.
Our analysis of FF revealed that the presence of citrate and succinate was species-specific, regardless of follicle size. Citrate was not detected in porcine FF, but was present in bovine and equine FF. In contrast, succinate was only detected in porcine FF, but not in bovine and equine FF. Both citrate and succinate are intermediates of the TCA cycle. The absence of citrate in sow FF suggests that citrate is rapidly consumed in a species-specific chemical reaction, or rapidly converted to oxalosuccinate, leading to a level of citrate that is undetectable by 1H-NMR spectroscopy. Specifically, this may reflect a comparatively higher rate of de novo synthesis of fatty acids in the pig ovary. The absence of citrate in sow FF could be related to the high level of succinate. Succinate is oxidized to fumarate by succinate dehydrogenase in the electron transport chain, which is a main site of oxidative phosphorylation in mitochondria. Only a few studies have examined succinate metabolism or succinate dehydrogenase activity in the ovary, and none of them in the pig. One can hypothesize that the high levels of succinate in porcine FF, compared to bovine and equine FF, is due to lower succinate dehydrogenase activity in porcine granulosa cells.
Proton nuclear magnetic resonance spectroscopy was first used by Gosden et al. (1990) to analyze the FF of sheep, pigs, and cows. Since then, several studies in various species have found that the composition of FF differs with follicle size (mare: (Gérard et al., 2002); cow: (Leroy et al., 2004, Sarty et al., 2006); sheep: (Ying et al., 2011); camel: (Ali et al., 2008); pig: (Bertoldo et al., 2013)), resulting in numerous metabolite changes being associated with the acquisition of oocyte developmental competence. Recent analyses of human FF using 1H-NMR spectroscopy are providing additional information about the follicular environment immediately prior to ovulation (McRae et al., 2012; Pinero-Sagredo et al., 2010; Wallace et al., 2012) and in ovarian disorders, such as polycystic ovarian syndrome (Atiomo and Daykin, 2012). The results of the present study further demonstrate the efficacy of the technology to reveal the metabolic signatures of FF samples from different species.
In conclusion, the results of this comparative analysis show that the metabolic profiles of FF differ considerably between cows, mares, and sows, which is likely due to the disparate ovarian physiology of these species. While the metabolic profiles of small FF and large FF differed greatly in the mare and the cow, they varied little in the sow. The findings support the proposal that there is a distinct metabolic shift during follicle development, as glucose levels were significantly elevated in large FF, compared with small FF, in both cows and mares. The extremely low and unchanging concentrations of lactate in mare FF, the undetectable levels of citrate in sow FF, and the undetectable levels of succinate in cow and mare FF, indicate that the activities of some central metabolic enzymes differ enormously between these species. Future investigations into these species-specific differences in follicle metabolism may increase our understanding of the processes critical to folliculogenesis and the acquisition of oocyte developmental competence.
Footnotes
Acknowledgments
The authors wish to thank the staff of the experimental stud farm for technical assistance during the mare ovarian punctures. P. Papillier is acknowledged for sample collection.
This research programme was supported by INRA, France, and IFCE, France. Somayyeh Fahiminiya was supported by a PhD fellowship from INRA.
Author Disclosure Statement
The authors declare that there is no conflict of interest that could be perceived as prejudicing the impartiality of the research reported.
References
Supplementary Material
Please find the following supplemental material available below.
For Open Access articles published under a Creative Commons License, all supplemental material carries the same license as the article it is associated with.
For non-Open Access articles published, all supplemental material carries a non-exclusive license, and permission requests for re-use of supplemental material or any part of supplemental material shall be sent directly to the copyright owner as specified in the copyright notice associated with the article.