
Abstract
Abstract
Saliva has different functions in the mouth and is involved, for example, in taste perception. Saliva composition can also be modified rapidly by taste stimulation. It remains unclear, however, whether the perceived intensity of a tastant may modulate this response. Based on increasing evidence that fat can be perceived by the taste system and that fat taste perception may be associated with fat intake, the aim of this work was to study if stimulation by a fatty acid (oleic acid) modifies saliva composition differently in subjects highly (sensitive+) or weakly (sensitive−) sensitive to that taste. For that purpose, saliva of two groups of subjects was collected after stimulation by either a control emulsion or an emulsion containing 5.61 mM oleic acid. Saliva was analyzed by 2D electrophoresis and 1H NMR spectroscopy. The results show that sensitive+ and sensitive− subjects differ in their salivary response in terms of proteome and metabolome composition. Oppositely to sensitive− subjects, sensitive+ subjects responded to oleic acid by increased abundance of polymeric immunoglobulin receptor, rab GDP dissociation inhibitor beta, and organic acids, and decreased abundance of metabolites characteristic of mucins. The results highlight that modification of saliva composition by taste stimulation may be modulated by taste perception.
Introduction
S
Saliva can be used as a source of biomarkers (Cuevas-Cordoba and Santiago-Garcia, 2014) and recently some studies using “omics” approaches reported correlations between salivary composition and taste acuity (Cabras et al., 2012; Dsamou et al., 2012; Igarashi et al., 2008) including taste sensitivity to oleic acid (Mounayar et al., 2014). These results show a direct implication of saliva in taste perception and particularly in fat perception. Biomarkers of taste perception and in particular of fat perception could be very useful to better understand the relationships between perception, fat intake, and associated pathologies such as obesity. This is supported, for example, by a study showing that oral sensitivity to oleic acid is associated with fat intake and body mass index (BMI) (Stewart et al., 2011).
In addition, it is known that saliva characteristics are modified by an oral stimulation. Thus, it was described that the metabolome and the fatty acid composition are different when saliva is stimulated or not by chewing (Neyraud et al., 2013). Basic tastes' perception also induces modifications of saliva characteristics such as flow, protein concentration, and pH (Dawes, 1984; Hodson and Linden, 2006; Neyraud et al., 2009) or proteome and metabolome composition (Lorenz et al., 2011; Neyraud et al., 2006; Quintana et al., 2009; Takeda et al., 2009). More recently, we showed that salivary lipolytic activity and antioxidant capacity varied after taste stimulation by oleic acid (Mounayar et al., 2013), these variations being significant only in subjects highly sensitive to oleic acid compared to weakly sensitive subjects. However, the analyses were limited to some targeted analyses while the use of omics approaches like proteomics and metabolomics can provide a larger picture of the molecules secreted. Omics approaches may also be usefully applied to the field of nutrition. For example, a nutri-metabolomics study demonstrated that serum composition can be modified by a four-week nutritional intervention consisting of consuming tomato sauces varying in their lycopene content (Bondia-Pons et al., 2013).
In this context, the aim of the present work was to compare the effect of taste stimulation by oleic acid on the salivary proteome and metabolome of two groups of subjects. These two groups were selected based on their sensitivity to the taste of oleic acid (highly and weakly sensitive), following the “extreme discordant phenotype” approach (Nebert, 2000).
Material and Methods
Subjects selection
Subjects selection procedure is detailed in Mounayar et al. (2013). Briefly, two groups were selected from a panel of 73 male subjects according to their taste sensitivity to oleic acid (C18:1). The screening procedure consisted in presenting four series of triangle tests to the subjects, consisting each of two control samples and one sample containing a low concentration of C18:1 (0.099 mM) and ten series of triangle tests consisting each of two control samples and one sample containing a high concentration of C18:1 (1.77 mM). The subjects who detected most frequently the sample containing the low concentration of C18:1 were considered “sensitive+,” while subjects who detected least frequently the sample containing the high concentration of C18:1 were considered “sensitive−”. Following this procedure, the data presented here correspond to two groups of 11 subjects; “sensitive+” and “sensitive−”.
Saliva collection
Whole saliva from the two groups of subjects was collected after stimulation by emulsions containing C18:1 or by a control without C18:1 as described in details in Mounayar et al. (2013). All the sessions took place in the evening to avoid circadian variations in salivary composition and the subjects were asked to refrain from eating or drinking for at least one hour before the start of the experiment. The saliva was collected after stimulation by a control emulsion containing 90% water (Evian), 5% gum acacia, and 5% stable oil (Miglyol). The C18:1 emulsion was similar but contained C18:1 at 5.61 mM, which is a concentration perceivable by the two groups of subjects. During each session, the subjects rinsed their mouth for 10 sec with water and waited 5 min before spitting out their saliva for 10 min. This at-rest sample was used for another study. Following this step, the subjects, who wore nose clips to avoid olfactory perception, were asked to sip 4 mL of either the control or the C18:1 emulsion during a total of 16 sec. The emulsions were spitted out. The saliva was then collected during 10 min. In order to have three samples for control stimulation and three for C18:1 stimulation, the subject had to come on six occasions, with one stimulation given at each occasion. A flow chart of a session is provided in Figure 1. The saliva was weighed immediately and stored at −80°C. Prior to analyses, saliva was clarified by centrifugation at 14,000 g for 20 min at 4°C. The three aliquots, corresponding to either the control or the C18:1 stimulation, were pooled.
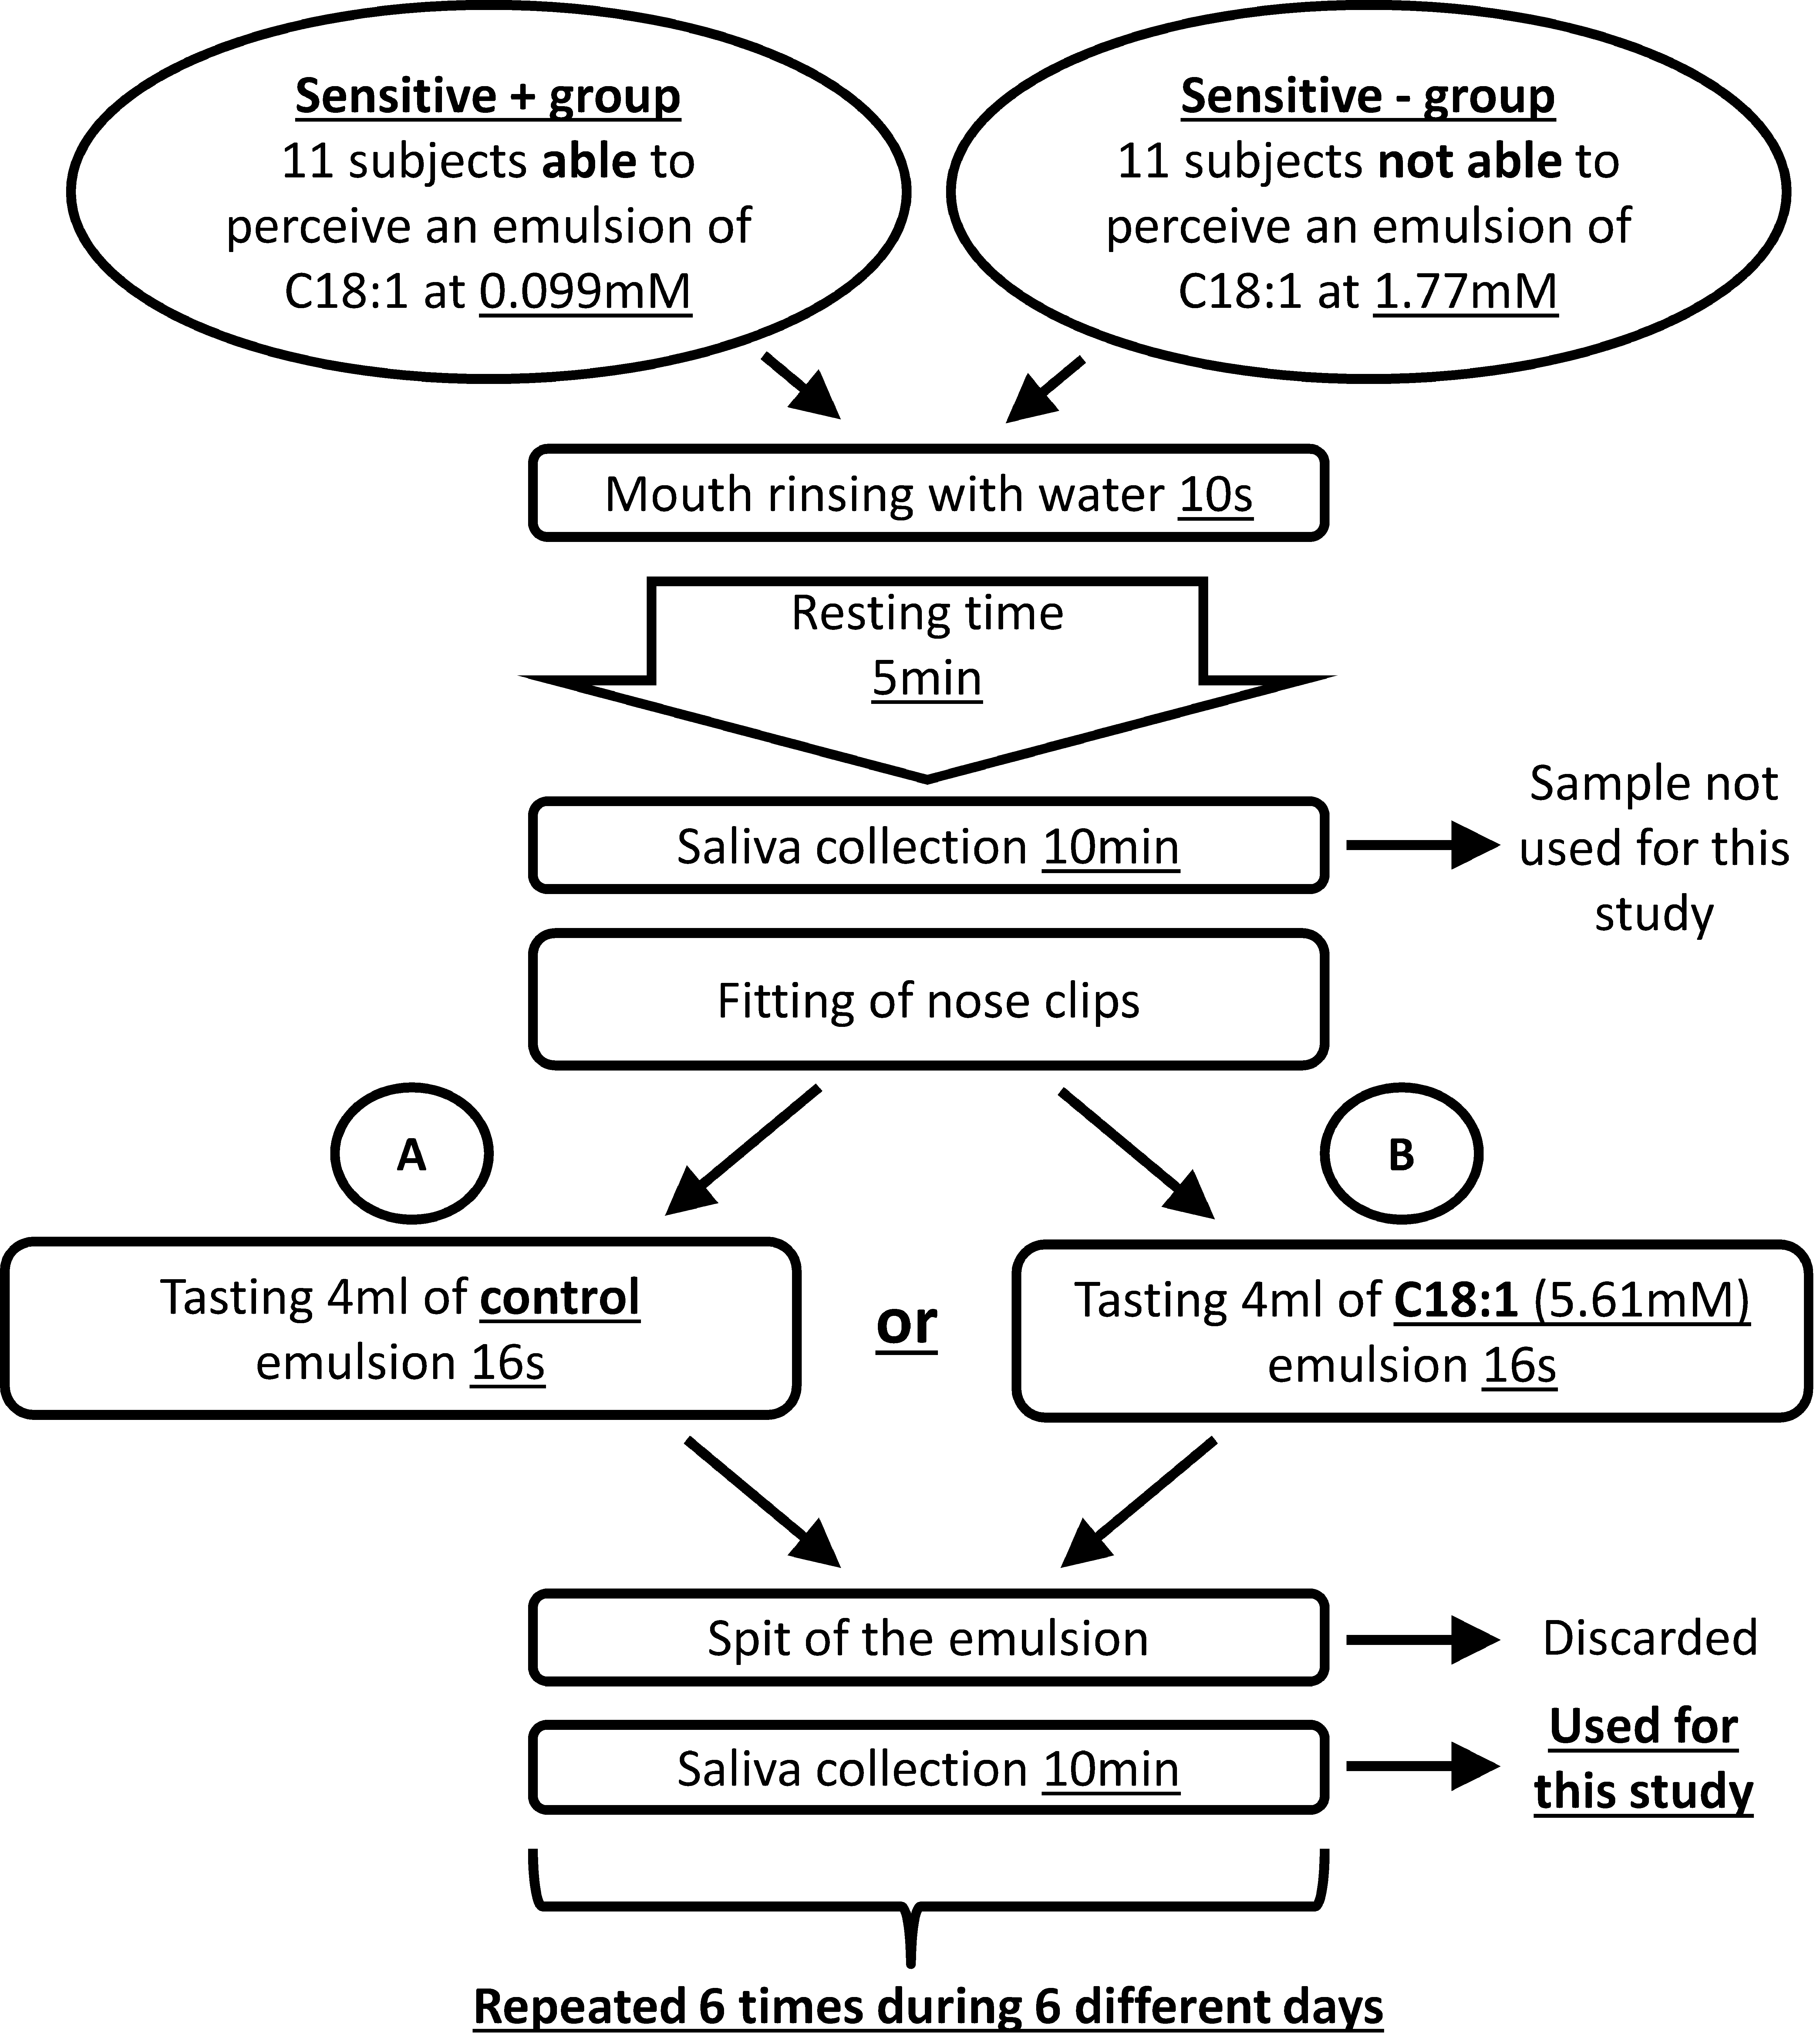
Flow chart of saliva collection procedure. Each session was repeated six times with steps A and B repeated alternatively in order to obtain a total of three samples of saliva collected after control stimulation and three samples of saliva collected after C18:1 stimulation.
The entire protocol was approved by the Ethics Committee: Comité de Protection des Personnes Est-1, and by the Direction Générale de la Santé-France 5 (CPP no. 2010/59, AFSSAPS no. 2010-A01225-34).
Protein content measurement and two-dimensional electrophoresis analysis
Pooled samples of each individual were submitted to ultrafiltration at 15,000 g for 30 min at 10°C using vivaspin devices (MWCO 5kDa, Vivascience, Hannover, Germany). The protein content of the so-obtained extracts was measured using the Bradford method. Isoelectric focusing was performed on a Protean IEF cell (Bio-Rad). The volume corresponding to 200 μg of proteins was included in 250 μL of a rehydration buffer containing 7 M urea, 2 M thiourea, 2% CHAPS, 0.1% DTT, 1% Ampholytes Bio-Lyte, and a cocktail of protease inhibitors (Sigma). This was loaded onto 11 cm 3-10NL IPG strips (Bio-Rad). Strips were rehydrated actively for 16 hours, and isoelectric focusing was performed at a final voltage of 8000 V up to 35 kVh. Following strips equilibration, second dimension horizontal electrophoresis was performed on a HPE TM flat-top tower (Serva) according to the manufacturers' instructions using plastic-backed gels and buffers provided by Serva. The two 11 cm strips corresponding to the same subject (one pool of three samples after control stimulation, one pool of three samples after C18:1 stimulation) were placed adjacently on one nonfluorescent large gel with a 12.5% acrylamide concentration. Gels were fixed in a solution containing 15% ethanol and 1% citric acid, and stained with ProteoStain (Serva). Gel images were acquired on a GS-800 densitometer (Bio-Rad) and images were analyzed using Samespots software (NonLinear Dynamics). Spot volumes were normalized within one gel and transformed into log values.
1H-NMR analysis
100 μL aliquots were added to 550 μL of deuterium oxide (D2O) containing 0.25 mM sodium trimethylsilyl-[2,2,3,3-2H4]-1-propionate (TSP; as a chemical shift reference at 0 ppm). The samples were then centrifuged at 5000 g for 10 min and the supernatants placed in 5 mm NMR tubes. 1H NMR spectra were obtained using a Bruker DRX-600 Avance NMR spectrometer operating at 600.13 MHz for a 1H resonance frequency and an inverse detection 5 mm 1H-13C-15N cryoprobe attached to a cryoplatform.
Spectra were acquired at 300 K using the Carr-Purcell-Meiboom-Gill (CPMG) spin-echo pulse sequence with presaturation, as described previously (Neyraud et al., 2013) using 512 transients.
Finally, spectra were data reduced using AMIX (version 3.91.11, Bruker, Germany) to integrate 0.01 ppm wide regions corresponding to the δ 9.0-0.7 ppm region. The δ 6.5-4.5 ppm region, which includes water resonance, was excluded. The signal relative to C18:1 was also excluded (δ 1.355-1.245 ppm). This region was determined comparing the 1H NMR spectra of saliva without stimulation and with C18:1 stimulation. A total of 601 NMR buckets were included in the data matrices. Each integrated region was normalized to the total spectral area.
Statistical analysis
From the original 2-D electrophoretic and 1H-NMR spectral data (i.e., semi-quantitative values for 2DE spots or NMR buckets), two new sets of variables (one for proteome, one for metabolome) were constructed by subtracting data after control (C) stimulation from data after C18:1 stimulation (C18:1-C). Such values represent the change in protein or metabolite abundance induced by C18:1 stimulation. The difference between the two groups was subsequently tested by one-way ANOVA for proteome data, setting the level of significance at 5%, and by Partial Least Squares-Discriminant Analysis (PLS-DA) for metabolome data. This PLS-DA was used to model the relationship between sensitivity to C18:1 (qualitative variable Y with two levels: sensitive+/sensitive−) and the metabolome data set described above (variable X). Data analysis was performed as in Neyraud et al. (2013) and consists in: 1) OSC filtering to remove variations not linked to the sensitivity (sensitivity was used as a corrective factor); 2) Mean-centering of filtered data; 3) selection of number of components by cross validation; 4) Evaluation of predictive capacity of the model (Q2 parameter); and 5) assessment of model robustness by permutation test (200 permutations were done). Discriminant variables were selected using variable importance in the projection (VIP) with a threshold of 1.5. The Kruskal–Wallis test was finally used to determine metabolites that differed significantly between the two groups, considering p<0.05 as the level for significance. Multivariate analysis was performed using SIMCA-P software (V13, Umetrics AB, Umea, Sweden).
Protein identification by mass spectrometry
Spot excision and preparation, trypsin digestion, peptide extraction, and MALDI-TOF MS and MS-MS analyses using a MALDI TOF/TOF UltrafleXtreme were performed as in Mounayar et al. (2014). The database search was perfomed in SwissProt restricted to human entries.
Results
Proteome analysis
Six spots saw their abundance vary differently (p<0.05) with oleic acid stimulation between the sensitive+ and sensitive−groups (Table 1). The six spots decreased in abundance after oleic acid stimulation in the sensitive+ group, while they increased in abundance in the sensitive− group. Five spots were successfully identified by MALDI-TOF MS/MS (Table 2). Thus, sensitive+ subjects responded to oleic acid stimulation by a decrease in salivary levels of polymeric immunoglobulin receptor (three spots), of rab GDP dissociation inhibitor beta (1 spot) and of one isoform of amylase, while the opposite response was observed in sensitive− subjects.
A negative sign indicates that the abundance is reduced by C18:1 stimulation.
In MS mode, the identification is significant if Mascot score >56; bIn MS/MS mode, the identification is significant if Mascot score >40.
Metabolome analysis
PLS-DA applied on the NMR data shows a good separation between the two groups (sensitive+ and sensitive−) (Fig. 2) and the model generated was robust with a R2=99.5% and Q2=0.95. Table 3 shows the difference in concentration of metabolites (after C18:1 stimulation minus after control stimulation) for the metabolites that were significantly affected in the sensitive+ group and in the sensitive− group. Six metabolites, three organic acids (formate, acetate, and propionate), lysine, valine, and γ-aminobutyric acid (GABA) increased in abundance in the sensitive+ group after stimulation by C18:1, while they decreased in the sensitive− group. Six metabolites (ethanolamine, galactose, glucose, lactate, phosphocholine, and threonine) increased in abundance in the sensitive− group, but decreased in the sensitive+ group.
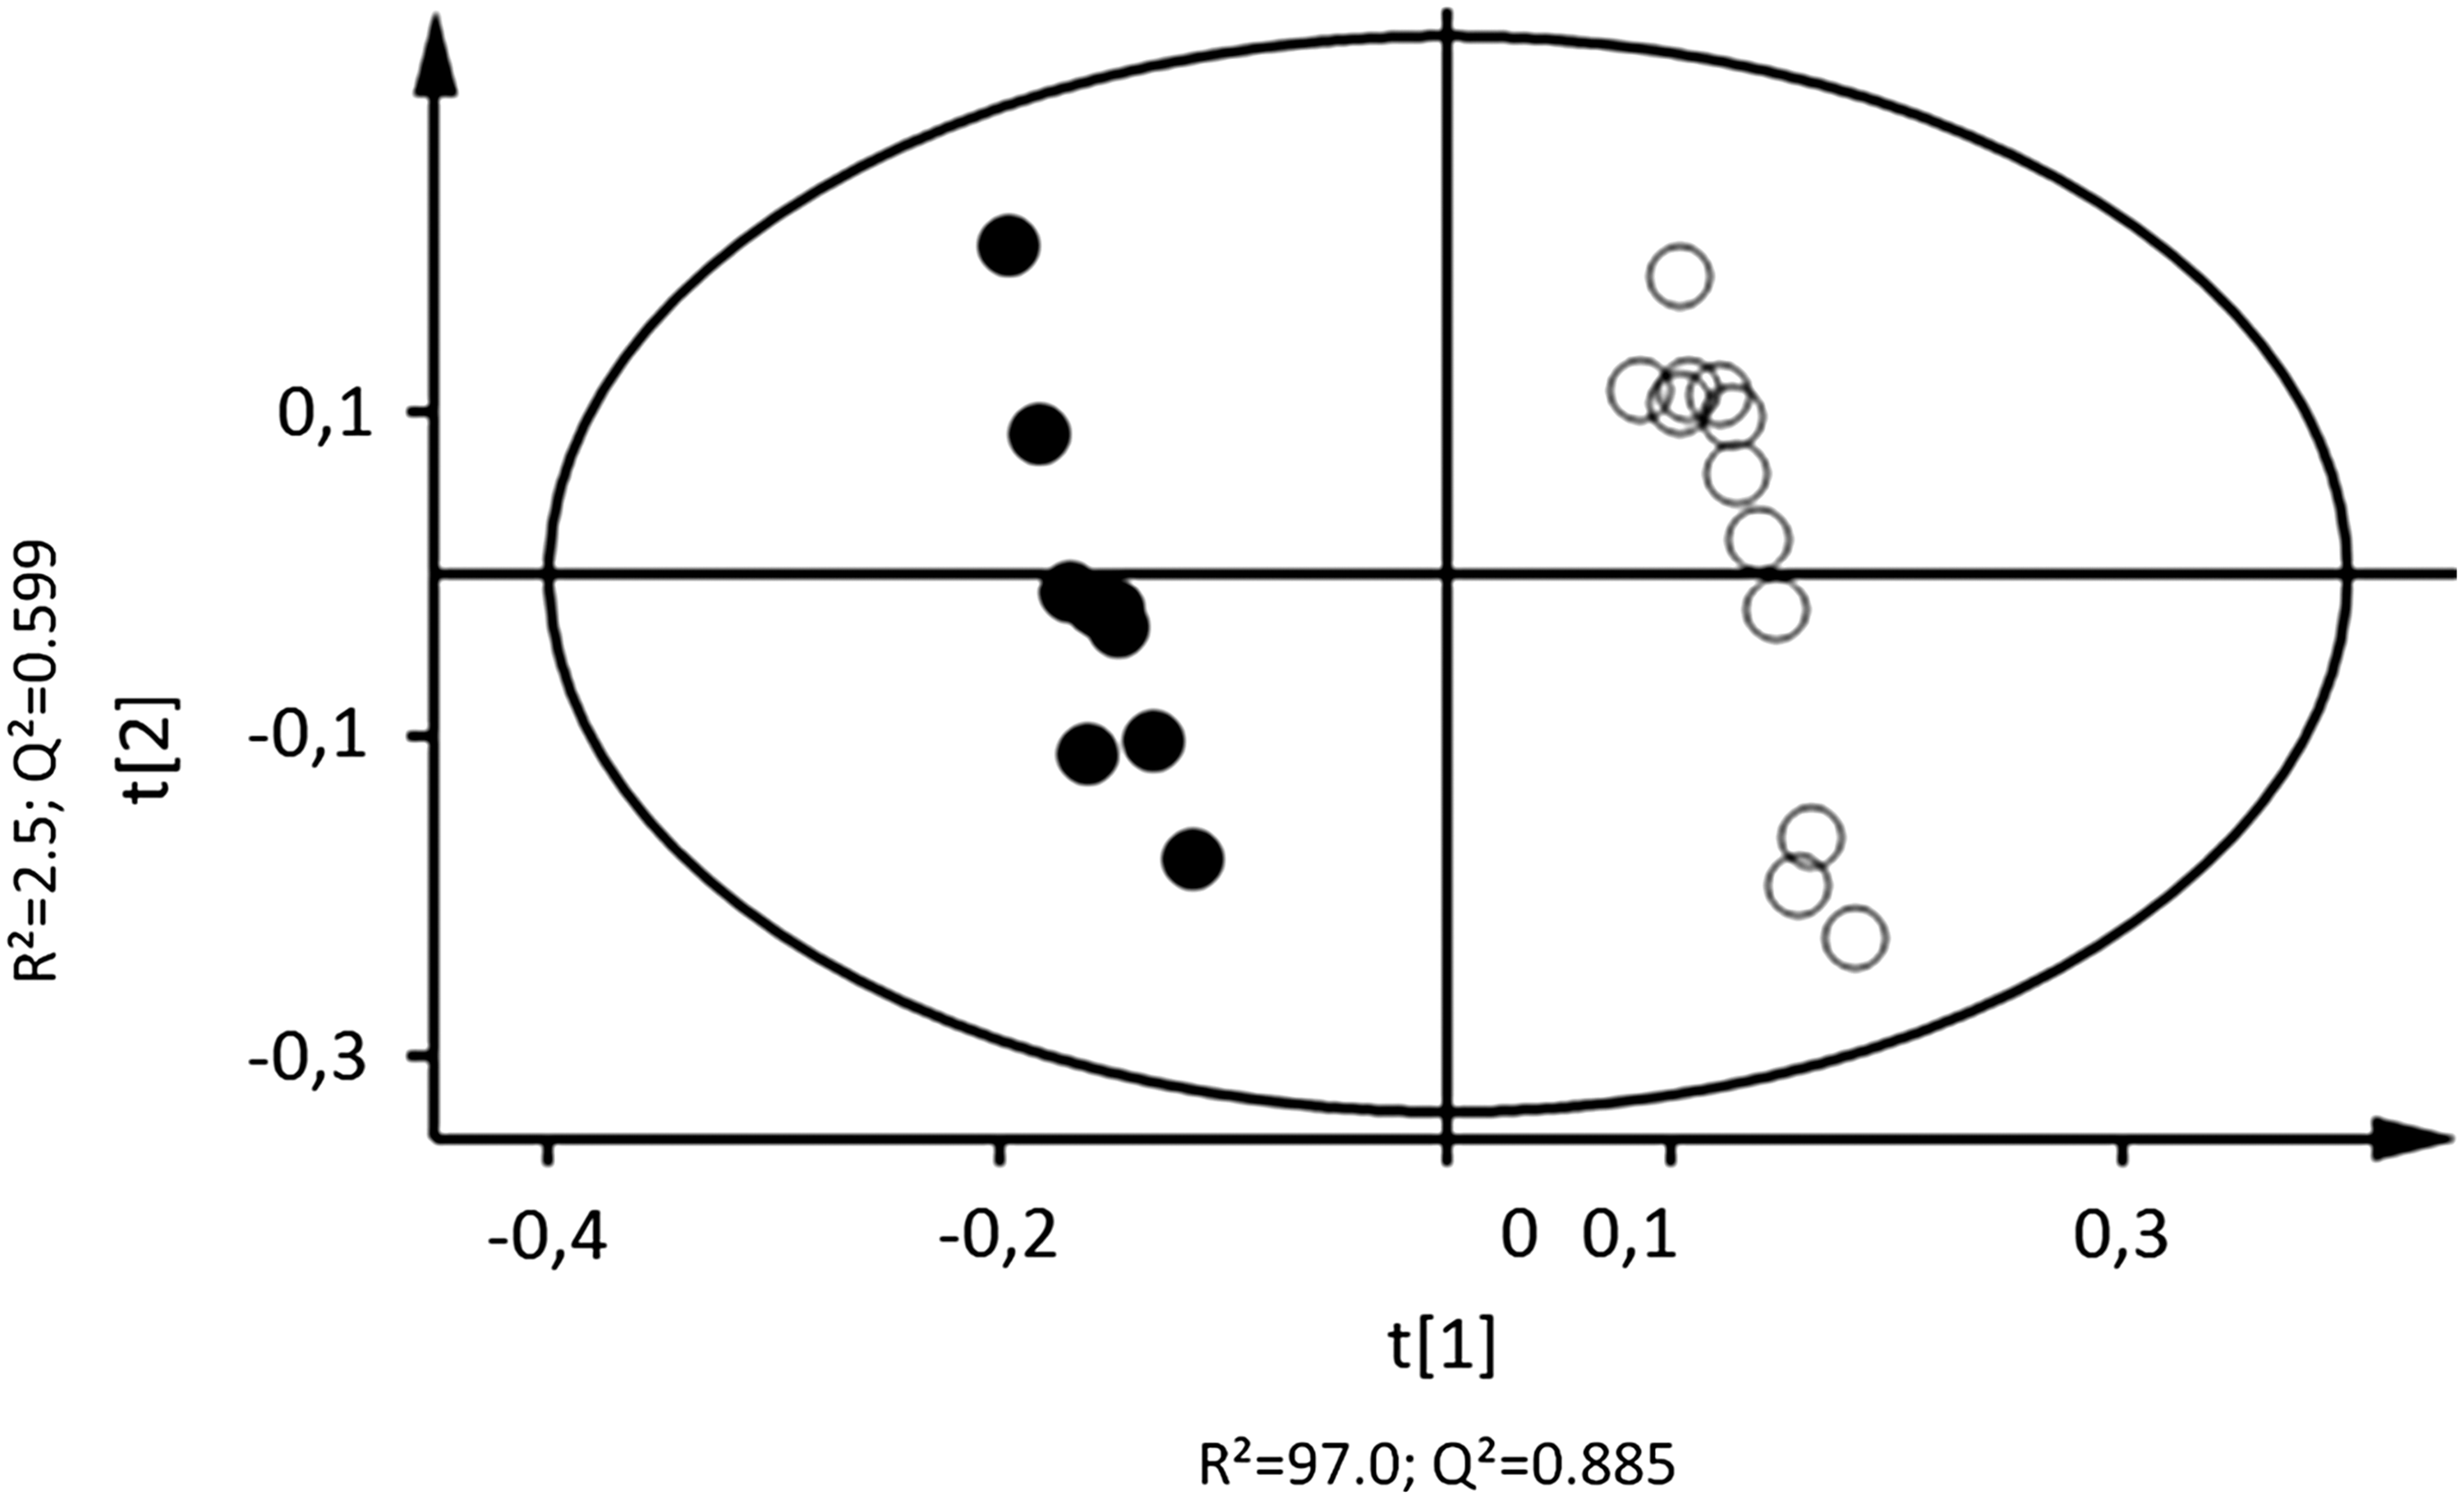
Two-dimensional PLS-DA scores plot of 1H NMR data from sensitive+ (filled circles, n=11) and sensitive− (empty circles, n=11) subjects. R2=99.5% and Q2=0.95 (first axis: R2=97.0% and Q2=0.89; second axis: R2=2.5% and Q2=0.60).
A negative sign indicates that the abundance is reduced by C18:1 stimulation.
Discussion
Studying the modifications of saliva composition following a sensory stimulation is a new strategy for understanding the physiological response of the body to sensory perceptions. It may contribute to understand better the mechanisms at the origin of food intake, eating habits, and related pathologies such as obesity. This is especially true for fat perception since it has been shown that oral sensitivity to C18:1 is associated with fat intake and BMI (Stewart et al., 2011). In the present study, there was no significant difference in the average BMI of the two groups of subjects. However, using the same groups of subjects, we recently found that lipolysis and antioxidant status of saliva were enhanced after stimulation by C18:1 for the sensitive+ subjects (Mounayar et al., 2013). Here, we show that the salivary response in terms of metabolite and protein composition differed between the two groups of subjects. These modifications translate two different and complementary ideas. It first indicates a sensory-dependent response of the salivary system and second, it may have consequences on perception of C18:1.
From a protein point of view, the difference between the sensitive+ and sensitive− subjects was related to three identified proteins. The result concerning the one spot of alpha-amylase may not be highly meaningful as the abundance of one spot does not reflect the abundance of this major constituent of saliva, let alone its activity. Concerning Rab GDP dissociation inhibitor beta (Rab GDI beta), it has been studied in the parotid gland of mammals in relation to its function in exocytosis of proteins from secretory granules (Benhar et al., 1997). Rab GDI beta is predominantly found in the cytosol of acinar cells (Watson, 1999) but it has also been detected in human saliva (Denny et al., 2008). More specifically, its abundance in whole saliva increased in periodontitis patients after treatment of the inflammation compared to the pre-intervention condition (Haigh et al., 2010). In the present study, Rab GDI beta was the only inflammatory marker found, while many others have been documented in saliva (Ferracioli et al., 2010; Nishanian et al., 1998). It is therefore unlikely that the change in abundance after C18:1 stimulation reflects differences in anti-inflammatory response between the groups.
The other protein that was modified differently between the two groups in response to C18:1 stimulation is polymeric immunoglobulin receptor (PIgR). PIgR is a transporter of IgA across epithelial cells and as such, it is an actor of the mucosal immune system. PIgR has a theoretical molecular weight of approximately 83 kDa but its extracellular domain (termed secretory component), with a theoretical molecular weight of approximately 64kDa, is released into saliva upon secretion of IgA. Therefore, although the MW we observed was above that of secretory component, it is most likely that the three spots correspond to this part of the protein. The decrease of PIgR after C18:1 stimulation in sensitive+ subjects may indicate a negative regulation of IgA secretion. An increase of IgA secretion in the intestinal lumen after perfusion of the jejunal loop by C18:1 was previously demonstrated in rats (Imaeda et al., 1993). To our knowledge, the effect of C18:1 on factors of mucosal immunity in the oral cavity has not been studied but the present results would suggest that the regulation of IgA secretion by C18:1 would depend on taste perception.
When focusing on the metabolome modification, the C18:1 stimulated saliva of the sensitive+ subjects was mainly characterized by a rise in organic acids such as acetate, formate, and propionate. These molecules can be the products of cellular or bacterial metabolism. Recently, Park et al. (2014) reported an increase of salivary concentration of the same organic acids; acetate and propionate on one hand, and formate on the other hand, 5 min and 10 min, respectively, after mouth rinsing with 10% w/v glucose solution. They mentioned that these organic acids are produced from pyruvate by Streptococcus Veillonella and Clostridium (Distler and Kröncke, 1980). Therefore, the abundance of these organic acids in the sensitive+ group could be due to a higher release of bacterial products in the oral medium. Bacteria in the oral cavity are mainly in the form of biofilm widespread on the teeth and mucosal surfaces. Consequently, the abundance of organic acids in the saliva of sensitive+subjects could be due to a destruction of bacterial biofilms leading to a release of molecules secreted by microorganisms.
This is further supported by the report that C18:1 has antibacterial properties (Desbois and Smith, 2010). Stenz et al. (2008) also reported that during in vitro Staphylococcus aureus biofilm development in the presence of C18:1, large bacterial clumps were released from already constituted biofilms. Why such a phenomenon would be enhanced in subjects of higher sensitivity remains unclear. However, Dsamou et al. (2012) suggested that a thinner or looser structure of the protein pellicle coating the surface of the tongue may be at the origin of higher sensitivity to bitterness. By extrapolation of this result, hypersensitive subjects to C18:1 could also have a more labile or fragile tongue-coating biological film, made both of salivary proteins and bacteria, and therefore bacterial metabolites would be more readily released into saliva upon stimulation.
In the same group of subjects, we observed an over-representation of GABA. GABA is an abundant neurotransmitter that may be expressed in mammalian taste buds. It has been suggested that it can be released by taste receptor cells after taste stimulation (Cao et al., 2009). Such a release would have the purpose to inhibit taste receptor cells expressing receptors of other taste qualities. Secretion in the sensitive+group after stimulation by C18:1 indicates that GABA expression or release depends on taste perception.
Finally, the joint rise of threonine and galactose in the sensitive− group may be related to the abundance of specific glycosylated proteins in saliva, since, for example, threonine is the most abundant amino acid of human salivary mucins and galactose is one of the main molecules of their oligosaccharides moieties (Thomsson et al., 2002; Wu et al., 1994). Mucins are high-molecular weight glycoproteins that play an important role in oral health by coating the oral surfaces and providing lubrication properties to saliva (Nieuw Amerongen and Veerman, 2002). Based on rheological measurements of whole saliva, such as viscosity and viscoelasticity, it has been suggested that mucins can be secreted in saliva after stimulation by an acidic solution (Davies et al., 2009; Stokes and Davies, 2007) as a protective mechanism against acid damage. Because oleic acid has an acid function and was previously reported as an irritant (Mattes, 2009), secretions of mucins after C18:1 oral stimulation appears likely. The mechanism by which hyposensitive subjects would secrete more mucins after stimulation is not known. However, regardless of the underlying mechanism, this may have sensory consequences. Mucins can, for example, bind hydrophobic aromatic compounds, as demonstrated in artificial saliva (van Ruth et al., 2001). It is therefore possible that mucins can also interact with C18:1, and that the hypersecretion of mucins that we suggest in hyposensitive subjects would contribute to their lower sensitivity by lowering the accessibility of C18:1 to the taste receptors.
Conclusion
These results show that the modifications in saliva composition induced by C18:1 stimulation differ according to taste sensitivity to this compound. It is uncertain whether the differences we observe reflect a genetic predisposition or are rather the result of activation of the autonomic nervous system modulated by the sensory nervous information. In addition, the potential contribution of the oral microbiota opens new perspectives. This contribution was already suggested (Mounayar et al., 2014) but further investigations are necessary to better understand the microbial-related mechanisms implicated in perception.
Footnotes
Acknowledgments
The Burgundy Regional Council is gratefully acknowledged for its financial support.
Author Disclosure Statement
The authors declare that no competing financial interests exist.