
Abstract
Abstract
Elevated triglycerides (TG) or low high density lipoprotein cholesterol (HDL-C) levels are common cardiometabolic risk factors in children. From a systems genetics standpoint, Visualization of Statistical Epistasis Networks (ViSEN) is a nonparametric entropy-based method that can characterize the global structure of interacting genetic factors. We identified a novel set of connected genetic and cardiometabolic risk factors with strong and significant interaction effects on two important dyslipidemia phenotypes (low HDL-C and high TG) in children and adolescents. Study participants were recruited from five schools in Istanbul, Turkey (n=360; 170 boys, 190 girls). Participants with TG levels≥75th and HDL-C levels≤25th percentile were defined as ‘high TG’ and ‘low HDL-C’, respectively. We genotyped participants for six single nucleotide polymorphisms (SNPs) in five genes with known associations to lipid levels (rs328 in LPL, rs708272 in CETP, rs1800588 in LIPC, rs1800977 in ABCA1, rs1799941 and rs6257 in SHBG gene). ViSEN was used to identify associations with dyslipidemia phenotypes. There were 71 (50 males, 21 females) and 93 (60 males and 33 females) subjects with low HDL-C and high TG, respectively. Biological variables including age, gender, and BMI were significantly associated with both phenotypes (p<0.001). Importantly, a single SNP, rs708272, was associated with low HDL-C (IG=2.24%, p=0.026). Pairwise and higher order interaction analyses in the full dataset for low HDL-C and high TG revealed the largest effects in the models containing rs1800977, rs708272, age (IG=6.20%, p=0.046) and rs1800588, age, BMI (IG, 3.06%, p=0.022), respectively. In conclusion, the present study brings us a step closer to a systems genetic approach in understanding lipid phenotypes in children. Further efforts can integrate population and laboratory-based studies, hence accelerate the preventive medicine efforts.
Introduction
C
Dyslipidemia is commonly characterized by three lipid abnormalities: high triglyceride (TG), high low density lipoprotein cholesterol (LDL-C), and low high-density lipoprotein cholesterol (HDL-C) levels (Pöss et al., 2011; Vinueza et al., 2010; Voight et al., 2012). Long-term cohort studies in children report that dyslipidemia starts early in life (Berenson et al., 1998). Generally, dyslipidemia is a complex trait induced by interactions between environmental and genetic factors (Ebrahim et al., 2011). Many intrinsic and extrinsic risk factors play a role in the onset of dyslipidemia. Although the exact cellular and molecular mechanisms leading to the dyslipidemia remain unclear, it is believed that functionally relevant mutations in the dyslipidemia-related genes are pivotal and contribute to increased susceptibility to cardiovascular disease.
Polymorphisms in the genes coding for the receptors and enzymes within known lipid metabolism pathways relate to the onset of dyslipidemia (Brouwers et al., 2012; Weisglass-Volkov et al., 2010). We selected six single nucleotide polymorphisms (SNPs) previously associated with lipids or sex hormone binding globulin (SHBG) levels in several adult populations (Ahn et al., 2008; Ariza et al. 2010; Ayyappa et al., 2013; Boekholdt et al., 2005; Eriksson et al. 2006; Hodoglugil et al., 1999; 2005; Pan et al., 2012; Riancho et al., 2008; Rip et al., 2006; Tang et al., 2010) (Supplementary Table S2). The six SNPs selected for inclusion in our study were rs328 [ABCA1 (ATP-binding cassette (ABC) transporters], rs708272 [CETP (cholesteryl ester transfer protein)], rs1800588 [LIPC (hepatic lipase)], rs1800977 [LPL (lipoprotein lipase)], and finally, two SNPs from the SHBG gene: rs1799941 and rs6257.
ABCA1 is involved in the process of reverse cholesterol transport. Specifically, it can transport cholesterol in cells of peripheral tissues to the liver where cholesterol is metabolized, and thus ABCA1 plays an important role in anti-atherosclerosis (Yin et al., 2010). Mutations of ABCA1 may lead to functional change and promote cholesterol and cholesteryl ester accumulation in macrophages, which significantly contributes to the development of dyslipidemia. CETP, LPL, and LIPC take part in TG and HDL-C metabolism. Mutations of CETP, LPL, and LIPC genes associate with lipid abnormalities (i.e., low HDL-C or high TG) in adult populations (Boes et al., 2009; Hodoglugil et al., 1999; Pan et al., 2012; Rip et al., 2006). SHBG has profound effects on lipids and cardiometabolic risk; SHBG gene polymorphisms determine SHBG and lipid levels (Ahn et al., 2008; Eriksson et al., 2006; Riancho et al., 2008).
Most existing genetic association studies on low HDL-C or high TG have focused on the independent effects of individual genes. Yet, hyperlipidemia is a complex trait and involves high order interactions among genetic variations. As a result, much of the heritability of hyperlipidemia remains to be elucidated. Advanced analytical strategies can characterize those genetic effects that depend on the biological variables (Eichler et al., 2010). Thus characterization of the complex genetic architecture underlying hyperlipidemia in children can be possible. Previous studies describe a network-based statistical epistasis networks (SEN), to characterize the gene–gene interactions of complex human traits (Hu et al., 2011; 2013).
In this study, we examined high order genetic interactions in determining lipid levels among children and adolescents through visualization of statistical epistasis networks (ViSEN). This method can identify interacting SNPs that associate with high TG or low HDL-C in children. The interaction between the SNPs and/or cardiometabolic variables is expressed by the information gain (IG), which is the gain in mutual information from knowing both variables with respect to the phenotype (i.e., low HDL-C and high TG). A positive value of IG indicates the synergy between the variables. Because low HDL-C and high TG are complex traits that very likely involve high order genetic interactions, we attempt to characterize higher order synergistic interactions using IG.
Methods
Participant demographics
Study participants were recruited from five different state elementary and primary schools in the Uskudar region of Istanbul, Turkey, in 2007 according to the protocol(s) previously described (Agirbasli et al., 2013). Our study cohort consisted of a subset of the Agirbasli et al. cohort for which genetic data was readily available (n=360; 170 boys, 190 girls) (Table 1). Informed consent and assent were obtained for all participants, as described in detail previously (Agirbasli et al., 2013). Lipid levels, as well as select cardiovascular risk factors and atherosclerosis precursors, were measured in all study participants (n=365).
N (%); 2P-values presented are from Chi Square test of association; Fisher's Exact test p-values are presented where appropriate.
For the purpose of our study, participant age, body mass index (BMI), and homeostasis model assessment-estimated insulin resistance (HOMA-IR) measured previously by Agirbasli et al, were subdivided according to our study protocols: age was divided into quartiles, BMI was divided into three categories (normal, overweight, and obese), and HOMA-IR was dichotomized into groups (group 1≤3.16<group 2) (Agirbasli et al., 2013; Cole et al., 2000; NGHS Coordinating Center 1998) (Tables 1 and 2).
P-values presented are from the Kolmogorov-Smirnov test for equality of distributions within each quartile. Because of a large number of ties in the data, the p-values shown are permutation p-values (n=1000).
SNP Selection
All participants in our study were previously genotyped for six single nucleotide polymorphisms (SNPs) with known associations to lipid levels and/or sex hormone binding globulin levels in adults (Agirbasli et al., 2013): rs328 in LPL, rs1800977 in ABCA1, rs1800588 in LIPC, rs708272 in CETP, and rs1799941 and rs6257 in SHBG (Supplementary Tables S2 and S3).
Definition of phenotypes
Age and sex-specific HDL-C and TG percentiles were calculated according to data presented by the National Heart Lung and Blood Institute Growth and Health Study (Keskin et al., 2005). Participants with TG levels≥75th percentile were defined as ‘High TG’. Participants with HDL-C levels≤25th percentile were defined as ‘Low HDL-C’.
Statistical analyses
Analyses were performed to assess whether the distributions of demographic variables to be included in association analyses, differed significantly between dependent categories in each phenotype, separately. Chi-square tests and Fisher's Exact tests were performed, where appropriate, to assess whether gender, HOMA-IR, and BMI category were associated with each phenotype; p<0.05 were considered statistically significant. Chi-square and Fisher's Exact tests were performed using the STATA 11 software package (Stata Corp 2009). The nonparametric Kolmogorov-Smirnov test was used to assess whether there was a difference in the age distribution between cases and controls. Due to the large number of ties (individuals with identical values for a given variable), which causes the standard Kolmogorov-Smirnov test to perform poorly, we used the ks.test and perm.test functions in the R statistical package to provide more accurate p-values using permutation (n=1000) (Rizzo, 2008; R Core Team, 2013).
Prior to association analyses, all markers were tested for deviations from Hardy Weinberg Equilibrium (HWE), as this test may serve as a means for detecting possible genotyping error and is generally used as a proxy for data quality. For the purpose of our analyses, a HWE p<0.01 was considered to indicate significant deviation from equilibrium. HWE was calculated separately for each phenotype, as well as in low and high categories separately, and all HWE calculations were conducted using the software package, PLINK (Purcell et al., 2007). All of the calculated HWE p-values were p≥0.010 (Supplementary Tables S4 and S5). As our study is only powered to detect common (minor allele frequency≥0.05) variants, allele frequencies of all markers were also assessed using PLINK (Purcell et al., 2007). Since none were below this threshold, all genotyped SNPs were included in our analyses.
Visualization of Statistical Epistasis Networks (ViSEN), a nonparametric entropy based method that identifies both main effects and interaction effects with and without the presence of main effects, was used to detect associations with dyslipidemia phenotypes (Hu et al., 2011; 2013). ViSEN constructs an entropy-based network of genetic (SNP) and environmental variables organized around the strongest interaction effects, as opposed to the strongest main effects; strength of effects are measured by percentage of information gain (IG), a metric that quantifies the percentage of disease status (case, control) that can be explained by observing a selected variable and/or pair of variables. To determine the strength of only the pairwise interaction effect specified, the calculation of interaction IG excludes the main effect IG for each variable, ensuring that significant pairwise effects are not artifacts of strong main effects. This approach presents an IG statistic for the “pure” pairwise interaction. This same procedure was followed to produce “pure” three variable interaction effects, and ensures that interactions that display a high IG statistic are not artifacts of strong main or lower order effects. It is important to note that a positive IG value indicates a synergistic relationship between variables, and a negative IG indicates redundancy between variables. Once the IG statistics are calculated, the case/control status is permuted (n=1000) to create an empirical IG distribution. P values for the IG statistic are determined by observing the number of permutation-based IG statistics that are larger than or equal to the observed IG statistic for each interaction. Interactions were considered statistically significant if IG≥1.00 and p≤0.05. Single locus, pairwise, and three variable interaction IG statistics were calculated for both phenotypes in the full dataset as well as in gender subsets.
Results
Demographic information for all study participants (n=360) are presented in Tables 1 and 2. There were 71 (50 males, 21 females) and 93 (60 males and 33 females) subjects with low HDL-C and high TG, respectively. Gender was significantly associated with both Low HDL-C (p<0.001) and High TG (p<0.001) (Table 1). HOMA-IR measurements were not significantly associated with Low HDL-C (p=0.190), but were significant predictors of High TG (p=0.030) (Table 1). Body mass index (BMI) was significantly associated with both Low HDL-C (p<0.001) and High TG (p<0.001) (Table 1). Age also differed significantly between cases and controls in both phenotypes (HDL-C p-value=0.003, TG p-value=0.008); upon further inspection, in both instances, this difference was only observed within the third quartile of the overall age distribution (Table 2). These results are concordant with previous studies performed in this cohort, as well as established literature on the relationship between BMI, insulin resistance, and age on serum lipid levels (TG and HDL-C) (Agirbasli et al,. 2013).
Analysis of Low HDL-C and High TG main effects
In the full dataset, there were 71 (50 males, 21 females) and 93 (60 males and 33 females) individuals with Low HDL-C and High TG, respectively (Table 1). ViSEN analysis was used to explore the independent main effects of all genotyped SNPs and applicable biological variables; gender was included as a biological variable in analyses performed on the full dataset. The largest significant main effects for both Low HDL-C and High TG were BMI (Low HDL-C: IG=3.82%, p<0.001, High TG: IG=6.82%, p<0.001) and gender (Low HDL-C: IG=5.44%, p<0.001; High TG: IG=3.69%, p<0.001) (Table 3a and b). A single SNP, rs708272, was also significantly associated with Low HDL-C (IG=2.24%, p=0.026) in the full dataset (Table 3a), while no SNPs were shown to be significantly associated with the High TG in the full dataset (Table 3b).
Statistically significant IG percentages are highlighted in
Information Gain (IG): Percentage of information gained for 1Low HDL-C status and 3High TG status; 2Information Gain p-value is based on 1000 permutations; –: Not applicable.
Because gender was significantly associated with both phenotypes in the full dataset, gender stratified analyses were also performed. In the gender stratified subsets, BMI retained its significant association with both Low HDL-C (males: IG=3.58%, p=0.035; females: IG=4.94%, p=0.030) and High TG (males: IG=7.01%, p=0.001; females: IG=7.54%, p<0.001) (Tables 3a, 3b). Rs708272 remained significantly associated with Low HDL-C in females (IG=5.81%, p=0.025), but not in males (IG=1.40%, p=0.248), indicating that the significant effect in the full dataset was driven by the substantial female-only association (Table 3a). Interestingly, although no SNPs were significantly associated with High TG in the full dataset, in the male only subset a significant association between High TG and rs328 (IG=2.07%, p=0.035) (Table 3b). These results were concordant with previous analyses that used logistic regression and Prevalence Based Association Test (PRAT) and found only rs708272 to be significant in females (Agirbasli et al., 2013).
Analysis of Low HDL-C and High TG pairwise interaction effects
Pairwise interaction analysis of the Low HDL-C dataset produced five significant interaction effects in the full dataset (Table 4a, Fig. 1a). All of these interactions contained at least one SNP, with the strongest interaction effect belonging to the model containing rs1800588 and age (IG=2.84%, p=0.032). In the male subset, there were two significant pairwise interactions (Table 4a, Supplementary Fig. S1a). The stronger of the two models included rs1799941 and age, and had an IG of 6.19% (p=0.006). There were eleven significant interaction effects in the female subset, the largest of which was from the model containing rs1800977 and BMI (IG=7.06%, p<0.001) (Table 4a, Fig. S1b). Only one significant interaction replicated across full, male and female datasets. This pairwise interaction, between rs1800588 and rs328, had IG's of 2.67% (p=0.003), 3.60% (p=0.013), and 2.83% (p=0.008) for the full, male, and female datasets, respectively. Additionally, the full HDL-C dataset had two significant models, both of which contained rs1799941, that replicated across gender stratified subsets; rs1799941 and age (full dataset: IG=2.53%, p=0.032; males: IG=6.19%, p=0.006), and rs1799941 and rs1800588 (full dataset: IG: 2.40%, p=0.007, females: IG=5.88%, p=0.001).
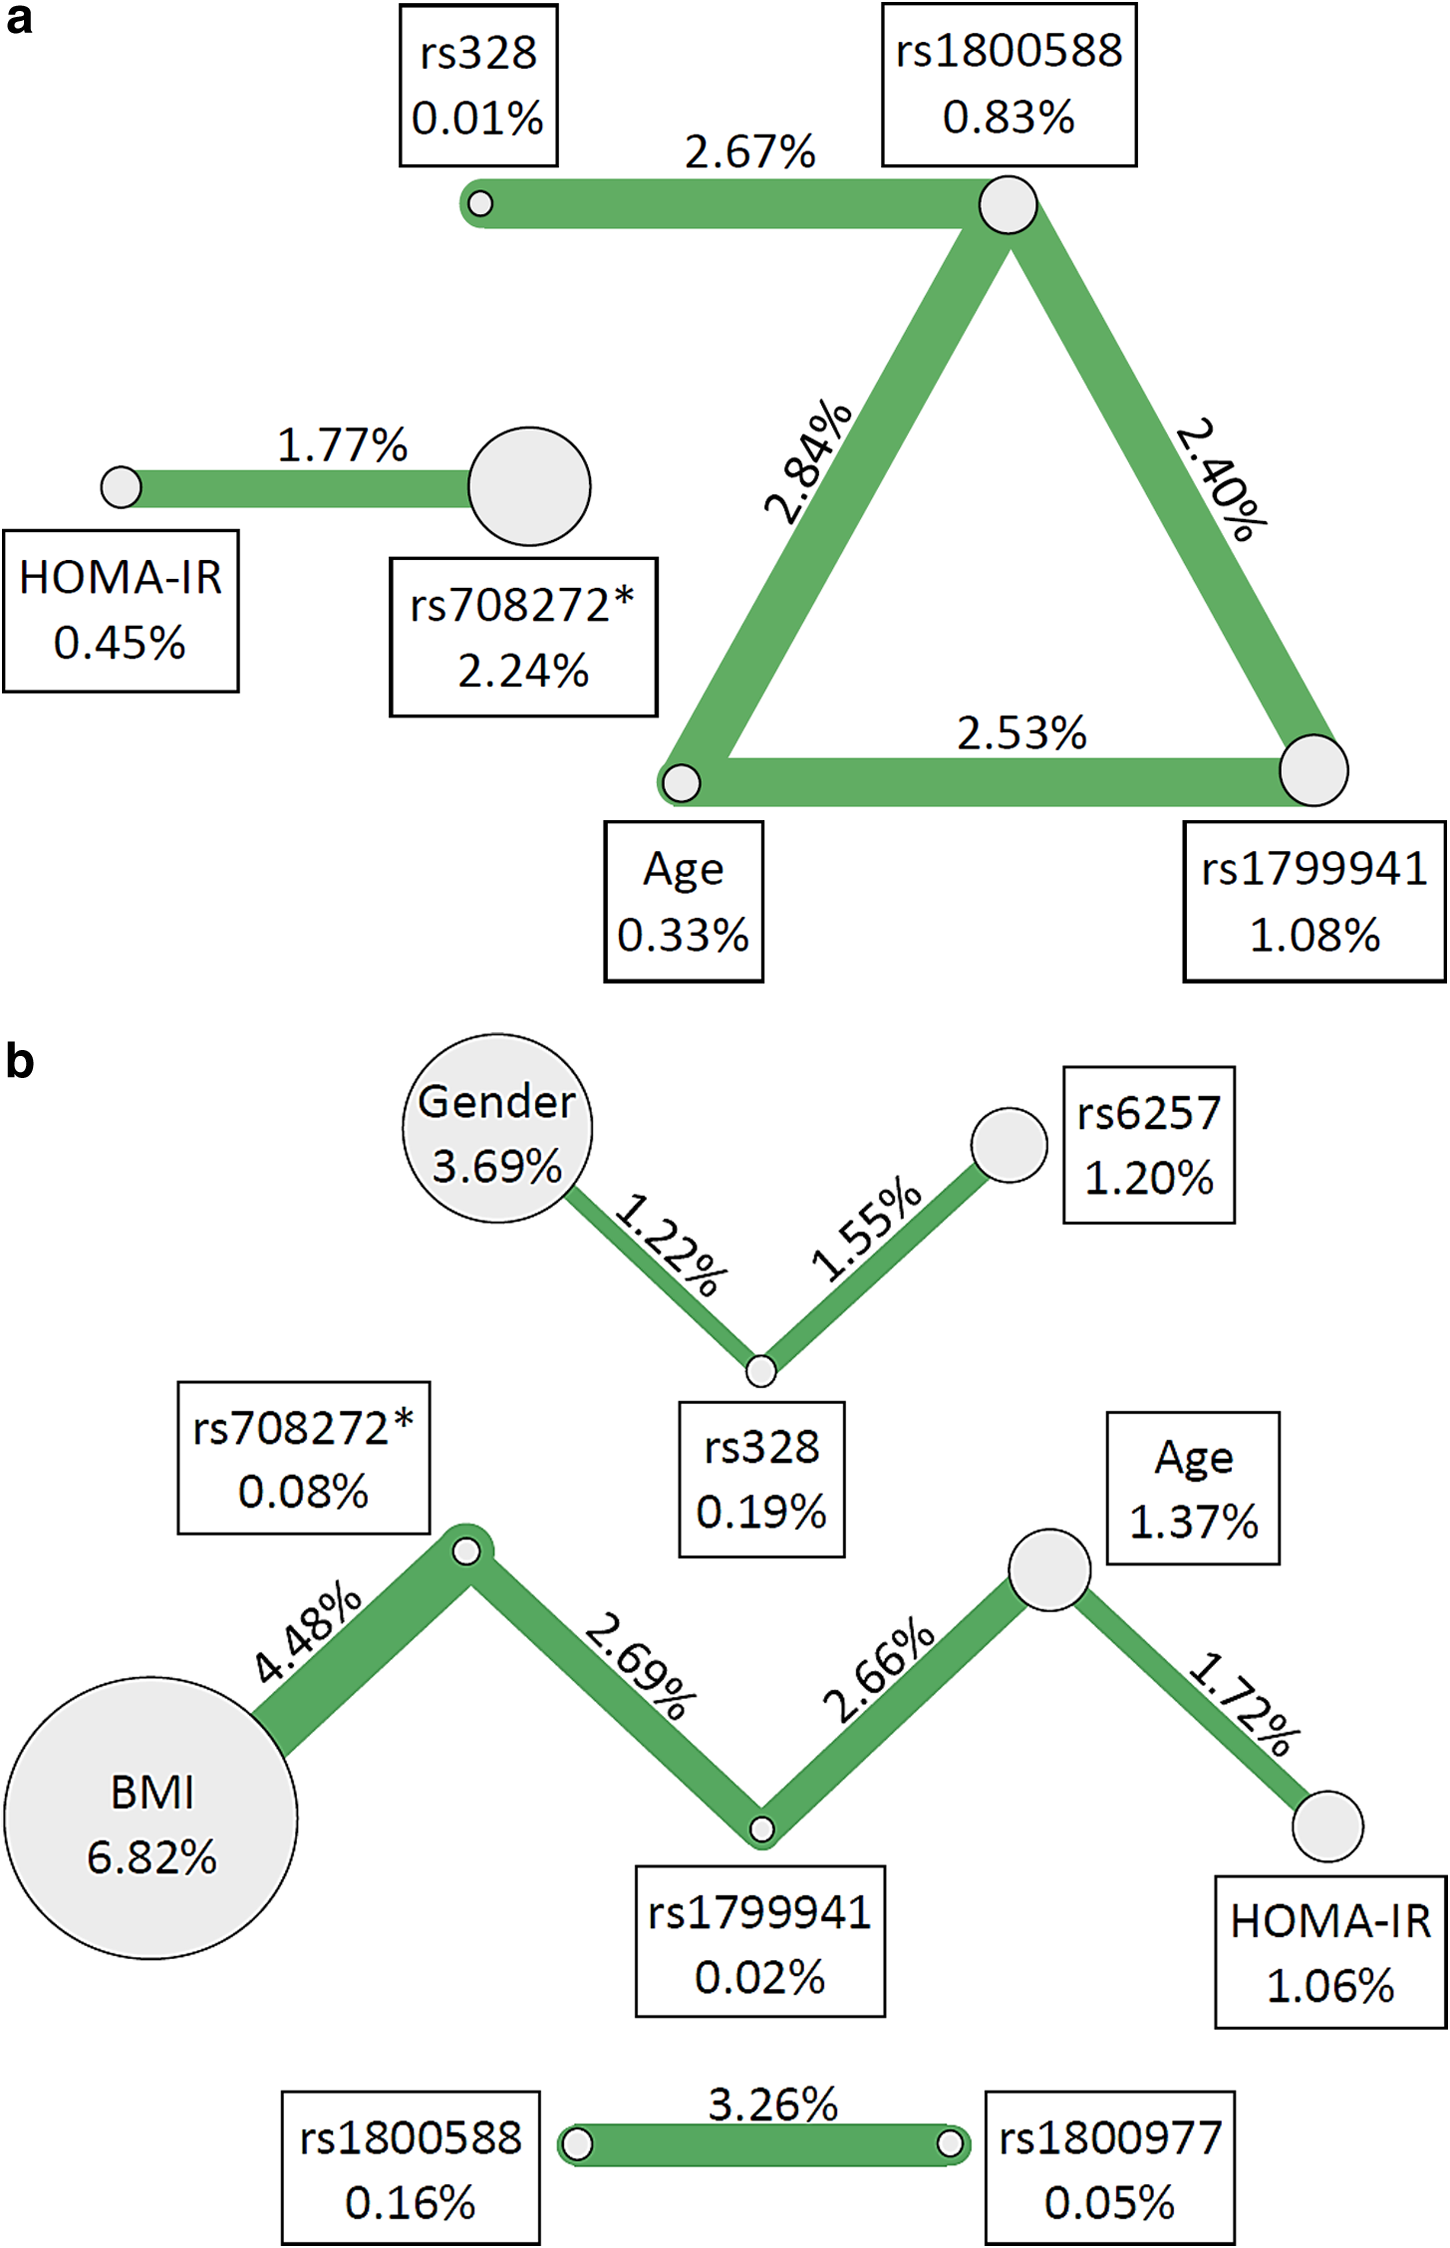
ViSEN pairwise interaction results for select SNPs and biological variables associated with <a>Low HDL-C susceptibility and <b>High TG susceptibility. Nodes and connections correspond to pairwise interactions that were statistically significant with IG>1.00%. Nodes represent single variables, with the ViSEN Information Gain (IG) listed in each adjacent box; connecting lines represent pairwise interactions between specified nodes with the interaction IG shown above the corresponding line. Line thickness corresponds to interaction strength, with thicker lines representing stronger interactions. *The specified variable had a significant main effect in previous studies.
Statistically significant interaction IG percentages are highlighted in
Only interactions with IG>1.00% and p<0.05 in at least one dataset (full, male, female) are presented above.
Information Gain (IG): Percentage of information gained about 1Low HDL-C status and 3High TG Status from only the interaction effect, controlling for the main effects of both independent variables; 2Information Gain p-value is based on 1000 permutations; *Interaction replicated across subsets; –: Not applicable.
When the TG dataset was considered for pairwise analysis, seven significant interaction effects were generated in the full dataset, the largest of which was the model containing rs708272 and BMI (IG=4.48%, p<0.001) (Table 4b, Fig. 1b). Three significant interactions were found in the male subset; the strongest model contained rs1800977 and rs1800588 (IG=5.39%, p=0.009) (Table 4b, Supplementary Fig. S2a). The female subset yielded nine significant interactions, with the largest IG from an rs708272–rs1799941 interaction (IG=5.87%; p=0.001) (Table 4b, Supplementary Fig. S2b). In total, two pairwise interactions replicated across all three datasets. The interaction between rs708272 and BMI had IG's of 4.48% (p<0.001), 5.18% (p=0.026), and 4.80% (p=0.003) for the full, male and female datasets, respectively. The pairwise interaction between rs1800977 and rs1800588 had a full dataset IG of 3.26% (p=0.002), a male IG of 5.39% (p=0.009), and a female IG of 4.19% (p=0.010). Additionally, two pairwise interactions replicated across the full and female datasets: rs708272 and rs1799941 had an IG of 2.69% (p=0.011) in the full dataset and an IG of 5.87% (p=0.001) in the female sample. The second replicated interaction was between rs328 with rs6257, with an IG of 1.55% (p=0.006) in the full dataset and an IG of 3.95% (p=0.001) in females.
Analysis of Low HDL-C and High TG higher-order interaction effects (three variable models)
Higher-order interaction analyses (i.e., three variables) in the full dataset for Low HDL-C revealed eleven significant interactions (Table 5a, Fig. 2). The largest effect was observed in the model containing rs1800977, rs708272, and age (IG=6.20%, p=0.046). The male dataset produced ten significant interactions with a top IG of 5.19% for the rs1800977, rs1800588, and rs708272 interaction (p=0.040) (Table 5a, Supplementary Fig. S3a), and the female dataset had five significant interactions, with the interaction between rs1800588, rs708272, and rs6257 yielding the largest IG of 6.06% (p=0.031) (Table 5a, Fig. S3b). Though no significant three way interactions replicated across all three datasets, four significant interactions replicated across the full and male datasets, indicating that the strength of the male IG was driving the IGs in the full dataset. The four models were: rs1799941, HOMA-IR and age (full IG=2.89%, male IG=4.70%); rs708272, rs1799941, and BMI (full IG=2.78%, male IG=4.38%); rs1800588, rs1799941, and BMI (full IG=2.59%, male IG=4.65%); and rs1800977, rs1800588, and rs328 (full IG=2.38%, male IG=4.01%). Additionally, two other interactions replicated across the male and female data subsets, but were not significant in the full dataset (rs328, rs1799941 and BMI; rs1800588, rs6257 and BMI) (Table 5a). This indicates that the directionality of the interaction effects for males and females were likely qualitatively different, so that in the full data, the IG lacked significant strength.
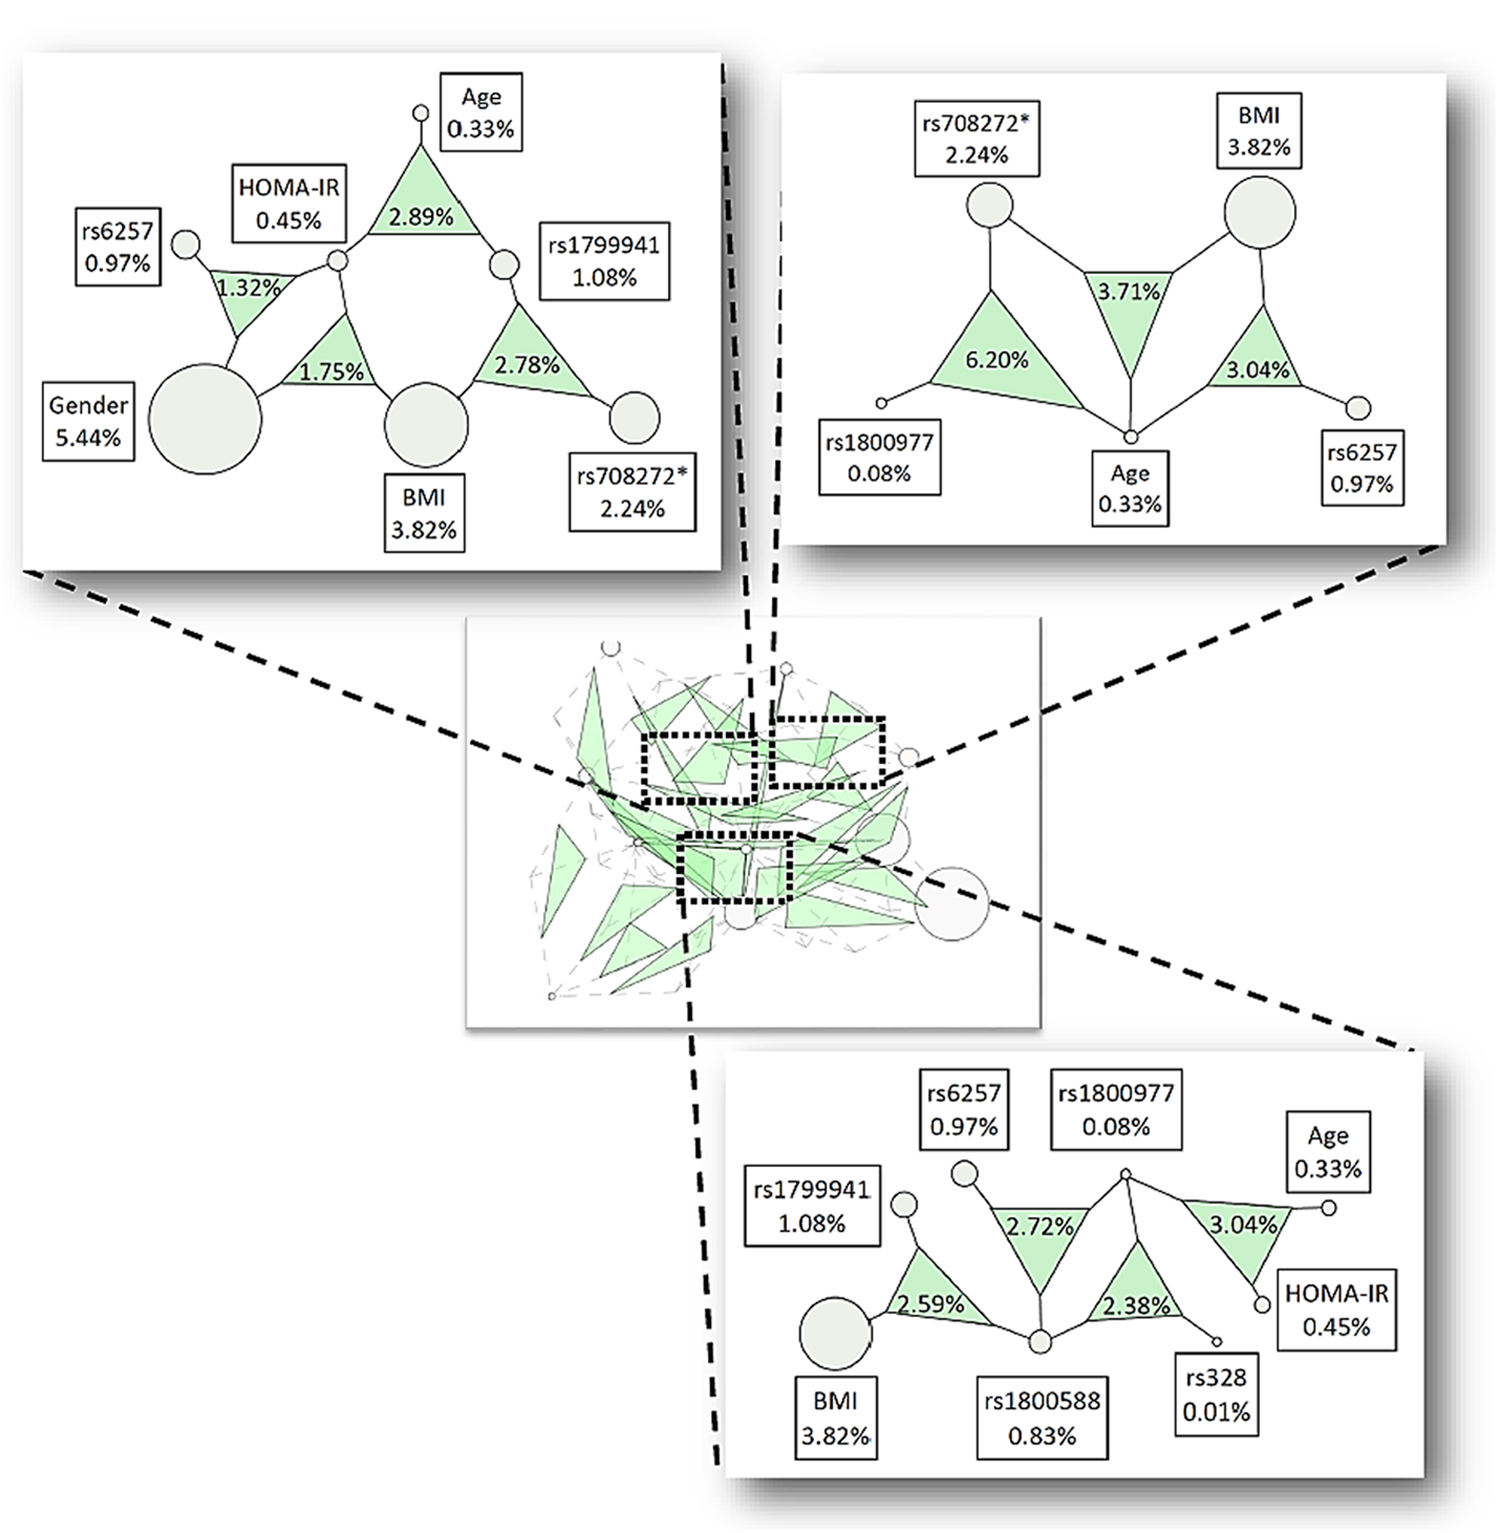
ViSEN three-way interaction results for select SNPs and biological variables associated with Low HDL-C susceptibility. Nodes and shaded triangles correspond to three-way interactions that were statistically significant with IG>1.00%. Inset picture depicts the genetic landscape of all three-way interactions meeting the above criteria. Nodes represent single variables with the ViSEN Information Gain (IG) listed in each adjacent box; shaded triangles represent three-way interactions between specified nodes, with the three-way IG listed in each triangle. The triangle area corresponds to interaction strength, with larger triangles representing stronger interactions. *The specified variable had a significant main effect in previous studies.
Statistically significant interaction IG percentages are highlighted in
Only three variable interactions with IG>1.00% and p<0.05 in either the full dataset and/or at least one of the gender-defined subsets are presented above.
Information Gain (IG): Percentage of information gained about 1Low HDL-C status and 3High TG status from considering the interaction, controlling for all lower order interaction effects and independent variable main effects; 2Information Gain p-value is based on 1000 permutations.
In the three-way analyses of the TG phenotype, the full dataset generated three significant interactions with an IG greater than 1% (Table 5b, Fig. 3). The largest IG was 3.06% (p=0.022), between rs1800588, age, and BMI. The male subset of data produced five significant interactions, of which the model with rs328, rs1799941, and age, had the largest IG (4.75%; p=0.039) (Table 5b, Supplementary Fig. S4a). Females had the most significant three-way interactions, with nine (Table 5b, Supplementary Fig. S4b). The largest IG was 5.88% (p = >0.001) and was for the model with rs1800977, rs1800588, and BMI. Of the fourteen total significant interactions, none replicated across all three subsets of data, but three replicated across two subsets (Table 5b). The interaction between rs1800588, age, and BMI replicated across the full and male subsets with IG's of 3.06% (p=0.022) and 3.73% (p=0.030), respectively. The interaction between rs1800588, rs328, and rs6257 replicated across the full and female cohorts with IG's of 1.75% (p=0.014) and 3.83% (p=0.015) respectively, and the interaction between rs6257, age, and BMI, replicated across the male and female cohorts with IG's of 2.09% (p=0.033) and 2.84% (p=0.049), respectively. As with the Low HDL-C analyses, interactions that were significant in the full dataset and one of the gender subsets, have a full IG that is likely driven by a single gender subset. The interaction that had significant IG's in both genders but not the full dataset likely had different effects in the male and female subsets.
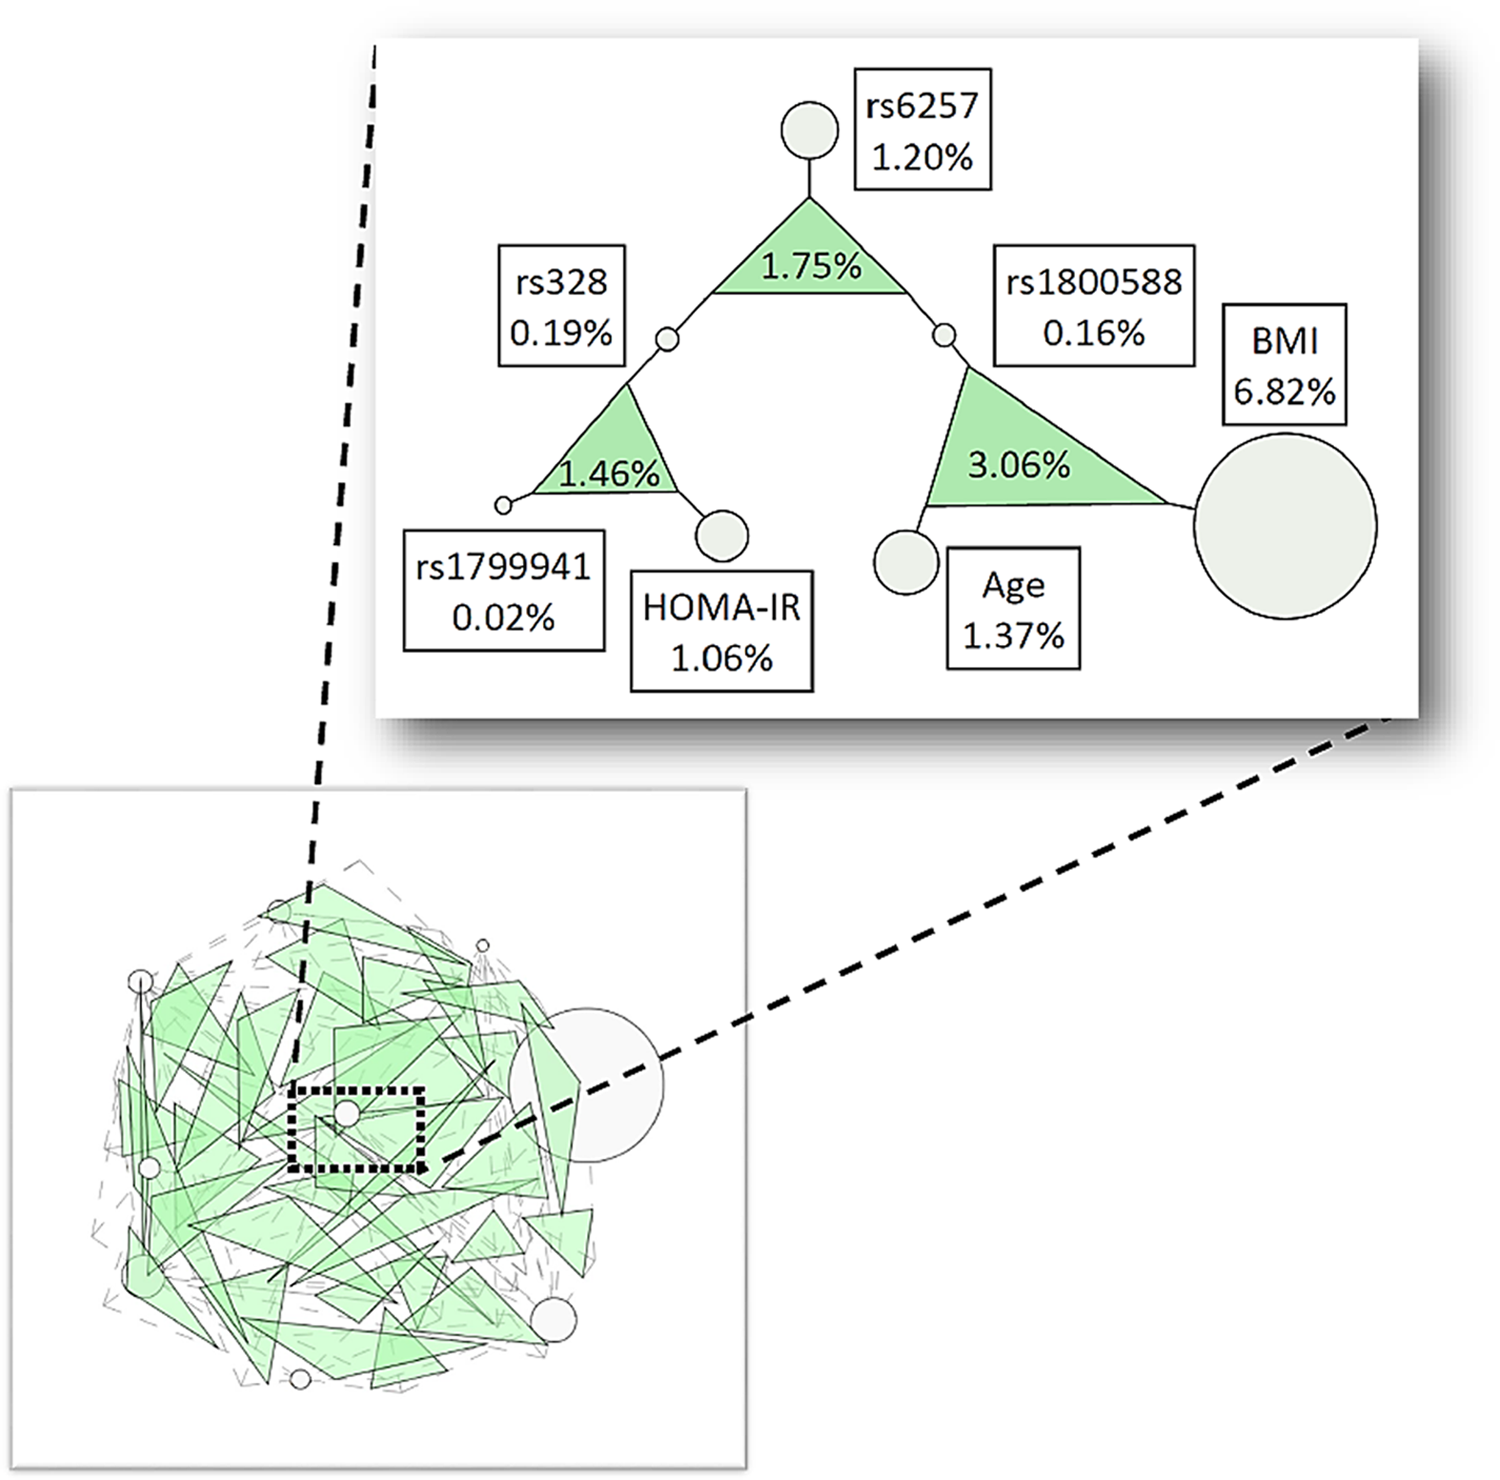
ViSEN three-way interaction results for select SNPs and biological variables associated with High TG susceptibility. Nodes and shaded triangles correspond to three-way interactions that were statistically significant with IG>1.00%. Inset picture depicts the genetic landscape of all three-way interactions meeting the above criteria. Nodes represent single variables with the ViSEN Information Gain (IG) listed in each adjacent box; shaded triangles represent three-way interactions between specified nodes, with the three-way IG listed in each triangle. The triangle area corresponds to interaction strength, with larger triangles representing stronger interactions.
Discussion
Plasma lipids are intensely studied risk factors for cardiovascular disease but few have addressed these traits in pediatric populations. In this study, we analyze six SNP data and cardiometabolic variables to validate an interaction network that is constructed based on statistical analysis. We perform ViSEN methodology to assess epistatic interactions associated with low HDL-C or high TG in children. Although we do not observe any overlapping associations between the two dyslipidemia phenotypes (high TG/low HDL) using single locus analysis, higher order interaction analyses (i.e., three variables) in the full dataset for low HDL-C and high TG phenotypes revealed replicating associations. The largest effects are seen in the models containing rs1800977, rs708272, age and rs1800588, age, BMI, respectively. To the best of our knowledge, our observation is the first report that shows three orders of effects in determining lipid levels in children and adolescents. Such an approach embraces the complexity of genetic interactions underlying lipid levels in children.
Highlights of longitudinal tracking studies display that dyslipidemia originates early in life (Berenson et al., 1998). There is emerging evidence that childhood CVD risk factors, such as high triglycerides, are independently predictive of adult CVD (Morrison et al., 2009). The exact mechanisms of this early-life origin are unclear, but a likely mediator is at the molecular level. Dyslipidemia in childhood presents a summary of the impacts of various factors such as genetic variations, epigenetics, gene–gene and gene–environment interactions, ethnic characteristics, growth pattern during childhood, obesity, insulin resistance, socioeconomic status, dietary and physical activity habits (Kelishadi et al., 2014). A longitudinal adolescent twin study involving 965 families, however, found little evidence of environment effects on the variation in lipids (Ijzerman et al., 2005). Improved understanding of the causes of pediatric dyslipidemia promises the opportunity to develop new diagnostic and therapeutic strategies. The importance of early identification of gene–gene and gene–environment interactions for dyslipidemia can unravel the underlying biological mechanism of the origins of CVD and enable identification of those at risk for early-life disease presentation (Kelishadi et al., 2014). Prompt identification of individuals at increased risk is fundamental to developing effective primordial and primary prevention of cardiovascular disease.
Known environmental and genetic factors explain only a small proportion of the variability in lipid levels, a major obstacle to prevention. This partly reflects the research focus on the manifestation of the disease in adulthood rather than focusing on childhood, a critical but poorly understood period in the pathogenesis of dyslipidemia. The Cardiovascular Risk in Young Finns Study is a follow-up study aiming to reveal cardiovascular risk factors and atherosclerosis precursors from Finnish children and adolescents (Tikkanen et al., 2011). Tikkanen et al. report the effects of individual single-nucleotide polymorphisms on lipids in 2443 participants of the Cardiovascular Risk in Young Finns study cohort (between ages 3 and 45 years) (Tikkanen et al., 2011). SNPs were selected based on genome-wide significance (p<5.0×10⁻⁸) in a recent meta-analysis of >100,000 individuals (Teslovich et al., 2010); in total 47 SNPs for HDL-C, 37 SNPs for LDL-C, 52 SNPs for total cholesterol (TC), and 32 SNPs for TG were included in their analysis. Of the included SNPs, four variants (LIPC, LPL, ABCA1, CETP) overlapped with the SNPS analyzed in our study. The authors report that previously identified lipid loci are associated with lipid levels in children and adolescents and explain up twice the lipid variation in children compared with adults. Sex hormone levels and SHBG have important effects on HDL-C and insulin resistance among children and adolescents (Agirbasli et al., 2010). We report that HDL-C dataset has two significant models, both of which contain SHBG SNP, rs1799941, that replicate across gender stratified subsets. Our findings support prior observations that SHBG levels relate to increased HDL-C levels among prepubertal and adolescent girls (Agirbasli et al., 2010).
The important observation in our analysis is that the higher order interaction analyses (i.e., three variables) in the full dataset for low HDL-C and high TG phenotypes reveal replicating associations. In a previous study in Korean children, Go et al. confirmed significant associations (LPL and LIPC SNPs) of genetic predisposition to lipoprotein concentrations (Go et al., 2012). Their observations show that the genetic interaction effects of circulating lipid levels (TG and HDL-C) overlap to a large extent in childhood. Identifying genetic interactions that associate with dyslipidemia in children will provide new opportunities to interventions to alter the risk trajectory and potentially reduce CVD incidence later in life.
Our study comes with limitations, given the smaller number of subjects available. Many factors can contribute to the lipid levels in children such as diet, taste perception, culture, quality of life, and physical activity status of the students (Mounayar et al., 2014), although the high heritability of these traits and the prior work supporting a strong genetic component minimize the impact of this limitation (Elder et al., 2009; Hunt et al., 1989; Knoblauch et al., 1997).
Also, since all study participants were recruited from schools servicing children from families of low to middle socioeconomic status in Istanbul, Turkey, it is possible that the lack of data on diet, physical activity, and socioeconomic status may not represent a major limit. Nonetheless, it is possible that environmental risk factors (i.e., diet or physical activity) can form epigenetic modification on genetic effects. Furthermore, the study was cross-sectional and the sample size was small. Lipid levels normally change with age among children and adolescents, however, our observations indicate that high-order genetic interactions exist and determine cardiometabolic risk criteria such as low HDL-C and high TG in this population.
Future studies are needed to integrate the computation of epistatic network statistics in ViSEN to extend the quantification measures to continuous traits (such as HDL-C and TG levels). Further analysis can translate statistical and computational findings to biological mechanisms and can help us gain a better understanding of lipid levels in children.
Replication of genetic studies in children in different populations is important for determining the dyslipidemia markers and lipid characterization of childhood for predicting adult dyslipidemia (Kelishadi et al., 2014; Morrison et al., 2009).
In conclusion, our results show the utility of the ViSEN methodology as a part of a system genetics approach to capture the complex gene–gene interactions between biological and cardiometabolic risk variants that likely influence risk of high TG or low HDL-C in children and adolescents. Our results also highlight novel overlapping genetic interactions affecting both high TG and low HDL. Further efforts can integrate population and laboratory-based studies, hence direct preventive efforts. Although not functional proof, this study demonstrates how integrating population-based statistical results can assist with interpretation of associations to provide a systems genetics approach to understanding cardiovascular disease susceptibility.
Footnotes
Acknowledgments
The study was funded by the Scientific Research Council of Turkey (TUBITAK) Project Number: 109S282.
Author Disclosure Statement
The authors declare that there are no conflicting financial interests.
References
Supplementary Material
Please find the following supplemental material available below.
For Open Access articles published under a Creative Commons License, all supplemental material carries the same license as the article it is associated with.
For non-Open Access articles published, all supplemental material carries a non-exclusive license, and permission requests for re-use of supplemental material or any part of supplemental material shall be sent directly to the copyright owner as specified in the copyright notice associated with the article.