




Abstract
Abstract
Major depressive disorder (MDD) is a highly prevalent, debilitating mental illness of importance for global health. However, its molecular pathophysiology remains poorly understood. Combined proteomics and metabolomics approaches should provide a comprehensive understanding of MDD's etiology. The present study reports novel “-omics” insights from a rodent model of MDD. Cerebellar samples from chronic mild stressed (CMS)-treated depressed rats and controls were compared with a focus on the differentially expressed proteins and metabolites using isobaric tags for relative and absolute quantitation (iTRAQ)-based proteomics and gas chromotography/mass spectrometry (GC-MS) metabolomics techniques, respectively. The combined analyses found significant alterations associated with cerebellar energy metabolism, as indicated by (1) abnormal amino acid metabolism accompanied by corresponding metabolic enzymatic alterations and disturbed protein turnover, (2) increased glycolytic and tricarboxylic acid (TCA) cycle enzyme levels paralleled by changes in the concentrations of associated metabolites, and (3) perturbation of ATP biosynthesis through adenosine accompanied by perturbation of the mitochondrial respiratory chain. To the best of our knowledge, this study is the first to integrate proteomics and metabolomics analyses to examine the pathophysiological mechanism(s) underlying MDD in a CMS rodent model of depression. These results can offer important insights into the pathogenesis of MDD.
Introduction
M
Current research points towards the involvement of the cerebellum in emotion and cognition (Schutter and Van Honk, 2005). Moreover, emerging evidence has indicated cerebellar abnormalities in MDD; specifically, smaller cerebellar and cerebellar vermal volumes have been found in MDD patients (Beyer and Krishnan, 2002; Shah et al., 1992). Neurobehavioral (Greer et al., 2005; Sweeney et al., 1998) and neuroimaging studies have associated MDD with abnormal cerebellar function (Kimbrell et al., 2002; Liu L. et al., 2012; Liu Z. et al., 2010; Nofzinger et al., 2005). Furthermore, previous findings have also shown cerebellar involvement in the stress response (Ito, 2006; Madtes and King, 1999; Mazzocchi et al., 1999; Sanchez et al., 2000). Based on the cerebellum's role in MDD and the stress response, we initially investigated rat cerebellar metabolic changes in a CMS model of depression by using a gas chromatography-mass spectrometry (GC-MS) metabolomics approach. The resulting CMS resilience-related metabolites may provide new insight into the pathophysiology underlying MDD (Shao et al., 2013).
To further investigate this phenomenon, hypothesis-free approaches—such as metabolomics and proteomics—are powerful tools in discovering novel molecules involved in the pathophysiology of various disease states (Kitano, 2002). Employing these “-omics” approaches, our research group has performed a series of preclinical (Hu et al., 2013; Mu et al., 2007; Yang et al., 2013) and clinical (Xu et al., 2012; Zheng et al., 2012; Zheng et al., 2013a, 2013b, 2013c) investigations on depression. With specific respect to the cerebellum, our research group previously investigated cerebellar metabolic changes in a CMS rodent model of depression by using a gas chromatography-mass spectrometry (GC-MS) metabolomics approach, which revealed several CMS resilience-related metabolites that may be involved in the pathophysiology underlying MDD (Shao et al., 2013).
As opposed to single “-omics” techniques, researchers have recently begun to employ multiple “-omics” approaches to explore disease states more deeply (Joyce and Palsson, 2006; Snyder et al., 2014). Combining proteomics analysis with metabolic profiling is especially attractive, since metabolomics provides information in forming a functional interpretation of proteomics data, while proteomics analysis contributes to a better understanding of metabolomics data by highlighting participating enzymes and/or enzymatic pathways. The combination of proteomics and metabolomics has aided in elucidating the molecular mechanisms of various disorders, including cancer (Cai et al., 2010; Ma et al., 2012), psychiatric disorders (Filiou et al., 2011; Wesseling et al., 2013; Zhang et al., 2011), and cardiovascular disease (Mayr et al., 2008). Among these studies combining proteomics and metabolomics approaches, one research group has identified biomarker candidates and hippocampal metabolic changes with paroxetine treatment (Webhofer et al., 2012). However, no combined “-omics” studies of MDD have yet been performed.
Therefore, in order to develop a more c
Methods and Materials
Animal model
Rat cerebella collected from a previous study were utilized here for more in-depth proteomics and metabolomics analysis to characterize the molecular profiles associated with MDD (Shao et al., 2013). Detailed information on the construction of the animal model is provided in Shao et al. (2013). Briefly, 81 adult male Sprague–Dawley rats were randomly divided into CMS and control groups. All rats were housed in a pathogen-free environment at room temperature (22°–25°C) and maintained on rat chow and tap water ad libitum before the application of CMS. Animal care and treatment followed the National Institute of Health Guide for the Care and Use of Laboratory Animals (NIH Publications No. 80-23, revised 1996).
The CMS group was exposed to the following stressors in random order: paired housing, 45° cage tilt along the vertical axis, soiled cage (300 mL water spilled onto bedding), exposure to an empty water bottle immediately following a period of acute water deprivation, stroboscopic illumination (300 flashes/min), continuous overnight illumination, and white noise. The CMS procedure was carried out over a period of 4 weeks. Control rats were not disturbed during this period. At the end of every week, the sucrose preference test (SPT) was applied to all rats. Following stress exposure, CMS-treated rats showing a sucrose preference below 65% were selected and defined as “depressed.” At completion of the CMS procedure, rats were sacrificed by dislocation of the cervical vertebrae, and whole brains were removed. The cerebella were dissected from the brain, weighed, rapidly frozen with liquid nitrogen, and stored at −80°C until later analysis.
Metabolomics analysis
For GC-MS metabolomics analysis, metabolite extracts were prepared from 16 rat cerebella (n=8 for control rats, n=8 for depressed rats). Cerebellar samples were derivatized with methoxamine hydrochloride and N,O-bis(trimethylsilyl) trifluoroacetamide (1% trimethylchlorosilane was added) and injected into GC-MS. Details of derivatization and GC-MS conditions have been described in a previous publication (Shao et al., 2013). Data analysis was performed with the exported NetCdf file format by TagFinder. Peak areas of extracted ions were normalized to the internal standard L-13C6,15N-isoleucine.
Proteomics analysis
Protein digestion and iTRAQ labeling
Protein samples from another set of control subjects (n=8) were pooled for proteomics analysis. In addition, protein samples from another set of depressed subjects (n=8) were pooled for proteomics analysis. Proteins were extracted according to a previously described method (Datta et al., 2011). Protein concentration was determined by the Bradford Protein Assay. A total of 100 μg of protein in each sample was denatured, alkylated, and digested with sequencing-grade modified trypsin with a protein-to-enzyme ratio of 30:1 at 37°C overnight and then labeled with the iTRAQ reagent tag using 8-plex iTRAQ kits according to manufacturer's instructions (ABSciex Inc., USA). The depressed samples were then labeled with iTRAQ tags 115 and 116, while the control samples were labeled with tags 119 and 121. After a 2-hour incubation at room temperature, all four labeled samples were mixed at equal ratios.
Strong cation exchange (SCX) fractionation
The labeled samples were fractionated using a high-performance liquid chromatography (HPLC) system (Shimadzu, Japan) connected to an SCX column (Luna 5 μm column, 4.6 * 250 mm, 5 μm, 100 Å; Phenomenex, USA). The retained peptides were eluted using buffer A (10 mM KH2PO4 in 25% acetonitrile; pH 3.0) and buffer B (500 mM KCl, 10 mM KH2PO4 in 25% acetonitrile, pH 3.0), and the fractions were collected in 1.5-mL microfuge tubes. The flow rate was set at 1 mL/min. The following gradient was applied: 50 min of 100% buffer A; from minutes 50–51, the buffer B concentration was increased to 5%; from minutes 51–66, the buffer B concentration was increased to 30%; from minutes 66–71, the buffer B concentration was increased to 50% and then maintained for 5 min; and from minutes 76–81, the buffer B concentration was increased to 100% and then maintained for 10 min; and from minutes 91–96, the buffer A concentration was increased to 100%. All solutions were freshly prepared and filtered through a 0.22-μm membrane. The collected fractions were desalted with a Strata X C18 column (Phenomenex), concentrated to dryness using a vacuum centrifuge, and reconstituted in 0.1% formic acid for LC-MS/MS analysis.
LC-MS/MS analysis
Experiments were performed on a TripleTOF 5600 mass spectrometer (AB SCIEX Inc., USA) coupled to a Nano HPLC system (Shimadzu, Japan). The peptide mixture was separated on a 10-cm C18-reversed phase column (75 * 100 mm, 5 μm, 300 Å) with a constant flow rate of 400 nL/min (Solution A, 0.1% formic acid; Solution B, 0.1% formic acid in acetonitrile) over 65 min. A linear LC gradient profile was used to elute the peptides from the column. After sample injection, the column was equilibrated with 5% Solution B for 10 min, and the following gradient schedule was then initiated: 10 min of 5% buffer B; from minutes 10–40, the buffer B concentration was increased to 30%; from minutes 40–45, the buffer B concentration was increased to 60%; and from minutes 45–48, the buffer B concentration was increased to 80% and then held for 7 min before ramping back down to the initial solvent conditions. The mass spectrometer was set to perform data acquisition in the positive ion mode with a selected mass range of 400–1800 Da. Peptides with +2 to +5 charge states were selected for tandem mass spectrometry (MS/MS), and the time of summation of MS/MS events was set at 0.25 s.
Protein identification and quantitation
The MS data were exported to a MGF format and searched against the Rat IPI database (version 3.87) using the Mascot search engine (version 2.3.01). The peptide and MS/MS tolerances were both set at 0.1 Da. The modifications used were as follows: fixed, carbamidomethyl (C); variable, oxidation (M), Gln→Pyro-Glu (N-term Q), iTRAQ 8-plex (K), iTRAQ 8-plex (Y), and iTRAQ 8-plex (N-term). The maximum missed cleavages were one. The significance level was set at p<0.05. All identified proteins were based on at least two peptides. In addition, a decoy database search strategy was used to check the false discovery rate (FDR), and the identity FDR for these data was approximately 0.4%. All data were exported into Excel for further manual analysis and interpretation. Relative protein quantitation was performed based on the relative intensities of reporter ions released during MS/MS peptide fragmentation. Relative intensities of the two reporter ions for each peptide identifier for a protein were used for averaging and assessing percentage variability to determine the relative protein quantities in each rat cerebellar sample.
Bioinformatic analysis
DAVID Bioinformatics Resources v6.7 (http://david.abcc.ncifcrf.gov/home.jsp) (Dennis et al., 2003) was used to obtain the gene ontology (GO) terms enrichment analysis that highlighted the most relevant GO and Kyoto encyclopedia of genes and genomes (KEGG) terms associated with the lists of modulated proteins resulting from the comparisons. Only those GO terms yielding a p<0.05 using a Fisher's exact test were considered significantly enriched in each gene list. The KEGG pathways with a corrected p<0.05 were considered significant. These pathways were classified into hierarchical categories according to KEGG. The protein interactions analysis was performed with STRING 9.0 (http://www.string-db.org/).
Statistical analysis
All results were expressed as mean±standard error of the mean (SEM). The statistical analyses were performed with SPSS 16.0. The data for the sucrose preference test (SPT) were analyzed by means of a repeated measurement analysis of variance (ANOVA) with treatment (CMS and control) and time (baseline; week 1, 2, 3, 4) as two factors. In order to detect significant differences between the experimental groups and weeks, multivariate analysis of variance (MANOVA) and Bonferroni post-tests were also used where appropriate. The significance level was set at p<0.05.
Results
Behavioral analysis
Behavioral analysis of depressed (anhedonic) versus control rats have been described in a previous publication (Shao et al., 2013). Briefly, after CMS exposure, sucrose preference was significantly decreased in depressed subjects as compared to control subjects (p<0.001), indicating that the CMS protocol had given rise to the reductions in sucrose preference. Therefore, the classic CMS rat model of depression was validated.
Differential metabolic analysis
We previously employed a GC-MS metabolomics approach to characterize the molecular changes associated with stress resilience in the rat cerebellum by comparing depressed (anhedonic), CMS-resilient, and control subjects. The comparative results of depressed and control rats can be seen in Shao et al. (2013). Twelve metabolites were significantly increased (glycine and adenosine) or decreased (3-hydroxybutyric acid, creatinine, 2,5-dihydroxypyrazine, pantothenic acid, dihydroxyacetone phosphate, proline, phenylalanine, tyrosine, lysine, and glutamine) in depressed rat cerebella relative to controls. These 12 metabolites are primarily involved in energy metabolism and amino acid metabolism (Fig. 1).
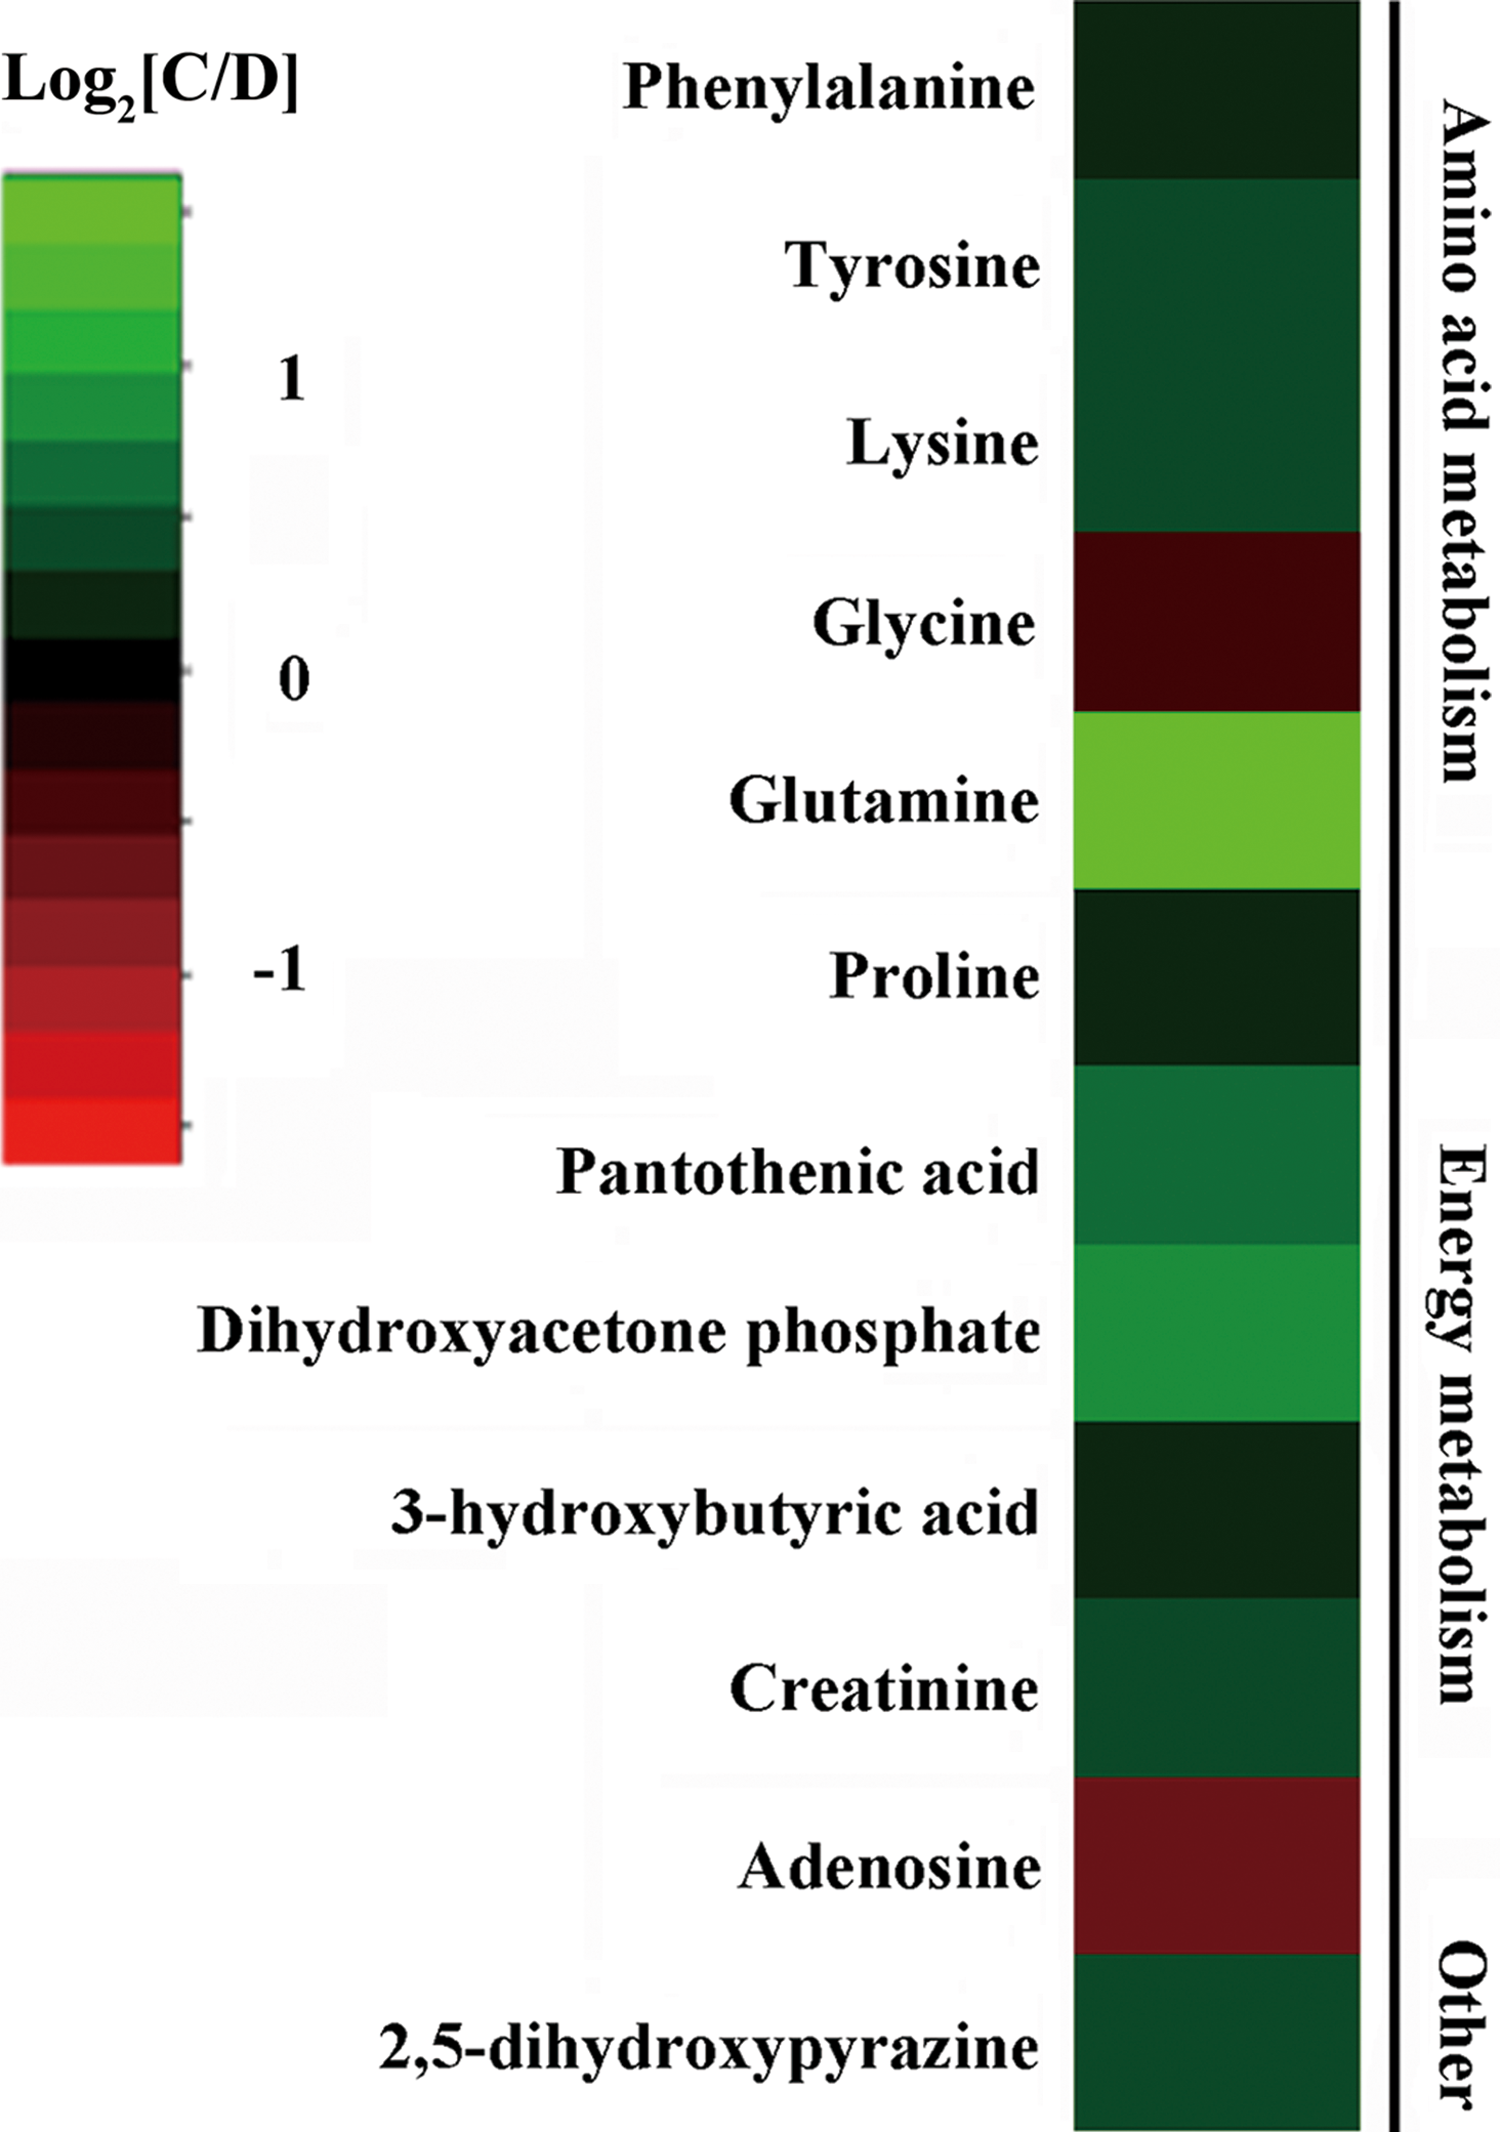
Heat map of metabolite changes in depressed rat cerebella. Metabolites in red indicate increased concentrations, and in green indicate decreased concentrations in the depressed rats compared to controls. C, Control; D, Depressed.
Identification of differentially expressed proteins
iTRAQ labeling coupled with 2D LC-MS/MS was conducted to profile the differentially expressed cerebella proteins between depressed rats and controls. Peptides from two sets of technical replicates were labeled with iTRAQ reagents. The scatter plot comparing the quantified proteins demonstrates a good correlation with an R2 value of 0.968 and 0.993 for 115, 116 and 119, 121 technical replicate results, respectively (Supplementary Fig. S1; supplementary material is available online at www.liebertpub.com/omi). A total of 1815 proteins were identified according to the aforementioned criteria. Differentially regulated proteins (1.2-fold change with p<0.05) were selected for further analysis. These cut-offs were selected based on literature investigating the reproducibility of iTRAQ™ quantification (Moulder et al., 2010). According to this criterion, 396 proteins exhibited significant differential expression between CMS and control rats (Supplementary Table S1).
GO analysis
Among the 396 significantly differentiated proteins, 257 proteins were annotated in certain GO categories. There were six significant GO terms for these differential proteins in Biological Process, five significant GO terms for these differential proteins in Cellular Component and three significant GO terms for these differential proteins in Molecular Function, respectively (Fig. 2). The main biological functional categories represented were cellular process, localization, metabolic process, and cellular component organization. According to the molecular functional properties, these proteins were mainly classified into binding, catalytic activity, and transporter activity.

Gene ontology (GO) classification of the differentially expressed proteins.
Altered biological pathways by KEGG
A total of 396 differential proteins were analyzed for KEGG over-representation of pathways to obtain functional insights into the differences between CMS and control rats. Of the 396 differential proteins, 257 proteins mapped onto the KEGG database. The significantly enriched KEGG pathways are listed in Table 1. The top three-ranking canonical KEGG pathways (in rank order) are Alzheimer's disease, Huntington's disease, and oxidative phosphorylation, respectively.
The pathway ranking in this table is in order from high to low. The “mapping” number represents the number of annotated differential proteins in the pathway, while the “all” number represents the total number of proteins in the pathway.
Protein–protein interaction
All differential proteins were uploaded into the STRING 9.0 software to analyze protein interactions. It revealed that most enzymatic proteins and amino acid metabolism-related proteins interacted with each other (Supplementary Fig. S2). Consistent with our metabolomics findings, GO analysis revealed that the majority of proteins were involved in metabolic process and catalytic activity. As oxidative phosphorylation was a significantly enriched KEGG pathway, we exclusively focused on the energy metabolism and amino acid metabolism-related proteins at the proteomics level (Fig. 3). Other proteins, such as signaling and molecular transport proteins, were excluded from further analysis.
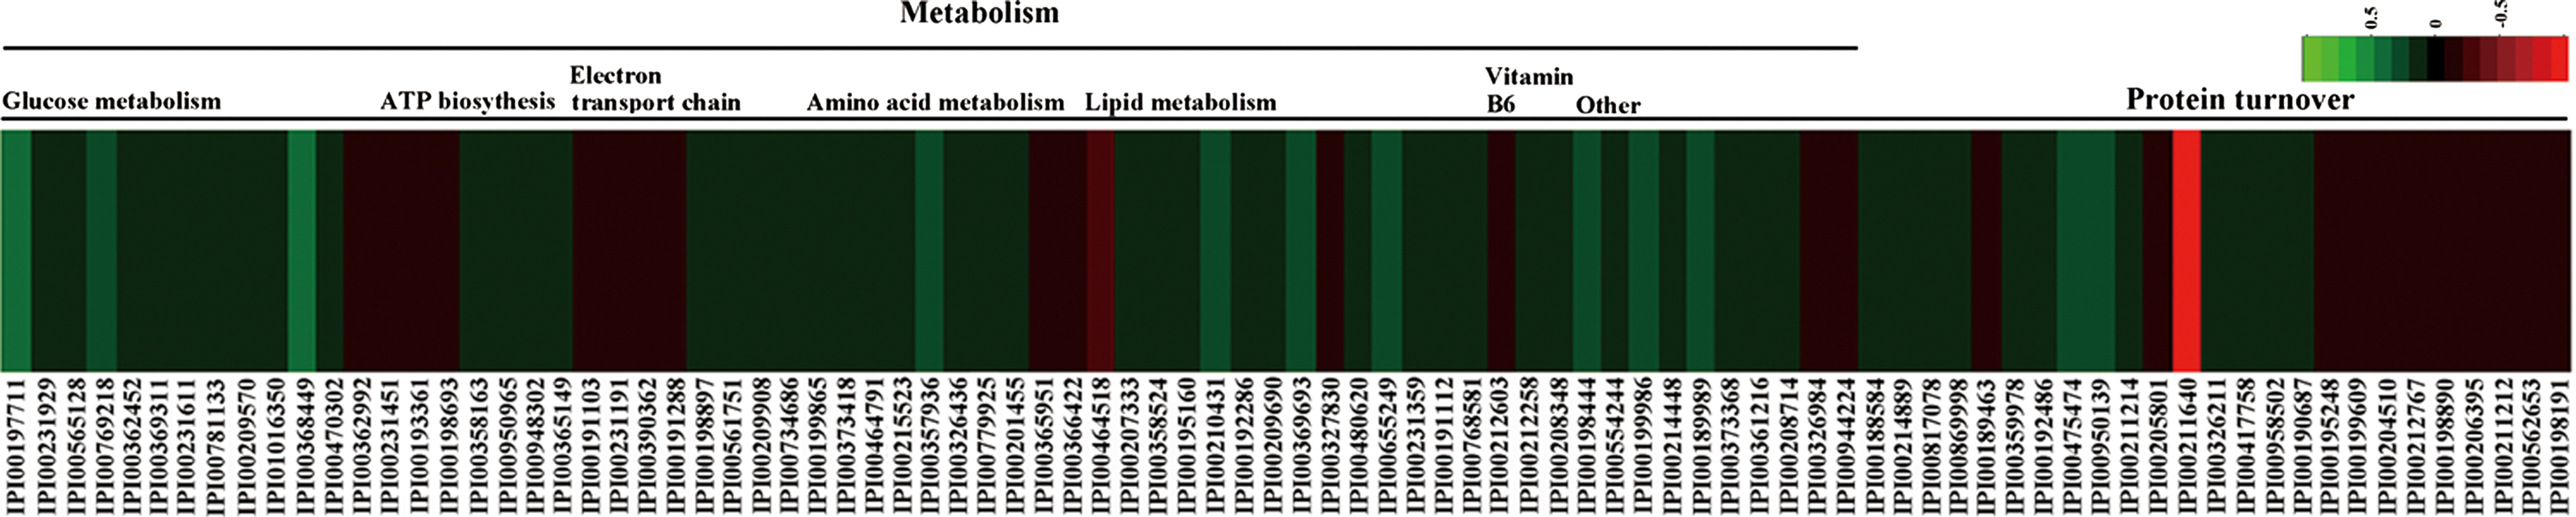
Heat map of differentially expressed energy metabolism and amino acid metabolism-related proteins in depressed rat cerebella. Proteins in red indicate increased levels, and in green indicate decreased levels in the depressed rats compared to controls.
Combining the proteomics and metabolomics findings demonstrated that depressed rats displayed (1) abnormal amino acid metabolism accompanied by corresponding metabolic enzymatic alterations and disturbed protein turnover, (2) increased glycolytic and tricarboxylic acid (TCA) cycle enzyme levels paralleled by changes in the concentrations of associated metabolites, and (3) perturbation of ATP biosynthesis through adenosine accompanied by perturbation of the mitochondrial respiratory chain. According to KEGG and Uniprot database (http://www.uniprot.org/), a schematic model of enzyme and metabolite changes is provided in Figure 4.
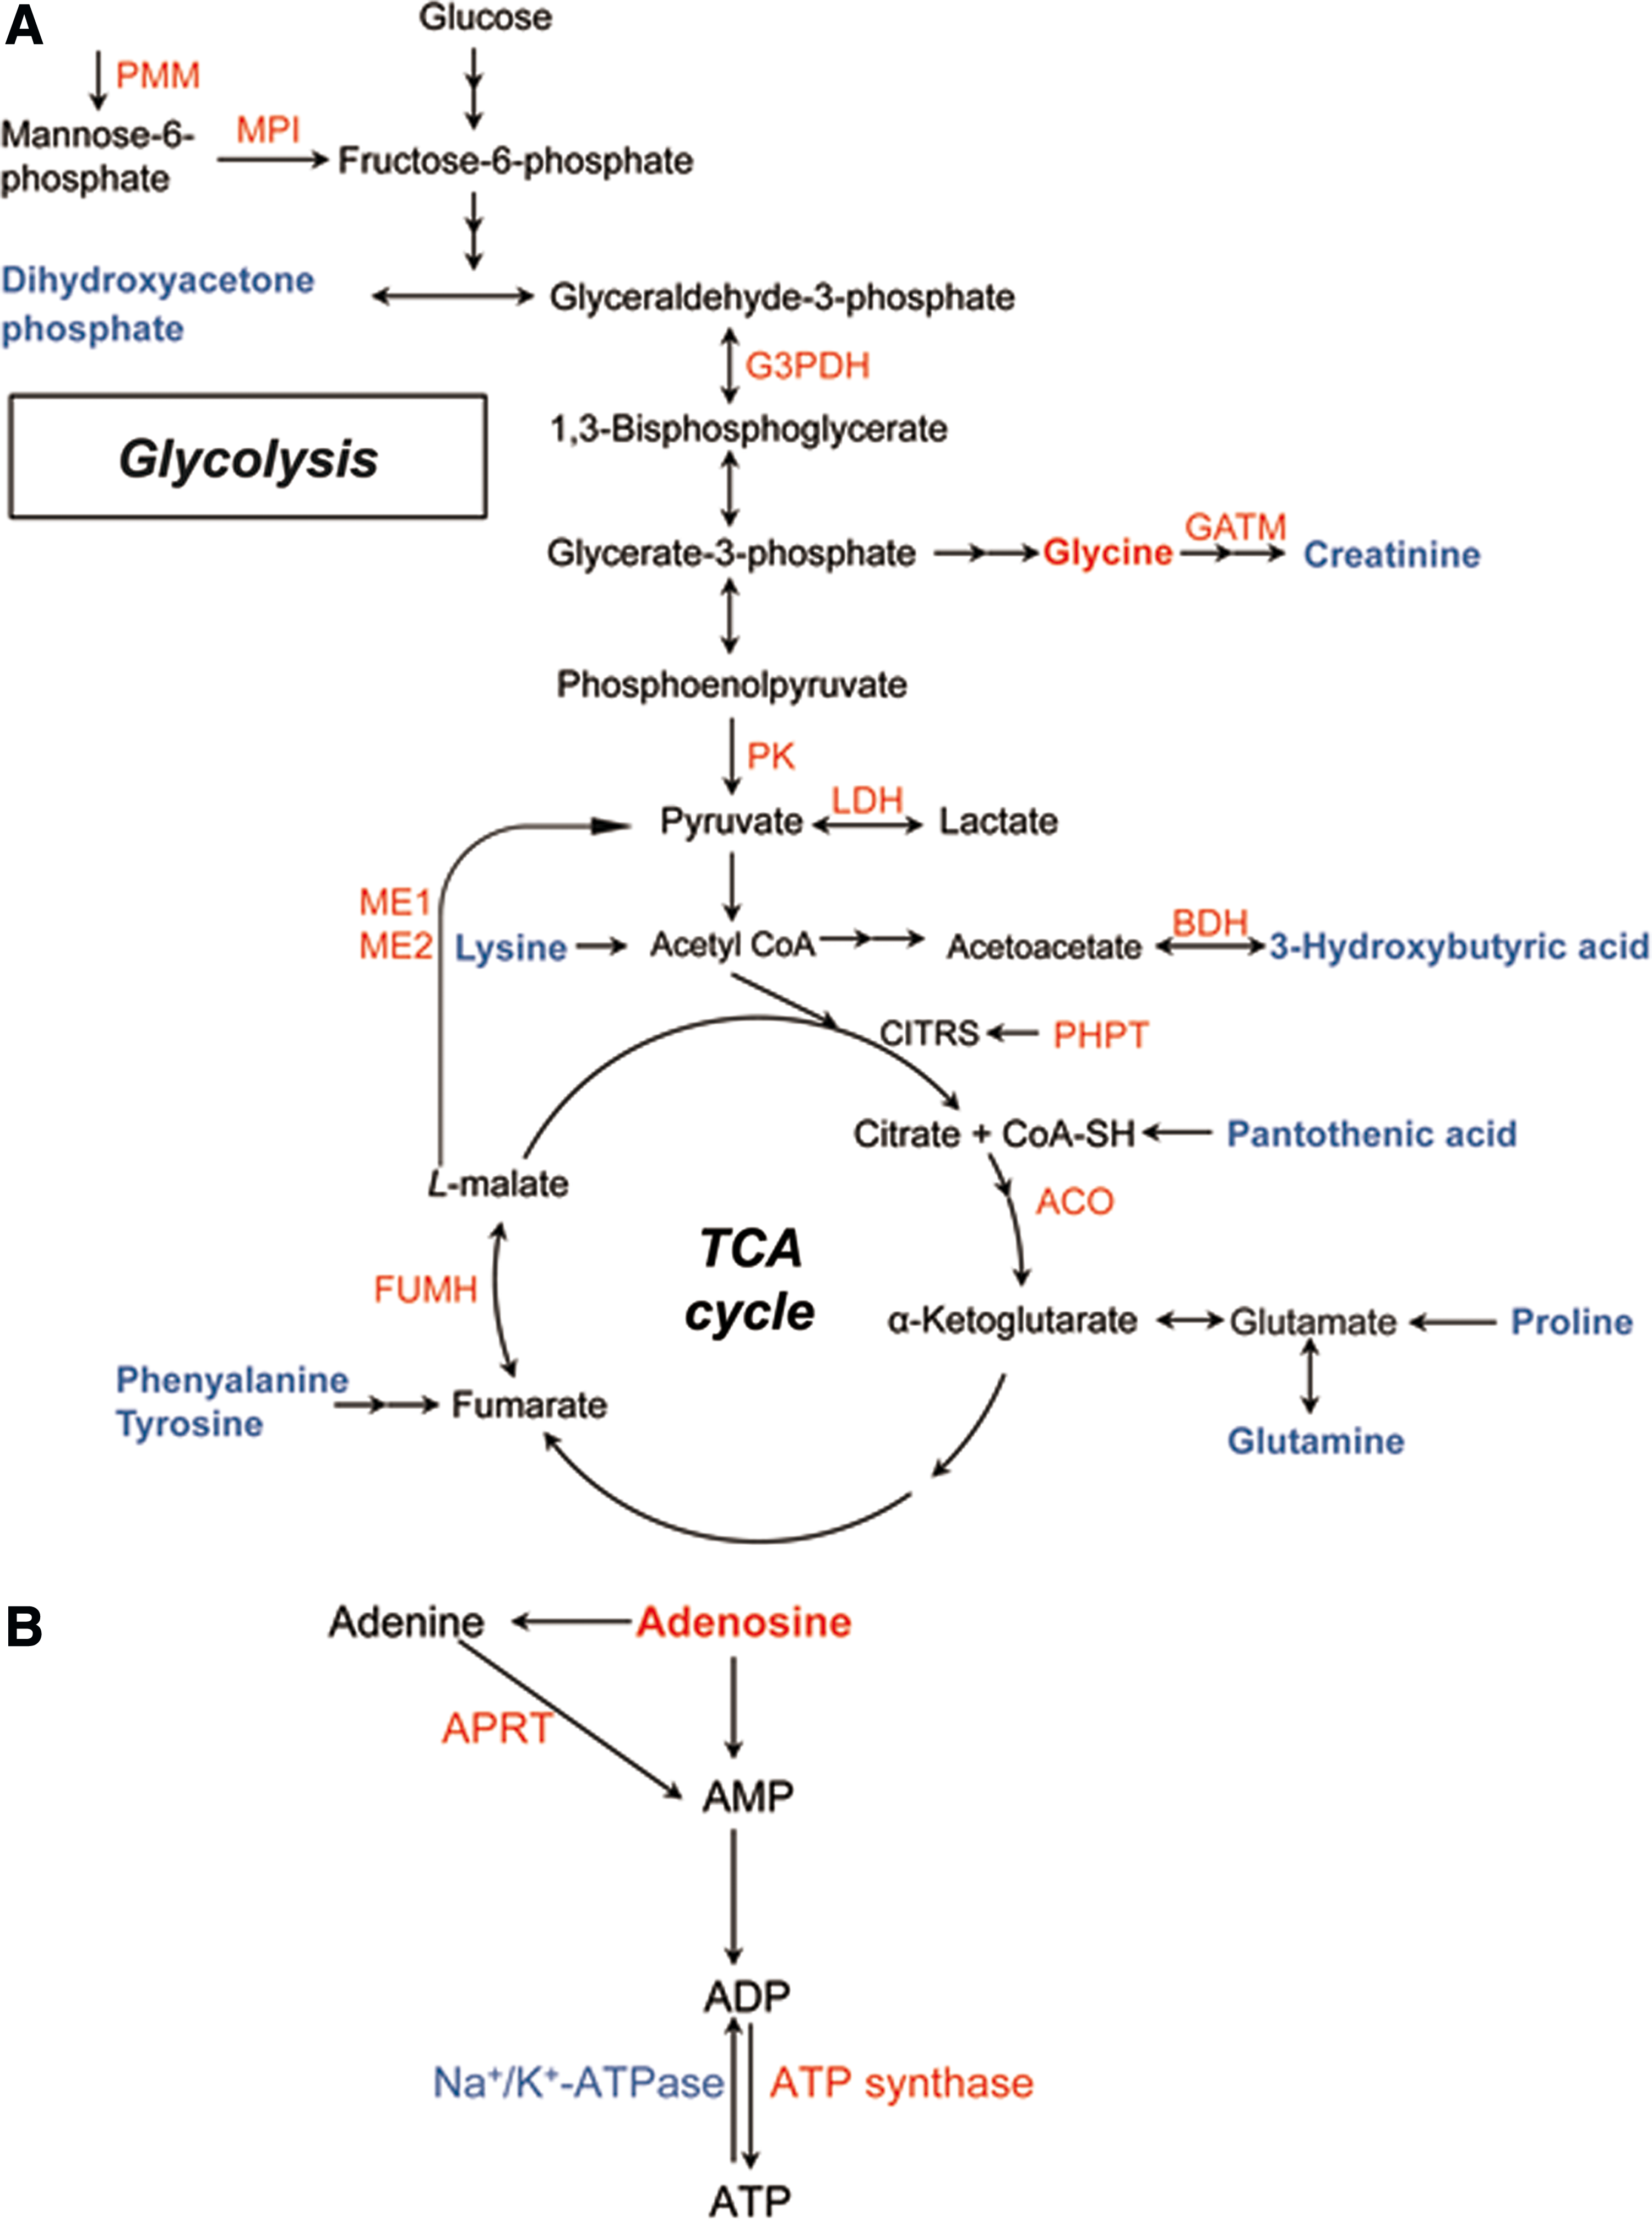
Perturbed metabolic pathways in depressed rat cerebella.
Discussion
This study is the first to combine proteomics and metabolomics analysis to investigate the pathophysiological mechanism(s) underlying MDD in a CMS rodent model of depression. From these analyses, perturbation of energy metabolism is evident in the depressed rat cerebellum.
Perturbation of amino acid metabolism
Abnormal amino acid metabolism has been previously demonstrated in the plasma of MDD patients (Xu et al., 2012) and in various brain regions, including the cortex, hippocampus, and thalamus of a rat depression model (Ni et al., 2008). Here, phenylalanine, tyrosine, lysine, glutamine, and proline were all significantly downregulated, while glycine was significantly upregulated in the cerebella of depressed rats. All of these amino acids can be used as energy sources via the TCA cycle (Fig. 4A), suggesting dysfunctional energy metabolism in the animals.
Consistent with these amino acid findings, four dysregulated proteins in the cerebella of depressed rats were also involved in amino acid metabolism—namely, pyrroline-5-carboxylate reductase 3 (Pycr1), caytaxin, CTP synthase2, and D-tyrosyl-tRNA(Tyr) deacylase (DTD1). First, Pycr1 is a mitochondrial enzyme that catalyzes the final step in the conversion of pyrroline-5-carboxylate (P5C) to proline (Lorans and Phang, 1981); therefore, the observed decreases in Pycr1 and proline likely indicates decreased proline biosynthesis. Notably, the Pycr1-dependent P5C/proline cycle has a dramatic effect on cellular energetic and physiological processes, such as mitochondrial electron transport (Meng et al., 2006). Second, caytaxin is a brain-specific protein with relatively higher cerebellar and hippocampal expression (Buschdorf et al., 2006) that inhibits glutaminase, an enzyme that converts glutamine to glutamate. CTP synthase 2 catalyzes the formation of CTP from UTP with the concomitant deamination of glutamine to glutamate. The parallel downregulation of caytaxin and upregulation of CTP synthase may be responsible for the observed reduction in glutamine levels. Lastly, DTD1 hydrolyzes d-tyrosyl-tRNA into D-tyrosine and free tRNA. DTD1 dysregulation could contribute to D-tyrosine toxicity (Soutourina et al., 2000).
With exception to de novo biosynthesis, amino acid homeostasis is regulated by protein synthesis and turnover. Perturbed amino acid homeostasis suggests altered protein synthesis and turnover. Accordingly, we observed altered levels of proteasomes (Psmb2, Psmb3, Psmb5, Psma7, Psmd6), ribosomal proteins (Rps28, Rps6, Rps4x, Mrpl46), ubiquitin carboxyl-terminal hydrolase (Usp8, Usp15) and carboxypeptidase (Cpa5, Cpe) in the cerebella of depressed rats. The upregulated proteasomal subunits and altered composition of ribosomal proteins suggests dysregulation in protein synthesis/degradation processes in the cerebella of depressed rats that may contribute to the observed amino acid and proteome imbalances (He et al., 2013).
Perturbation of carbohydrate metabolism
A number of proteins involved in glycolysis were significantly upregulated in depressed subjects compared to controls, including mannose-6-phosphate isomerase (MPI), glyceraldehyde-3-phosphate dehydrogenase (G3PDH), pyruvate kinase (PK), and lactate dehydrogenase (LDH) (Fig. 4A). Alteration of G3PDH has been previously implicated in the hippocampus and prefrontal cortex of depression rat models (Mallei et al., 2011; Marais et al., 2009; Piubelli et al., 2011) and in treatment with antidepressants (Carboni et al., 2006; Kedracka-Krok et al., 2010). PK catalyzes the rate-determing step in glycolysis—the transfer of a phosphate group from phosphoenolpyruvate to ADP that yields one molecule of pyruvate and one molecule of ATP. The upregulated levels of these enzymes presumably reflect an activated glycolytic process in the cerebella of depressed rats.
Moreover, in accordance with previous studies (Beasley et al., 2006; Carboni et al., 2006; Johnston-Wilson et al., 2000; Mu et al., 2007), upregulation of the mitochondrial isoforms of fumarate hydratase (Fh1), aconitase (Aco1), and malic enzymes ME1 and ME2 further support a modification of the TCA cycle in the cerebella of depressed rats (Fig. 4A). Malic enzyme functions to convert malate to pyruvate in the TCA cycle. The cytosolic ME1 isoform of malic enzyme generates cytosolic NADPH, whereas mitochondrial ME2 serves to supply sufficient pyruvate for increased Krebs cycle flux under limited glucose condition (Pongratz et al., 2007). Thus, the upregulated ME1 and ME2 here may suggest a continuous regeneration of NADPH and increased mitochondrial ATP production, respectively. Notably, the ME2 gene has been previously associated with psychotic and manic disorders (LEE et al., 2007).
Conversely, the associated glycolytic and TCA cycle metabolites, including pantothenic acid, dihydroxyacetone phosphate (DHAP), creatinine, and 3-hydroxybutyric acid, were all decreased in the cerebella of depressed rats (Fig. 4A). Creatinine is a nonenzymatic byproduct of creatine and phosphocreatine, and the creatine–phosphocreatine system is crucial for cellular energy transport. The lower levels of these metabolites in the depressed rat cerebella may indicate energy deficiency, which is an important factor in fatigue, one of the most common symptoms observed in MDD patients (Demyttenaere et al., 2005). According to the end-product feedback induction and intermediate mediated feed-forward induction mechanisms (He et al., 2013), the changes in the glycolytic and TCA cycle enzymes observed here may be induced by decreased levels of these repressed metabolites in depressed rats.
Perturbation of ATP biosynthesis
An important substrate in ATP biosynthesis, adenosine, was found to be increased in the cerebella of depressed rats. Kaster et al. (2004) observed that adenosine administration produces antidepressant-like effects in mice. However, whether this effect is related to ATP biosynthesis requires further investigation. Consistent with our metabolomics findings, three enzymes involved in catalyzing the biosynthesis of ATP from adenosine were identified: adenine phosphoribosyl transferase (APRT), ATP synthase, and Na+, K+-ATPase. APRT catalyzes a salvage reaction resulting in the formation of AMP. ATP synthase couples transmembrane proton transport to the synthesis of ATP from ADP and inorganic phosphate (Feniouk et al., 2007). Na+, K+-ATPase, which is present in high concentrations in brain cellular membranes, consumes approximately 40%–50% of the ATP generated in brain tissue (Erecińska and Silver, 1994); notably, its activity is decreased in the hippocampal synaptic plasma membranes of depressed rats (Gamaro et al., 2003). The elevated levels of adenosine, APRT, and ATP synthase combined with the parallel downregulation of Na+, K+-ATPase suggests an activated ATP biosynthetic process in the cerebella of depressed rats (Fig. 4B).
The mitochondrial respiratory chain is coupled to ATP synthesis. Here, several differential proteins—including upregulated Ndufa6, Ndufs5, Mt-co2, Cox4nb, and downregulated Ndufa2, Ndufv3, Glrx1—participate in the mitochondrial respiratory chain. The abnormal expression of mitochondrial respiratory chain complex proteins has been previously reported in chronic stress rat models (Madrigal et al., 2001; Rezin et al., 2008) and MDD patients (Martins-de-Souza et al., 2012). The dysregulated subunits of NADH dehydrogenase (ubiquinone) observed here may indicate impaired complex I function in the depressed rat cerebella. Cytochrome C oxidase (COX) is a multi-subunit complex that catalyzes the terminal redox reaction in the mitochondrial respiratory chain. These differentially expressed proteins indicate a perturbation of the mitochondrial respiratory chain in the cerebella of depressed rats. Bisgaard et al. (2007) speculated that increased oxidative phosphorylation is an adaptive and protective mechanism underlying CMS resilience. Based on this, the perturbation in the mitochondrial respiratory chain in the cerebella of depressed rats suggests an energetic readjustment process in coping with increased stress load (Chen et al., 2009).
Taken together, the perturbation in amino acid metabolism, glycolysis, TCA cycle, and ATP biosynthesis process all point toward abnormal energy mobilization in depressed rat cerebella. Bioenergetic dysfunction has been previously implicated in the pathophysiology of psychiatric disorders (Rezin et al., 2009), and ATP has been found to be a key modulator of depressive-like behavior in adult mice (Cao et al., 2013). Neuroimaging studies also have revealed alterations in biomarkers for energy metabolism; specifically, reduced ATP availability (Iosifescu and Renshaw, 2003) and reductions in glucose metabolism (Baxter et al., 1989) have been observed in brains from MDD patients. More interestingly, children with oxidative phosphorylation-related diseases display more withdrawn and depressive behaviors, suggesting a link between dysregulated energy metabolism and MDD (Morava et al., 2010). The present investigation expands upon these previous studies by showing perturbed energy metabolism spanning across amino acid metabolism, glycolysis, TCA cycle, and ATP biosynthesis.
There are three notable limitations to this study. First, the proteomics findings were not validated with a secondary method such as Western blotting. Second, proteomics changes were in agreement with those in the metabolome, but the metabolomics profile displayed a much narrower dynamic range. Third, since many low-abundant metabolites (e.g., neurotransmitters, steroids, and eicosanoids) are not detectable by GC-MS, the combination of GC-MS with other analytical techniques (e.g., NMR, LC/MS or other more specific, targeted methods) should be considered in further studies.
Conclusions
Using the complementary “-omics” strategy, we found that a combination of information from proteomics and metabolomics sources provides a better picture of the rat cerebellar response to CMS. Our findings demonstrate that CMS induces disturbed energy metabolism in rat cerebella as indicated by perturbation in amino acid metabolism, glycolysis, TCA cycle, and ATP biosynthesis. These results can provide important insight into the pathogenesis of MDD.
Footnotes

References
Supplementary Material
Please find the following supplemental material available below.
For Open Access articles published under a Creative Commons License, all supplemental material carries the same license as the article it is associated with.
For non-Open Access articles published, all supplemental material carries a non-exclusive license, and permission requests for re-use of supplemental material or any part of supplemental material shall be sent directly to the copyright owner as specified in the copyright notice associated with the article.
