
Abstract
Abstract
PTPRD (protein tyrosine phosphatase, receptor type, D) is a tumor suppressor gene, frequently inactivated through deletions or epigenetic mechanisms in several cancers with importance for global health. In this study, we provide new and functionally integrated evidence on genetic and epigenetic alterations of PTPRD gene in hepatocellular carcinomas (HCCs). Importantly, HCC is the sixth most common malignancy and the third most common cause of cancer-related mortality worldwide. We used a high throughput single nucleotide polymorphism (SNP) microarray assay (Affymetrix, 10K2.0 Assay) covering the whole genome to screen an extensive panel of HCC cell lines (N=14 in total) to detect DNA copy number changes. PTPRD expression was determined in human HCCs by Q-RT-PCR and immunohistochemistry. Promoter hypermethylation was assessed by combined bisulfite restriction analysis (COBRA). DNA methyl transferase inhibitor 5-azacytidine (5-AzaC) and/or histone deacetylase inhibitor Trichostain A (TSA) were used to restore the expression. We identified homozygous deletions in Mahlavu and SNU475 cells, in the 5′UTR and coding regions, respectively. PTPRD mRNA expression was downregulated in 78.5% of cell lines and 82.6% of primary HCCs. PTPRD protein expression was also found to be lost or reduced in HCC tumor tissues. We found promoter hypermethylation in 22.2% of the paired HCC samples and restored PTPRD expression by 5-AzaC and/or TSA treatments. In conclusion, PTPRD is homozygously deleted and epigenetically downregulated in HCCs. We hypothesize PTPRD as a tumor suppressor candidate and potential cancer biomarker in human HCCs. This hypothesis is consistent with compelling evidences in other organ systems, as discussed in this article. Further functional assays in larger samples may ascertain the contribution of PTPRD to hepatocarcinogenesis in greater detail, not to forget its broader importance for diagnostic medicine and the emerging field of personalized medicine in oncology.
Introduction
H
Chromosomal deletions and amplifications are large structural changes that may harbor genes regulating cell proliferation, apoptosis, genome stability, angiogenesis, invasion, and metastasis (Albertson et al., 2003). Such aberrations can be monitored with large-scale genomic and molecular genetic technologies, including single nucleotide polymorphism (SNP) microarrays (Heinrichs et al., 2007). SNP arrays are high-resolution cytogenetic tools that provide copy number alterations, including loss-of-heterozygosity events (Pfeifer et al., 2007).
In order to find novel chromosomal abnormalities at a higher resolution, we performed a microarray screen in a panel of 14 HCC lines. Our SNP array analysis revealed many chromosomal aberrations, including previously identified regions (Biden et al., 1997). One of the most remarkable aberrations was a homozygous deletion at chromosome 9p23 harboring PTPRD gene. PTPRD is one of the 21 human receptor-type protein tyrosine phosphatases (PTPs) and maps to 9p23–24.1. PTPs constitute a large family having a total of 107 members with crucial regulatory roles in the cellular metabolism, and their deregulation has been linked to tumorigenesis (Julien et al., 2011).
Tumor suppressor activity of PTPRD was first suggested by Urushibara et al. (1998) who showed selective downregulation of PTPRD mRNAs in rat primary hepatomas and HepG2 hepatoblastoma cell line. Tumor suppressive properties of PTPRD and its prognostic biomarker potential were also reported in glioblastoma multiforme (GBM), melanoma, and gastric adenocarcinoma (Solomon et al., 2008; Veeriah et al., 2009; Wang et al., 2014). PTPRD dephosphorylates and inactivates STAT3 oncoprotein that regulates cell cycle progression, apoptosis, and survival mechanisms (Bowman et al., 2000; Veeriah et al., 2009). Recently, it was reported by an in vivo study that allelic loss of PTPRD leads to Stat3 hyperactivation in GBM (Ortiz et al., 2014). PTPRD was also shown to dephosphorylate and destabilize Aurora kinase A (AURKA) oncoprotein in neuroblastomas (Meehan et al., 2012).
Homozygous deletions of PTPRD were reported in lung cancer (1%–11%) (Kohno et al., 2010; Zhao et al., 2005), cutaneous squamous cell carcinomas (SCC) (17%) (Purdie et al., 2007), neuroblastoma (12%–50%) (Nair et al., 2008; Stallings et al., 2006), melanoma (9%) (Stark et al., 2007), GBM (33%) (Solomon et al., 2008), laryngeal squamous cell carcinoma (LSCC) (20%) (Giefing et al., 2011), and recently in human HCC samples (1%–17%) (Guichard et al., 2012; Nalesnik et al., 2012).
Somatic mutations of PTPRD were also shown in various cancers with the rate of 4%–21.5% (Sjoblom et al., 2006; Solomon et al., 2008; Veeriah et al., 2009; Walia et al., 2014; Weir et al., 2007). In the case of HCC, mutation rates are very low (1.4%–4%) (Bamford et al., 2004; Guichard et al., 2012). Furthermore, PTPRD is also silenced frequently by promoter hypermethylation in colon cancer (50%), GBM (37%), squamous cell of head and neck (25%), and breast cancer (20%) (Veeriah et al., 2009).
Although it is widely accepted that PTPRD functions as a tumor suppressor gene, its involvement in hepatocarcinogenesis has not been investigated. In this study, we examined the role of PTPRD in HCC pathogenesis by evaluating its expression, as well as genetic and epigenetic alterations. Here, we demonstrate that PTPRD is homozygously deleted and significantly downregulated in human HCCs. According to our analysis, this downregulation occurs through the promoter hypermethylation and/or histone deacetylation. Our results indicate that genetic and epigenetic alterations of PTPRD may play a role in HCC development.
Materials and Methods
Cell lines and patient samples
HCC-derived cell lines; SNU449, Focus, SNU182, SNU475, Mahlavu (MV), SNU398, SNU423, SK-Hep1, SNU387, Hep40, Huh7, PLC/PRF5 (PLC), Hep3B and hepatoblastoma-derived cell line, HepG2, were maintained as described (Acun et al., 2011). 32 pairs of HCC and tumor-adjacent normal archival DNA samples had previously been described (Ozturk et al., 1991). TissueScan Liver Cancer Tissue qPCR Panel I (Cat. No: LVRT501) was purchased from Origene Technologies (Rockville, MD). QPCR panel contains pre-normalized cDNAs obtained from 48 liver samples consisting of 8 tumor-adjacent normal, 23 HCC (grades I, II, IIIA, IV), 3 cholangiocarcinoma, 1 adenoma, and 13 nontumor lesions of the liver. (Supplementary Table S1; supplementary material is available online at www.liebertpub.com/omi). Liver Tumor Tissue Array (Cat. No: Z7020060) was purchased from BioChain (BioChain Institute, Inc., Hayward, CA) that had 96 cores covering 36 cases of all common types of liver cancers and 12 cases of normal cases and other nonmalignant liver tissues with duplicates (Supplementary Table S2). Normal liver DNA sample was purchased from BioServe (Beltsville, MD, USA).
SNP microarray assay
We used 10 K 2.0 SNP microarrays (Affymetrix, 10K2.0 Assay) that contains ∼10 K SNP markers covering the whole genome with a mean physical inter-marker distance of 0.2 MB. Probe preparation for SNP microarray hybridization experiments were done according to manufacturer's manual. Detailed information of this method was supplied in supplementary data (Supplementary Method S1).
Microarray analysis
Primary analysis (e.g., quality control metrics, SNP calling, etc.) were performed with Affymetrix GCOS and GDAS software bundle. Secondary analysis (e.g., intensity normalization, background correction, etc.) were performed to reveal chromosomal abnormalities by using dCHIP-Analyzer (Li et al., 2001). Model-based expression was selected with perfect match-mismatch background correction. Normalization was performed according to the median chip intensity using invariant set and smoothed with running median method. Hidden Markov Model and median smoothing were used in inferred copy number analysis.
Multiplex semi-quantitative RT-PCR
Total RNA isolation from the HCC cell lines and following cDNA synthesis were performed by NucleoSpin RNA II (Macherey-Nagel, Germany) and Revert Aid (Fermentas, Lithuania) kits, respectively, according to the manufacturer's instructions. Multiplex semi-quantitative RT-PCR was performed with PTPRD-specific PTPRD-MSQ-F/PTPRD-MSQ-R and GAPDH (glyceraldehyde-3-phosphate dehydrogenase)-specific GAPDH-MSQ-F/GAPDH-MSQ-R primer pairs (Supplementary Table S3).
Quantitative real-time RT-PCR (Q-RT-PCR)
Relative quantification of PTPRD transcripts was performed with SYBR Green qPCR kit (Finnzymes DyNAmo™ HS; Finnzymes, Finland) on Stratagene MX3005P™ real-time RT-PCR system (Stratagene, La Jolla, CA) as previously described (Acun et al., 2011). PTPRD-QRT-F/PTPRD-QRT-R primer pair was used with cDNAs from HCC cell lines and liver cancer qPCR panel (Supplementary Table S1). GAPDH and TBP (TATA box binding protein) genes were used as internal controls (Fu et al., 2009; Gur-Dedeoglu et al., 2009) (Supplementary Table S3). Modified ΔΔCt formula was used to measure the relative levels of PTPRD transcripts (Acun et al., 2011; Pfaffl et al., 2001). Statistical analysis were performed by Student's t-test.
Immunohistochemistry
Immunohistochemistry (IHC) was performed on human liver tumor tissue array (Supplementary Table S2) by using DAKO Universal Dako LSAB®+Kit (Code; K0690) according to the manufacturer's instructions. The intensity of PTPRD staining for each sample was scored as previously described (Chen et al., 2006; Oztas et al., 2010). Statistical analysis were performed by Student's t-test. Detailed information of this method was supplied in supplementary data (Supplementary Method S2).
Mutation screening
Genomic PCR was applied with two sets of overlapping primers in order to amplify 20th exon (Supplementary Table S3). PCR96 Cleanup Kit (Millipore, Billerica, MA) was used to purify PCR products that were then directly sequenced by a sequencing service company; Iontek (Istanbul, Turkey). Mutation analysis was performed with Mutation Surveyor software package (v 3.10, SoftGenetics, LLC, State College, PA).
5-Azacytidine (5-AzaC) and Trichostatin A (TSA) treatments
5-AzaC (Sigma-Aldrich, St. Louis, MO) and TSA (Sigma-Aldrich) treatments were performed as described previously (Acun et al., 2011). In brief, 3×10⁵ cells/well were seeded in 6-well plates. After 24 h, 5-AzaC (2.5 μM) treatment was done for 96 h. TSA treatment (1 μM) was performed in the last 24 h either alone or in combination with 5-AzaC. Medium and 5-AzaC were replenished every 24 h. At the end of treatment, cells were harvested for DNA and RNA isolations.
Sodium bisulfite treatment and combined bisulfite restriction analysis (COBRA)
Qiagen DNeasy Tissue kit (Hilden, Germany) was used to extract genomic DNA from cell lines. Genomic DNAs were bisulfite treated by Epigentek Methylamp™ DNA Modification Kit (Brooklyn, NY) according to the manufacturer's instructions. Nested primer pairs were designed in order to amplify the part of PTPRD promoter region containing CpG island (Supplementary Table S3 and Supplementary Fig. S1). Amplicons of ptprdBi2F/ptprdBi1R primer pair were restriction digested with BstUI (New England BioLabs, Ipswich, MA) to analyze methylation status, as previously described (Xiong et al., 1997).
Results
SNP Microarray and genomic PCR analysis of 14 HCC cell lines identified homozygous deletions in the PTPRD locus
Our SNP array screening identified a homozygously deleted region in the Mahlavu cell line. This deleted region (∼1 Megabase) was spanned by 6 SNPs and mapped to the 5′UTR of PTPRD (Fig. 1). We then asked whether other focal deletions existed that were not covered by the SNPs of the microarray. Genomic PCR analysis that uses intronic primers flanking each coding exon revealed another deletion region in SNU475 cell line between exons 24–31 (∼40 Kilobase). All coding exons were successfully amplified in the remaining 13 HCC cell lines and normal liver sample (Fig. 2, Supplementary Table S3). ENST00000381196 (EnsEMBL release 59, GRCh37) is the Ensembl Transcript ID used for annotating the deletions (Flicek et al., 2012).
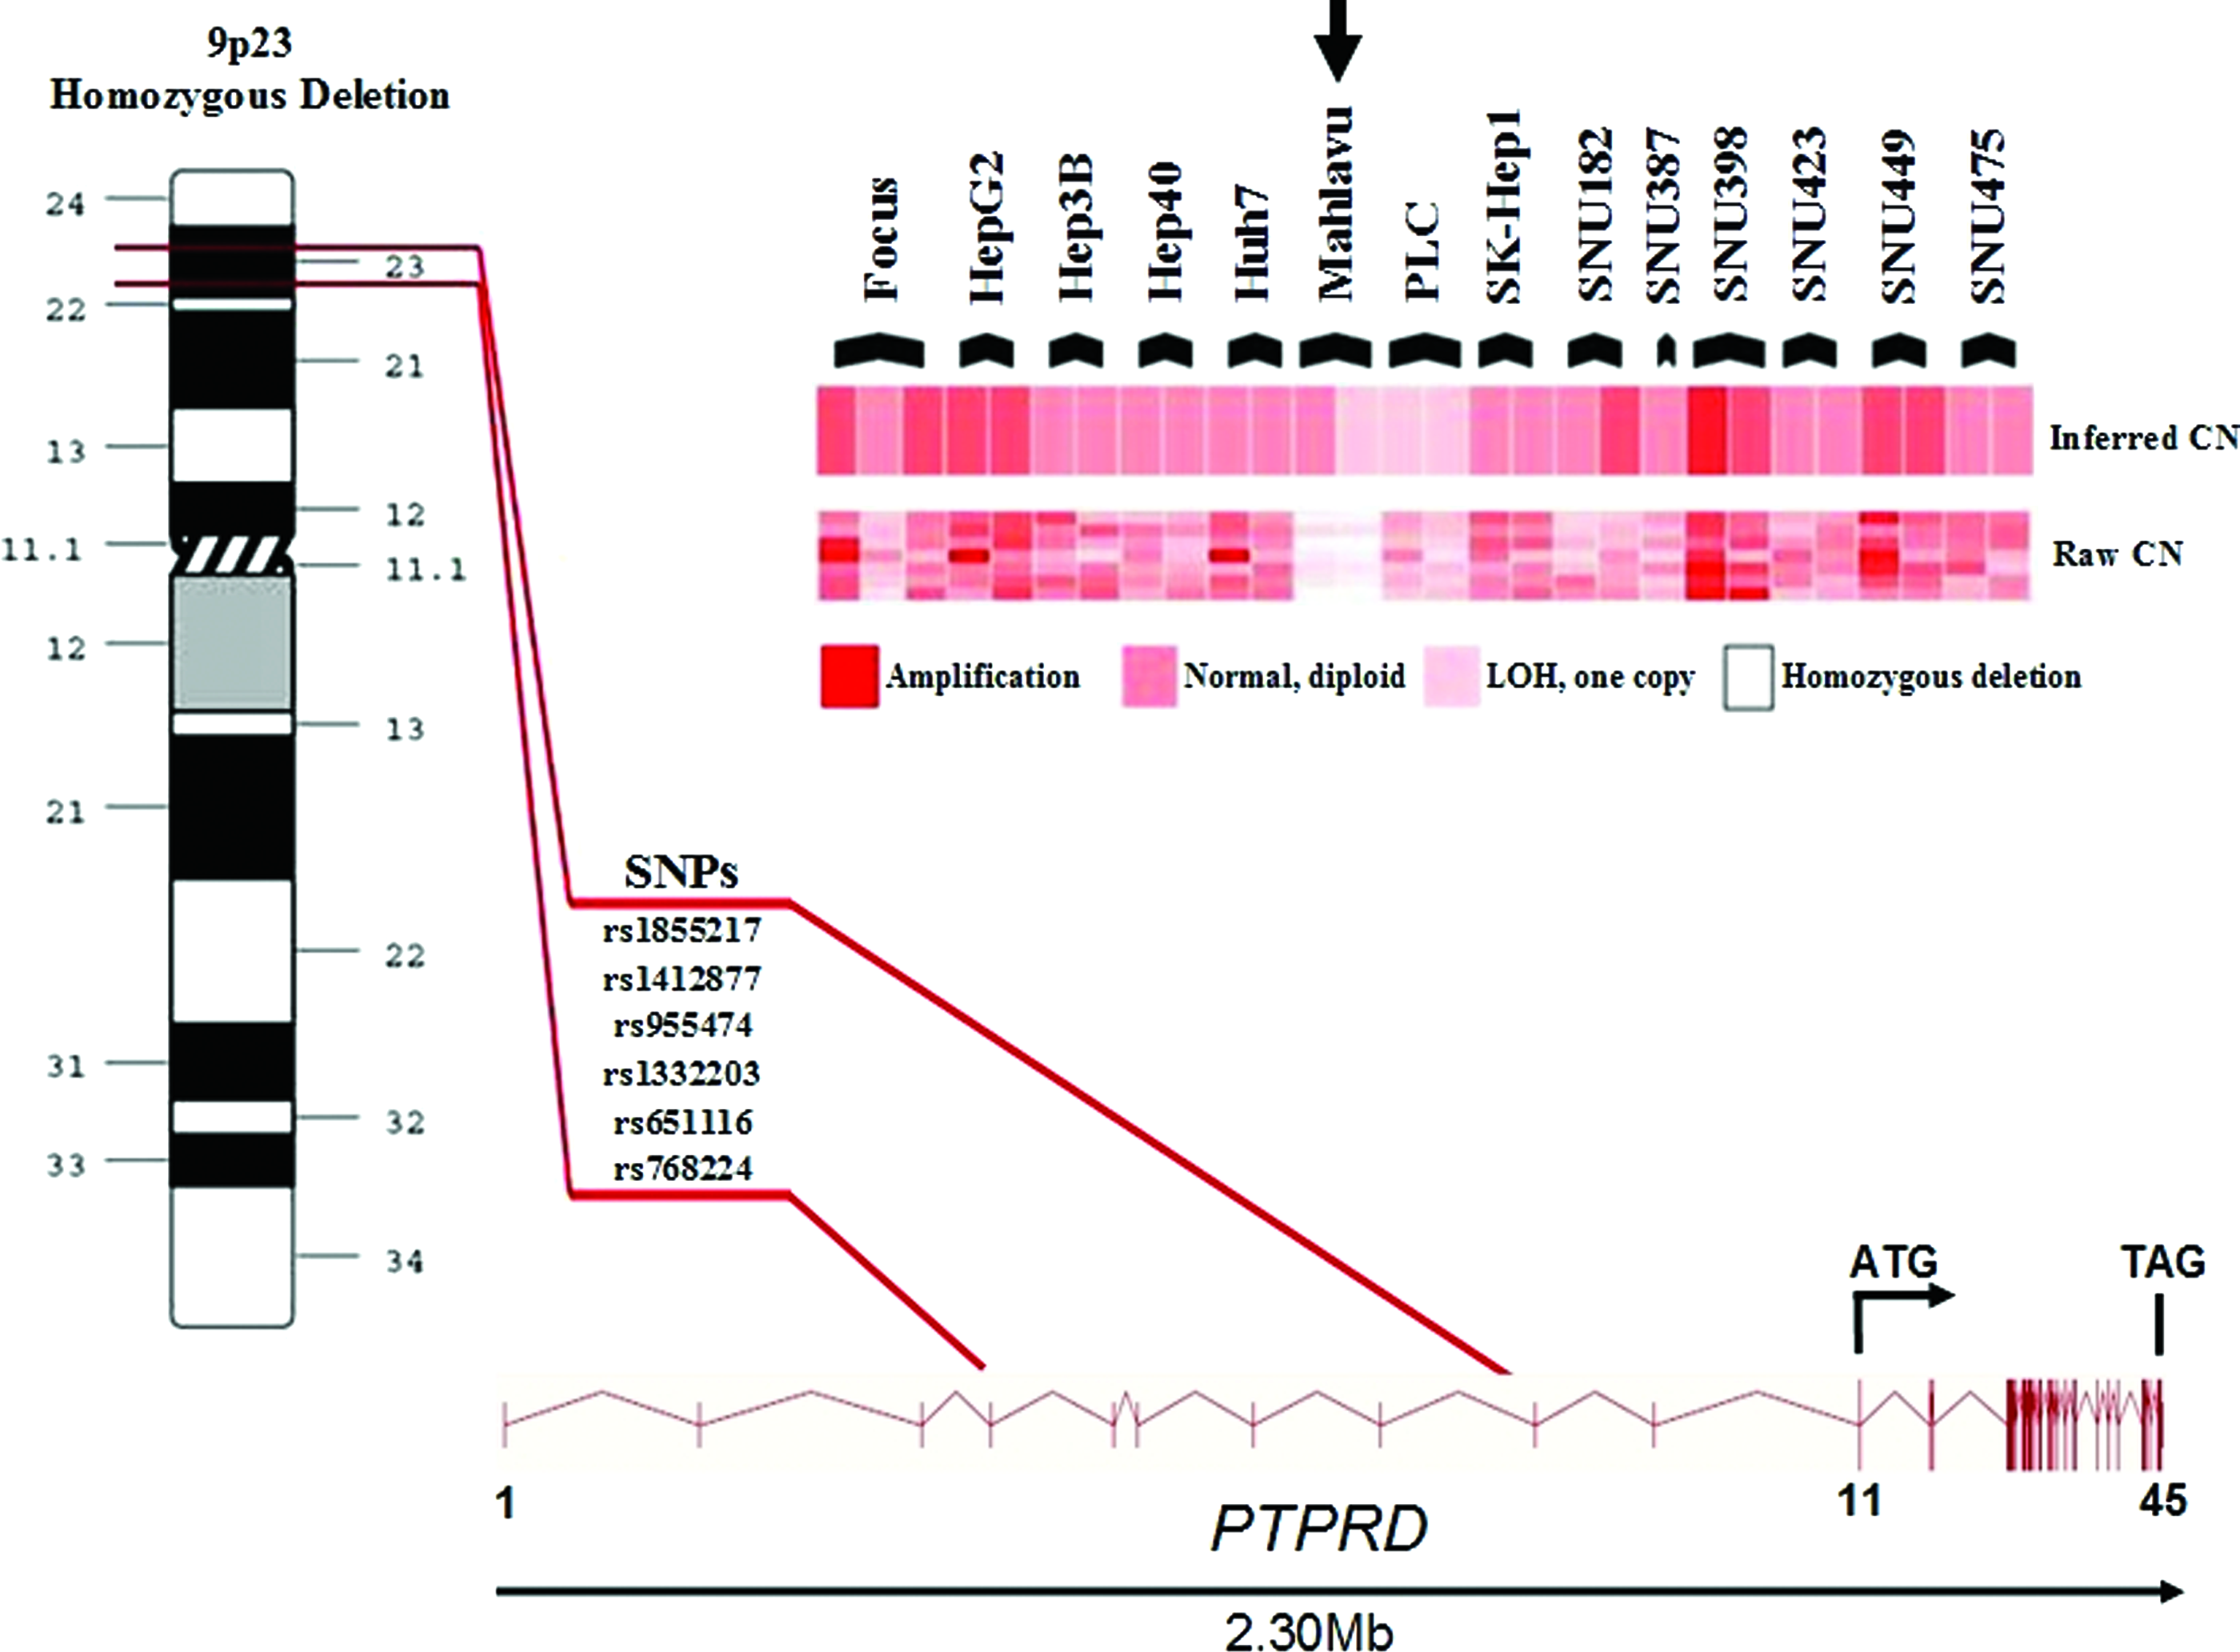
Homozygous deletion in Mahlavu cell line revealed by the SNP array is located in 5′UTR region of PTPRD gene, between exon 4–exon 9. CN, copy number; LOH, loss of heterozygosity. Vertical lines represent exons.

Homozygous deletion in SNU475 cell line (between exon 24–exon 31) shown by genomic PCR. [(-) control]: DNA-free PCR mixture. Vertical lines represent exons.
Mutation analysis of PTPRD in HCCs identified a SNP
According to the Sanger Institute COSMIC (Catalogue of Somatic Mutations in Cancer) database, exon 20 is the most mutated exon (14%) (Bamford et al., 2004). Moreover, three different mutations were recently described in this exon (Solomon et al., 2008). Therefore, we genotyped exon 20 in HCC cell lines and archival HCC samples. We identified a SNP (rs10977171, Q447E) in SNU182 HCC cell line and in one HCC sample (C12) (Supplementary Fig. S2).
PTPRD expression is downregulated in HCC cell lines
We measured PTPRD mRNA expression in 14 HCC cell lines by Q-RT-PCR (Fig. 3). PTPRD transcript was found to be low in Mahlavu, PLC, SNU398, SNU475, and almost undetectable in Focus, HepG2, Hep3B, Huh7, SNU182, SNU387, and SNU423 cells. Hep40, SK-Hep1, and SNU449 cells showed robust PTPRD mRNA expression. These results suggested that PTPRD expression is negatively regulated in some HCC cells by as yet unidentified mechanisms.

Q-RT-PCR analysis of PTPRD in HCC cell lines. GAPDH was used as an internal control. Experiments were conducted twice, and standard deviations are indicated.
PTPRD expression is reduced in human HCC samples
We expanded our analysis to clinical samples and investigated PTPRD mRNA levels in a panel of HCC samples by Q-RT-PCR. We found strong reduction of PTPRD expression in 19 of 23 (82.6%) primary HCCs (GI, GII, GIIIA, GIV) compared to eight normal liver tissues from the same panel (P value=0.013; Fig. 4).
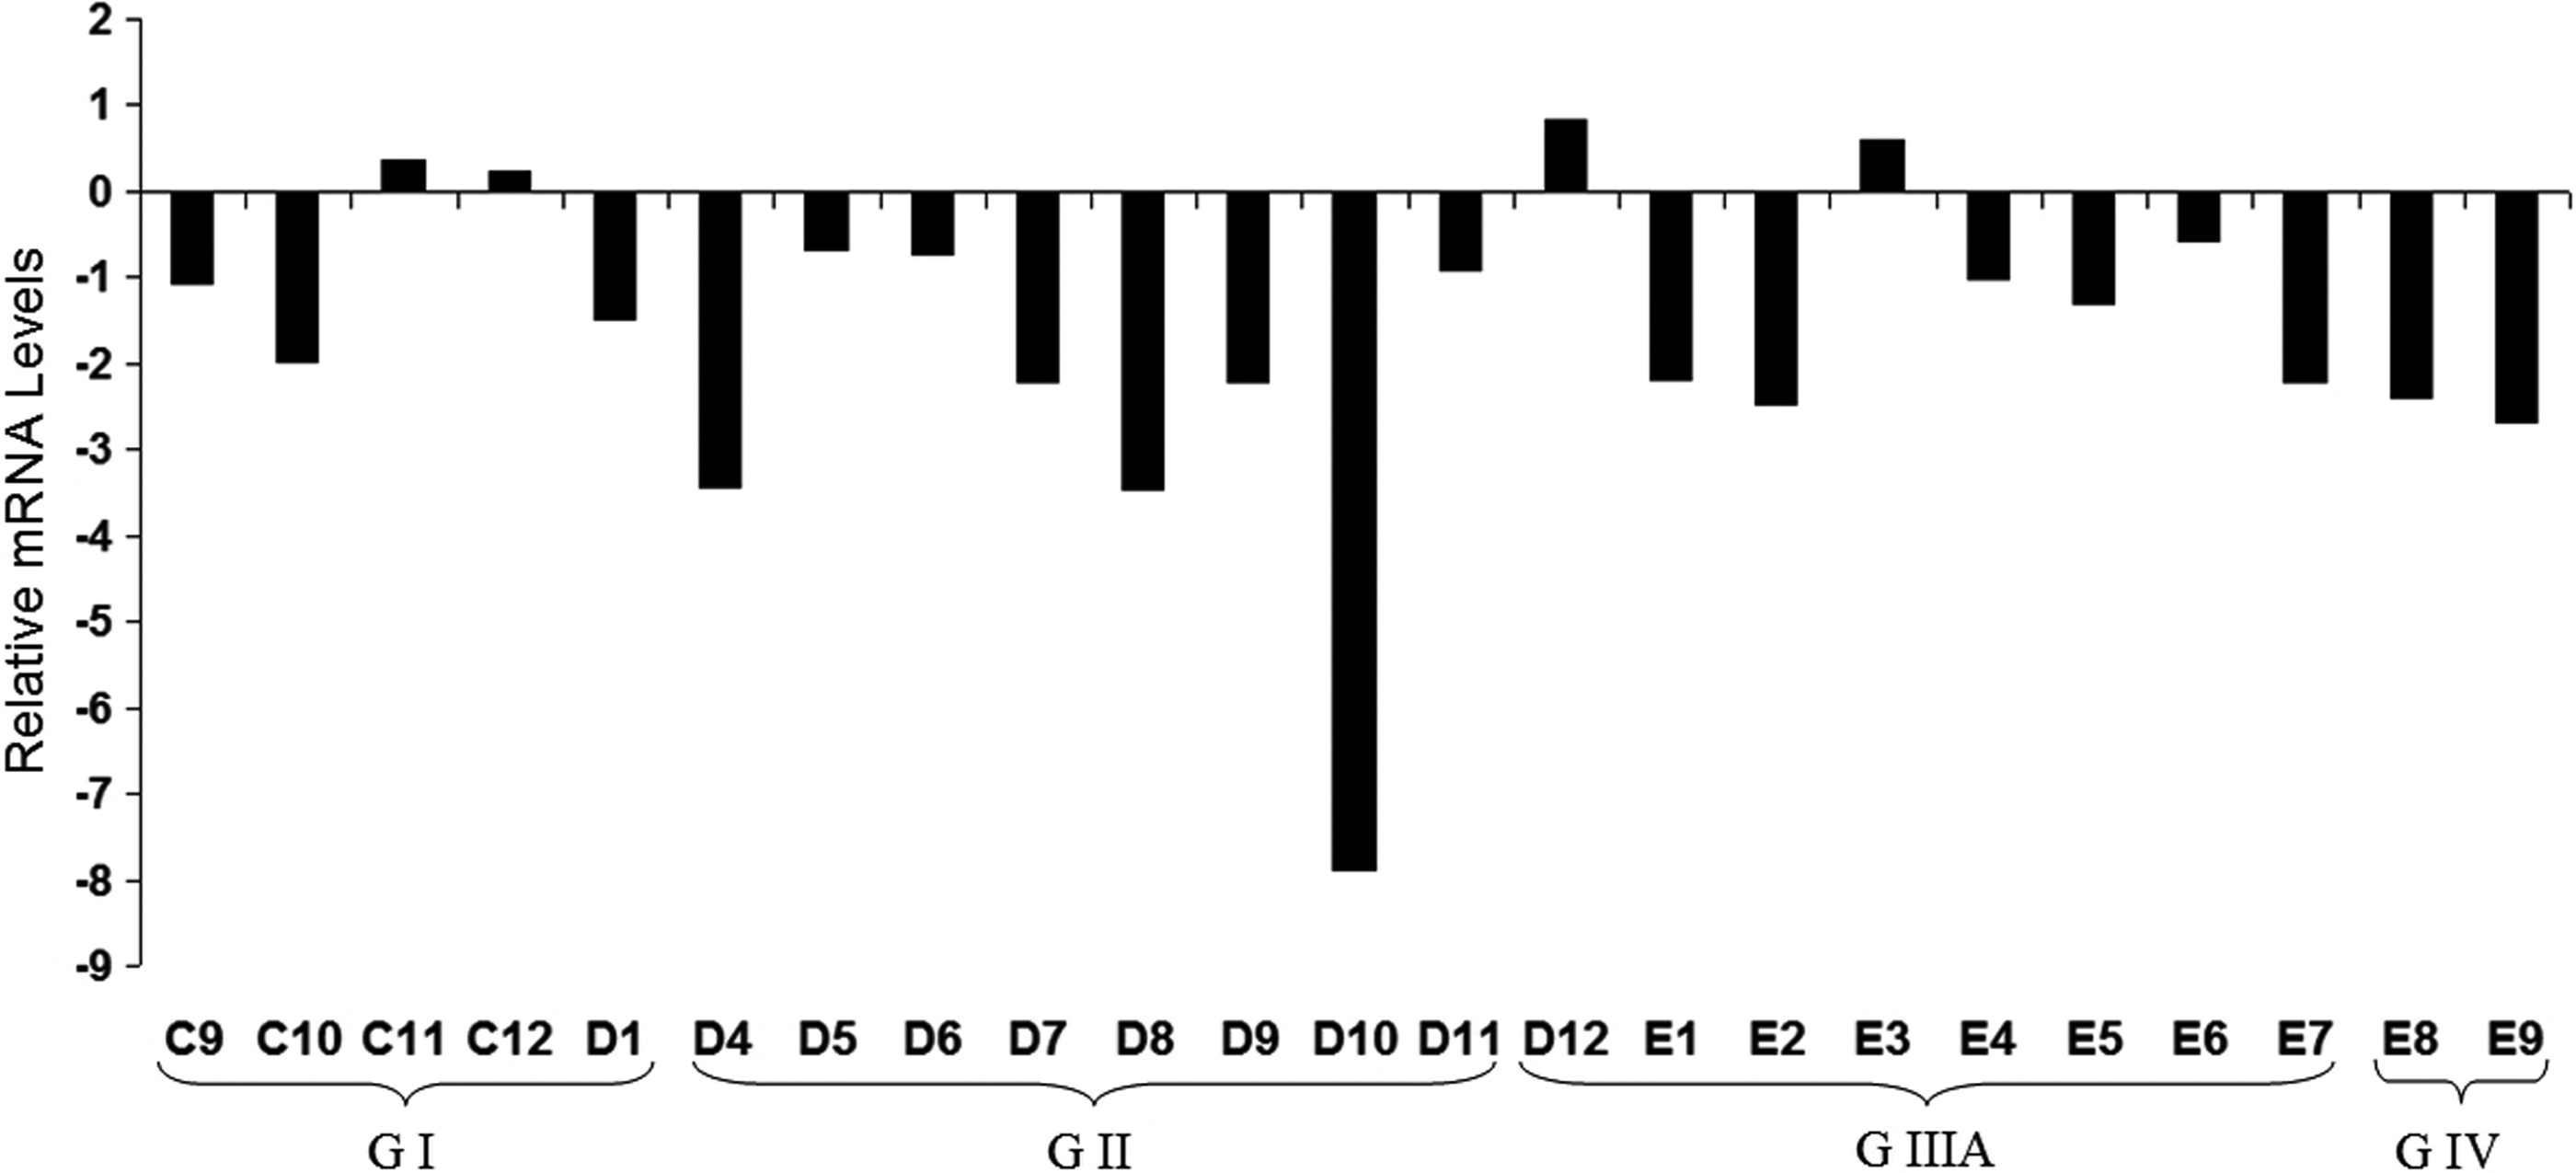
PTPRD expression in HCC tumors relative to normal tissues was analyzed by Q-RT-PCR. Relative mRNA levels normalized to TBP are represented. Patients are grouped depending on tumor stage (GI–GIV). Clinicopathological characteristics of patients (C9-E9) are listed in Supplementary Table S1.
PTPRD protein is missed or downregulated in HCCs
We performed immunohistochemistry in the human liver tumor tissue arrays to investigate if the PTPRD protein levels were also lower in tumor samples (Fig. 5, Supplementary Table S2). PTPRD expression was localized to the cytoplasm in all cases and differential expression was observed between tumoral and non-tumoral liver tissues. Most of the grade III tumor cases (85.7%) failed to express the PTPRD protein. On the other hand, all non-tumoral liver tissues stained either moderately (33.3%) or strongly (66.7%) (Fig. 5 and Table 1).
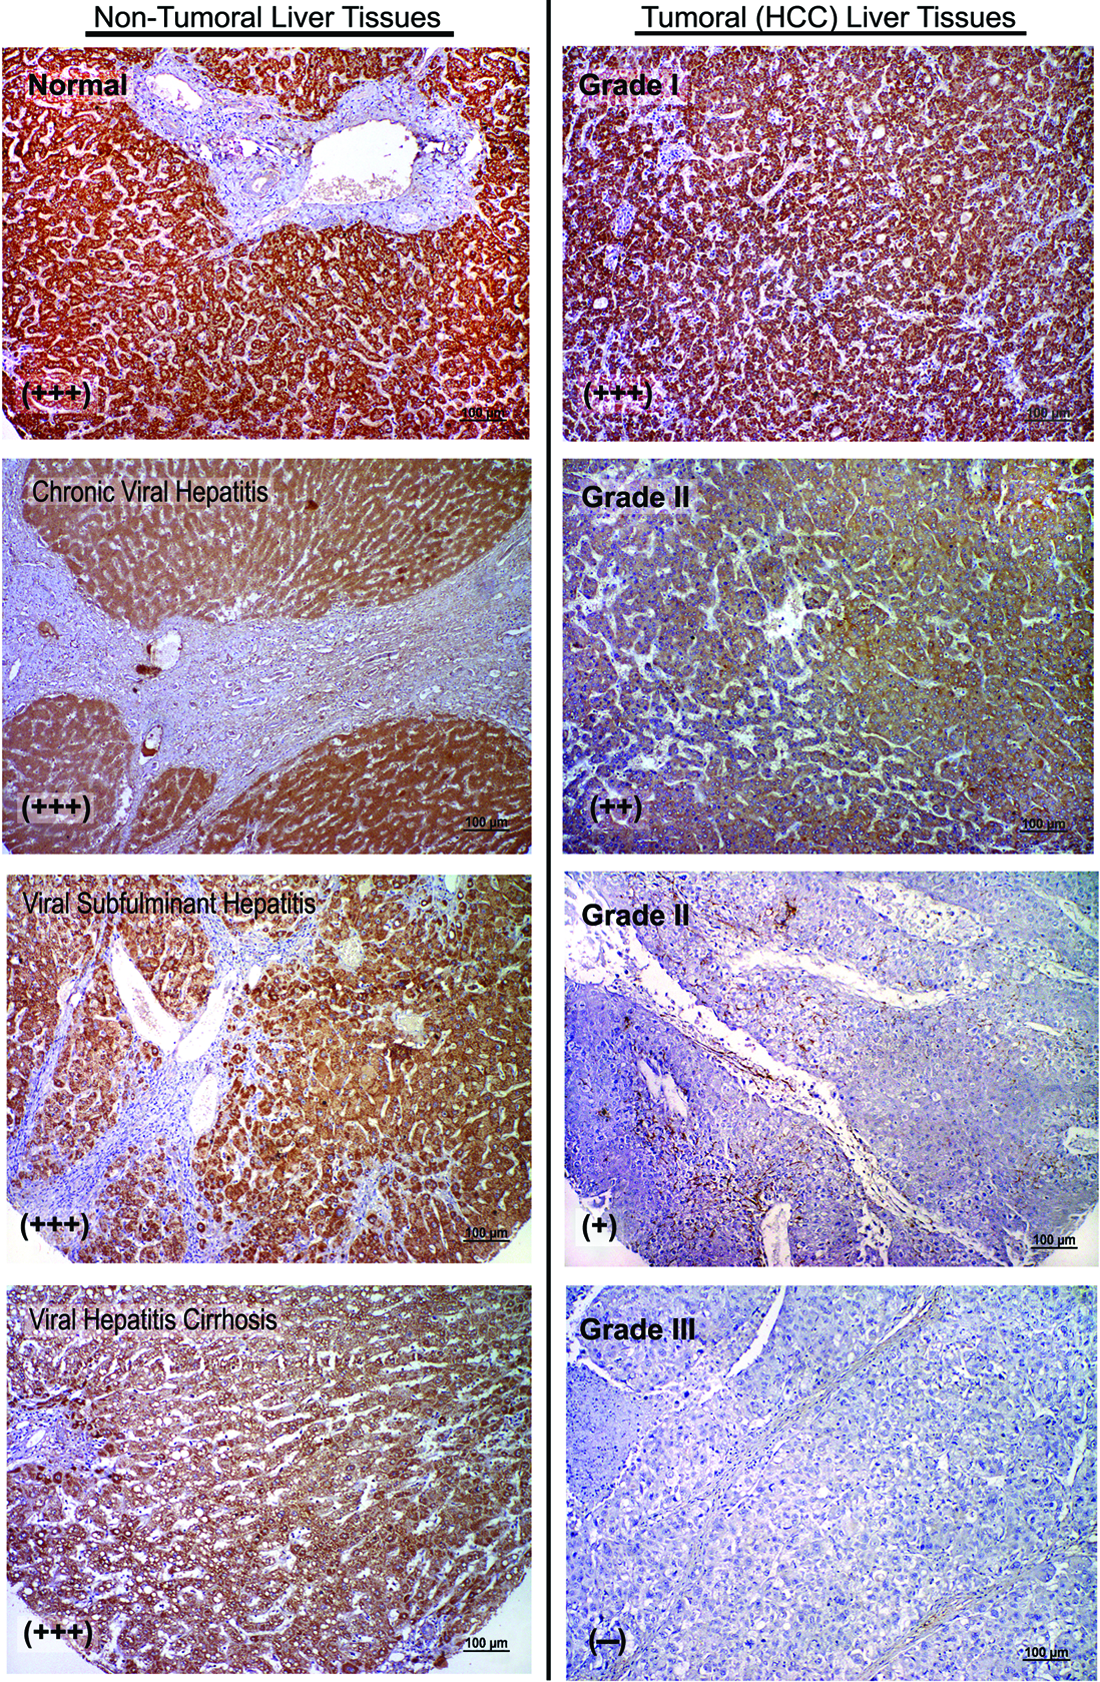
PTPRD protein expression in human liver tissues. Representative photographs from PTPRD immunohistochemistry study performed in non-tumoral and tumoral human liver tissues. Normal liver tissue shows strong, uniform cytoplasmic staining (brown) throughout the tissue. Expression was lost in tumoral liver tissues (grade II and III) (Scale Bars: 100 μm).
Staining intensities expressed as (−): negative, +: weak, ++: moderate, +++: strong.
Numbers represent counts of stained cases in each group.
PTPRD promoter is methylated in primary HCC samples
We sought CpG islands in the promoter region of PTPRD (Veeriah et al., 2009) by using MethPrimer software (Li et al., 2002) and described a CpG island near transcription initiation site (Fig. 6). Then, we analyzed this CpG island in archival HCC samples by COBRA method to determine its methylation level (Supplementary Fig. S1). In 6 out of 27 (22.2%) normal-tumor pairs, tumors had high level of methylation (Fig. 7, Supplementary Fig. S3).
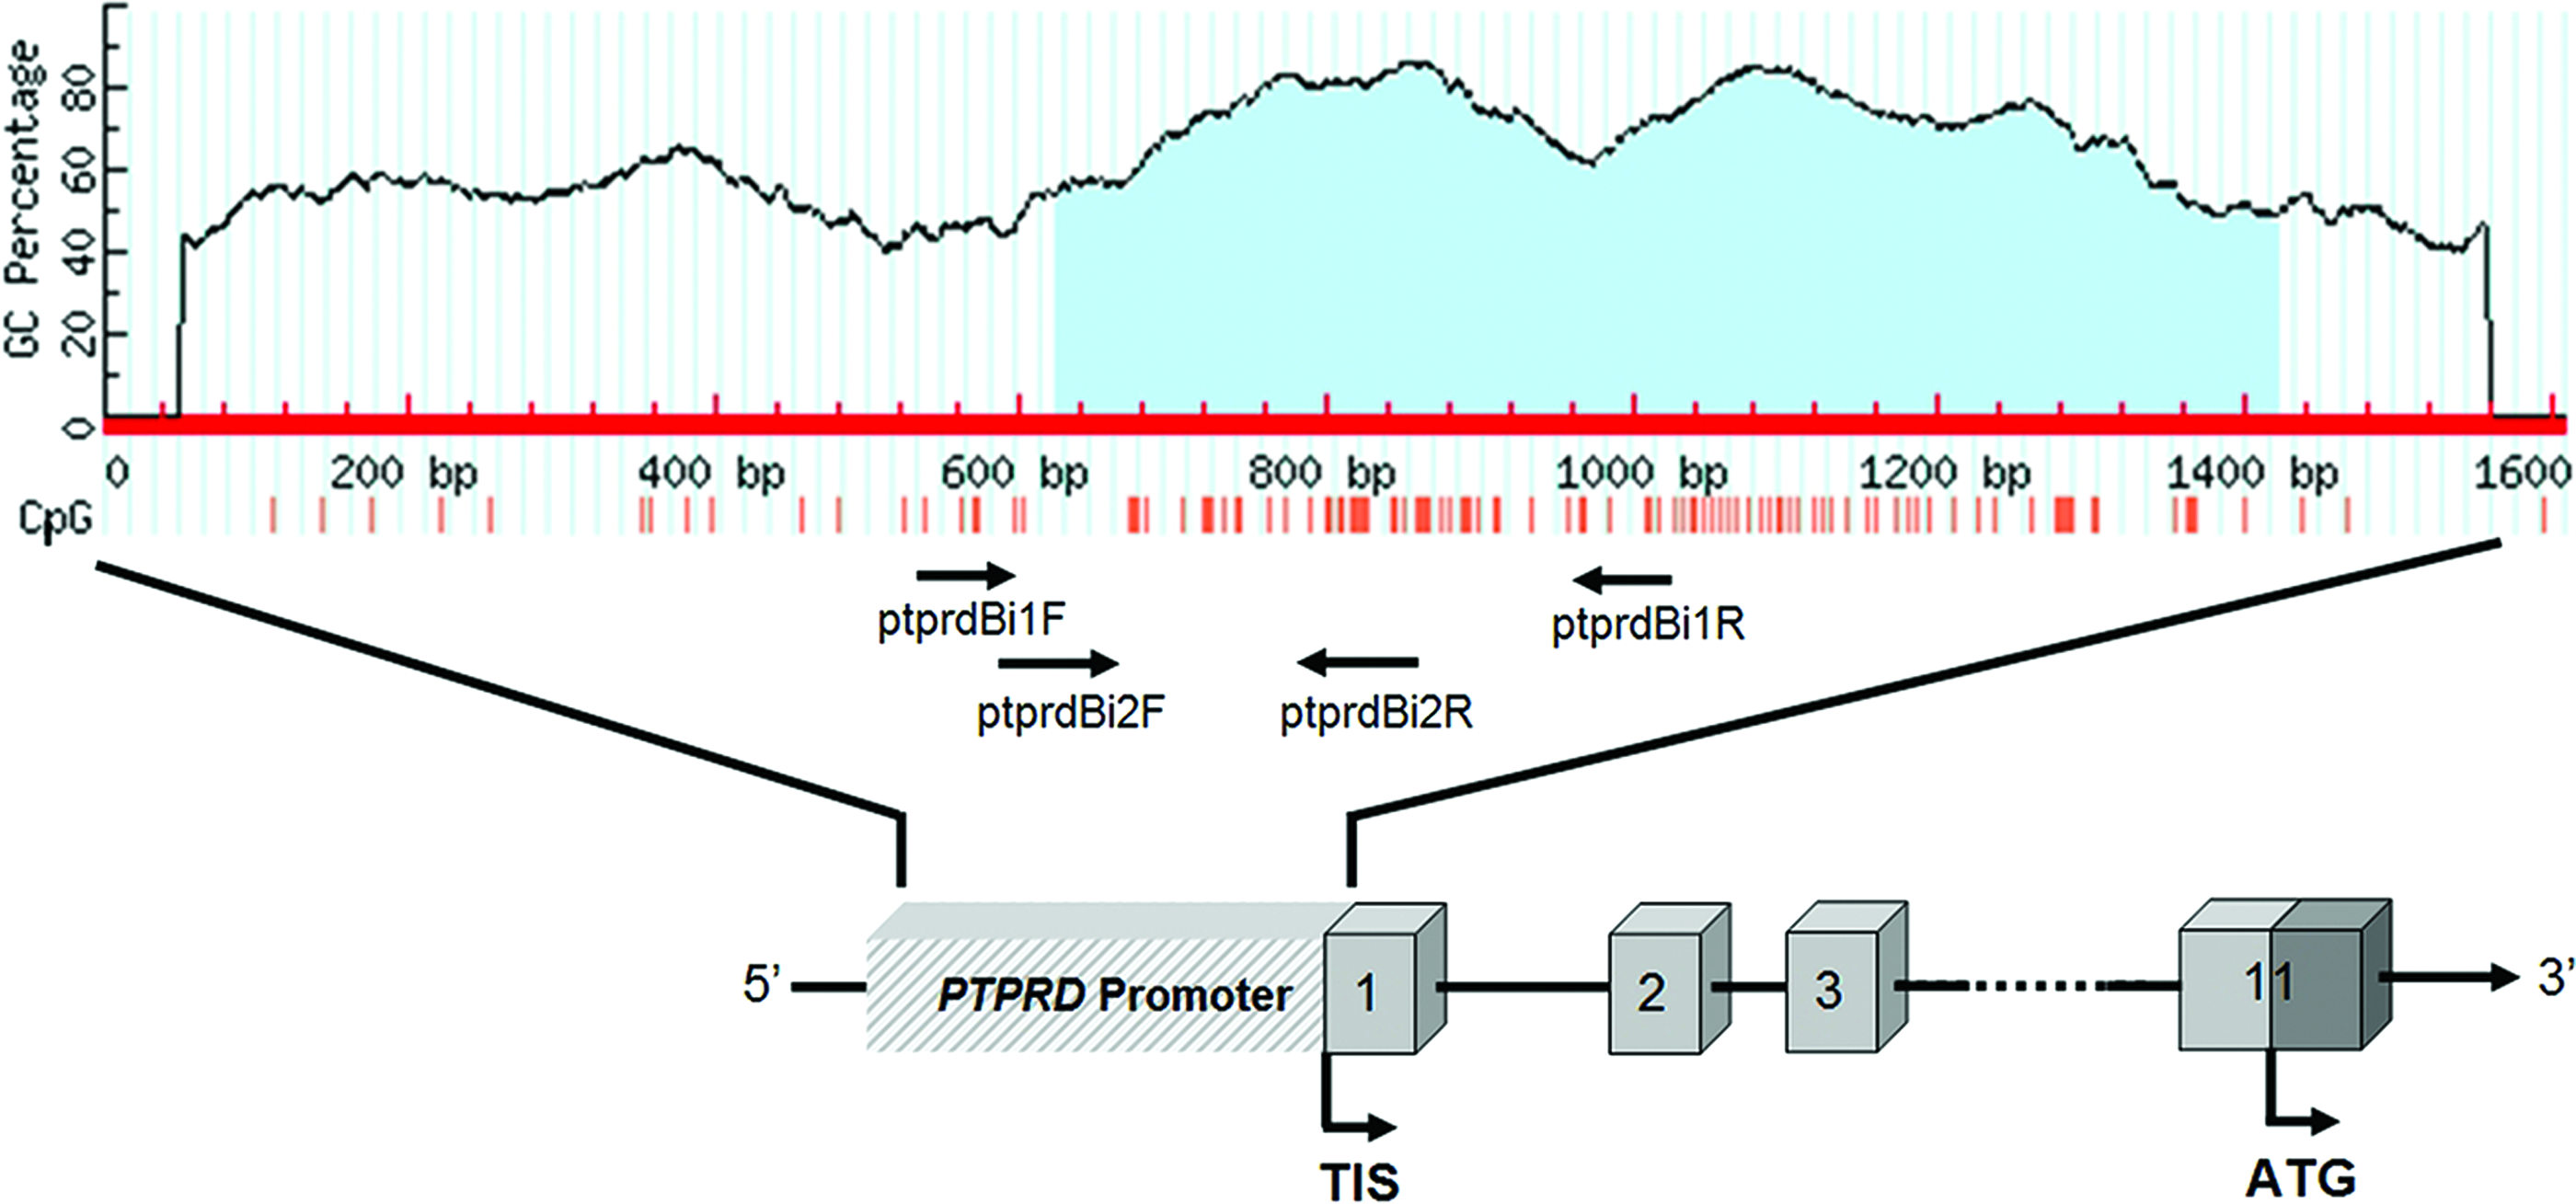
CpG island at promoter region of the PTPRD gene is shown as light blue area in the graph. Primers used for the analysis of methylation status are indicated as arrows. Red vertical lines denote CpG sites, numbered boxes denote exons, and “TIS” denotes the transcriptional start site.
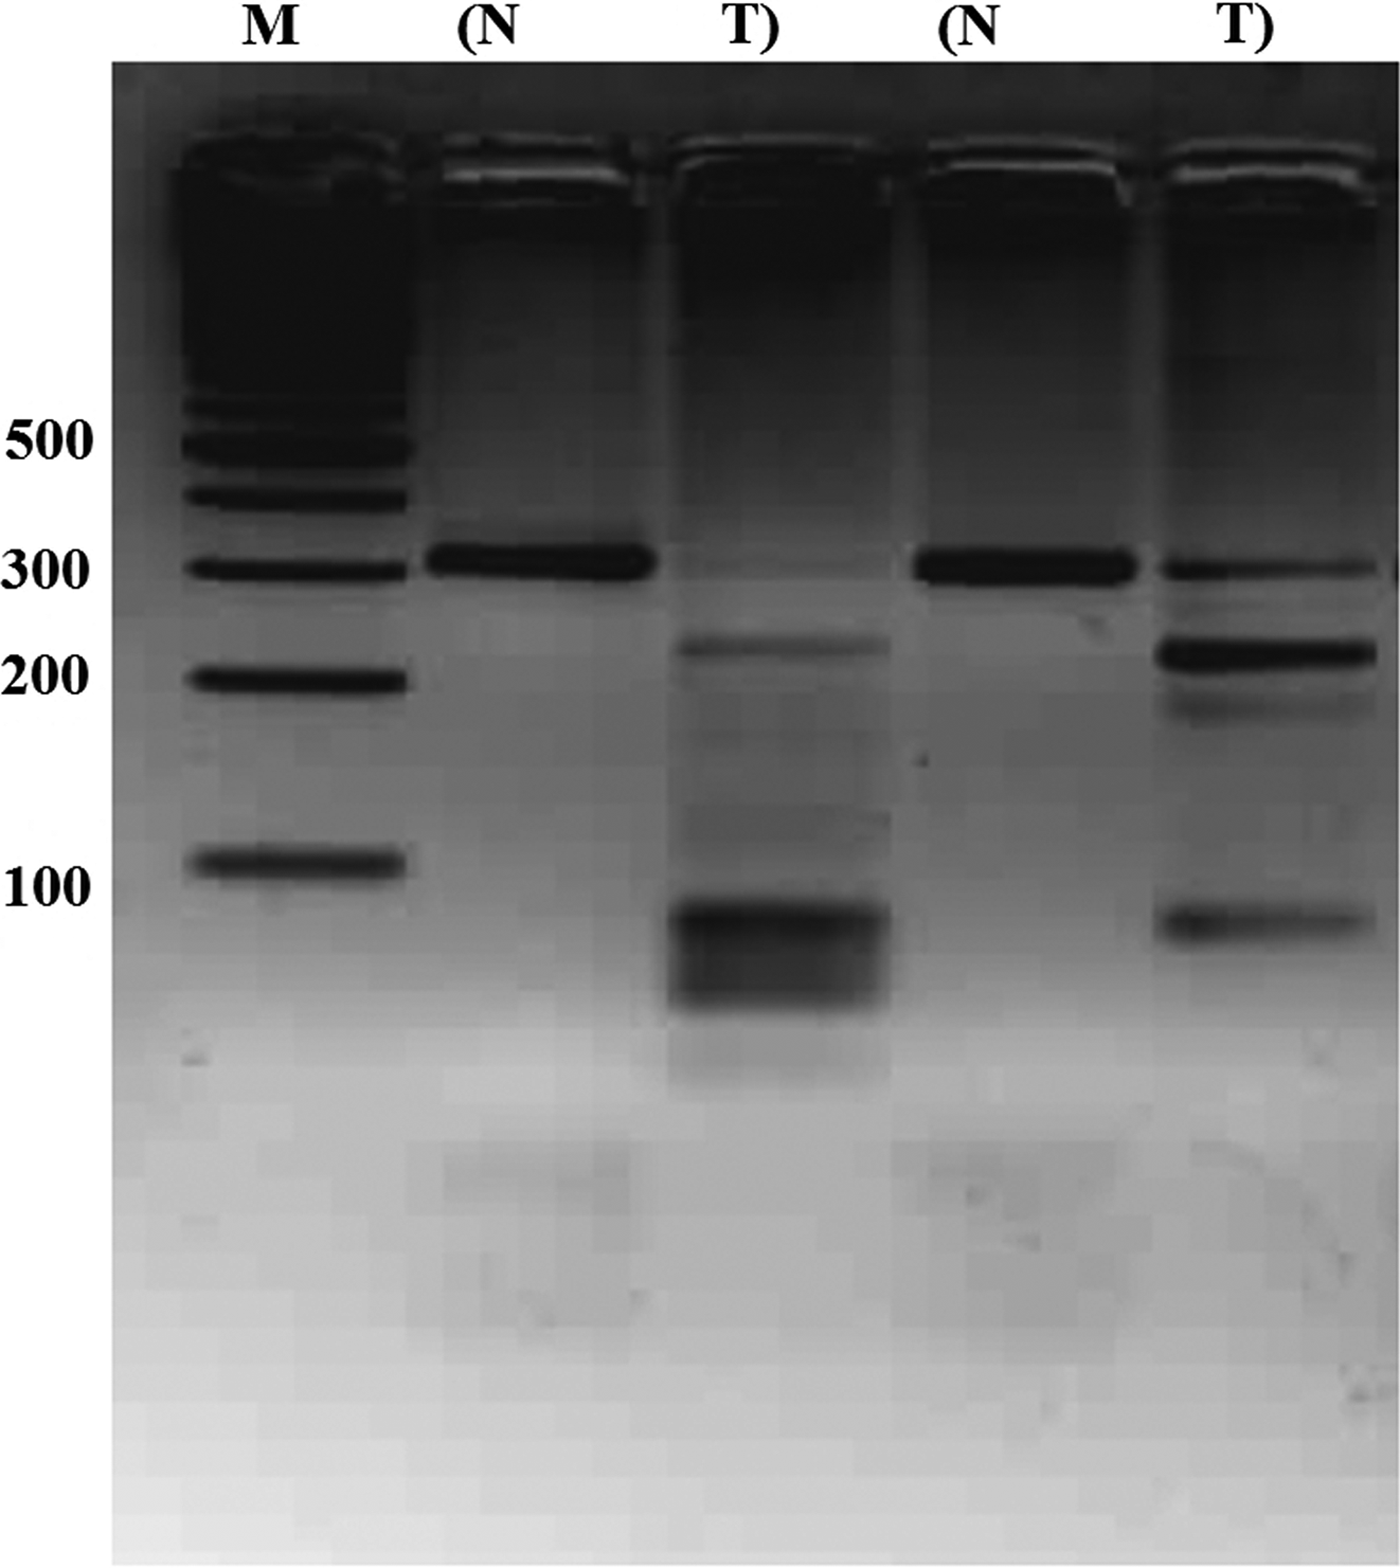
Methylation analysis of PTPRD promoter region by COBRA. Photograph is representative of COBRA method results. Promoter region was amplified and Normal–Tumor paired amplicons were cut with BstUI restriction enzyme. M, marker; N, normal; T, tumor.
PTPRD expression is restored by 5-AzaC and TSA
The Hep3B cell line has no described PTPRD locus deletions or hot-spot mutations, but it has lower PTPRD expression at the mRNA level. A low expression pattern could be due to epigenetic mechanisms in the form of promoter hypermethylation and/or histone deacetylation (Cameron et al., 1999). To test this hypothesis, we treated cells with DNA methyl transferase inhibitor (5-AzaC) and/or histone deacetylase inhibitor (TSA) (Fig. 8) and successfully restored the PTPRD expression in the treated cells. Besides, we observed similar results in PLC cells (data not shown).
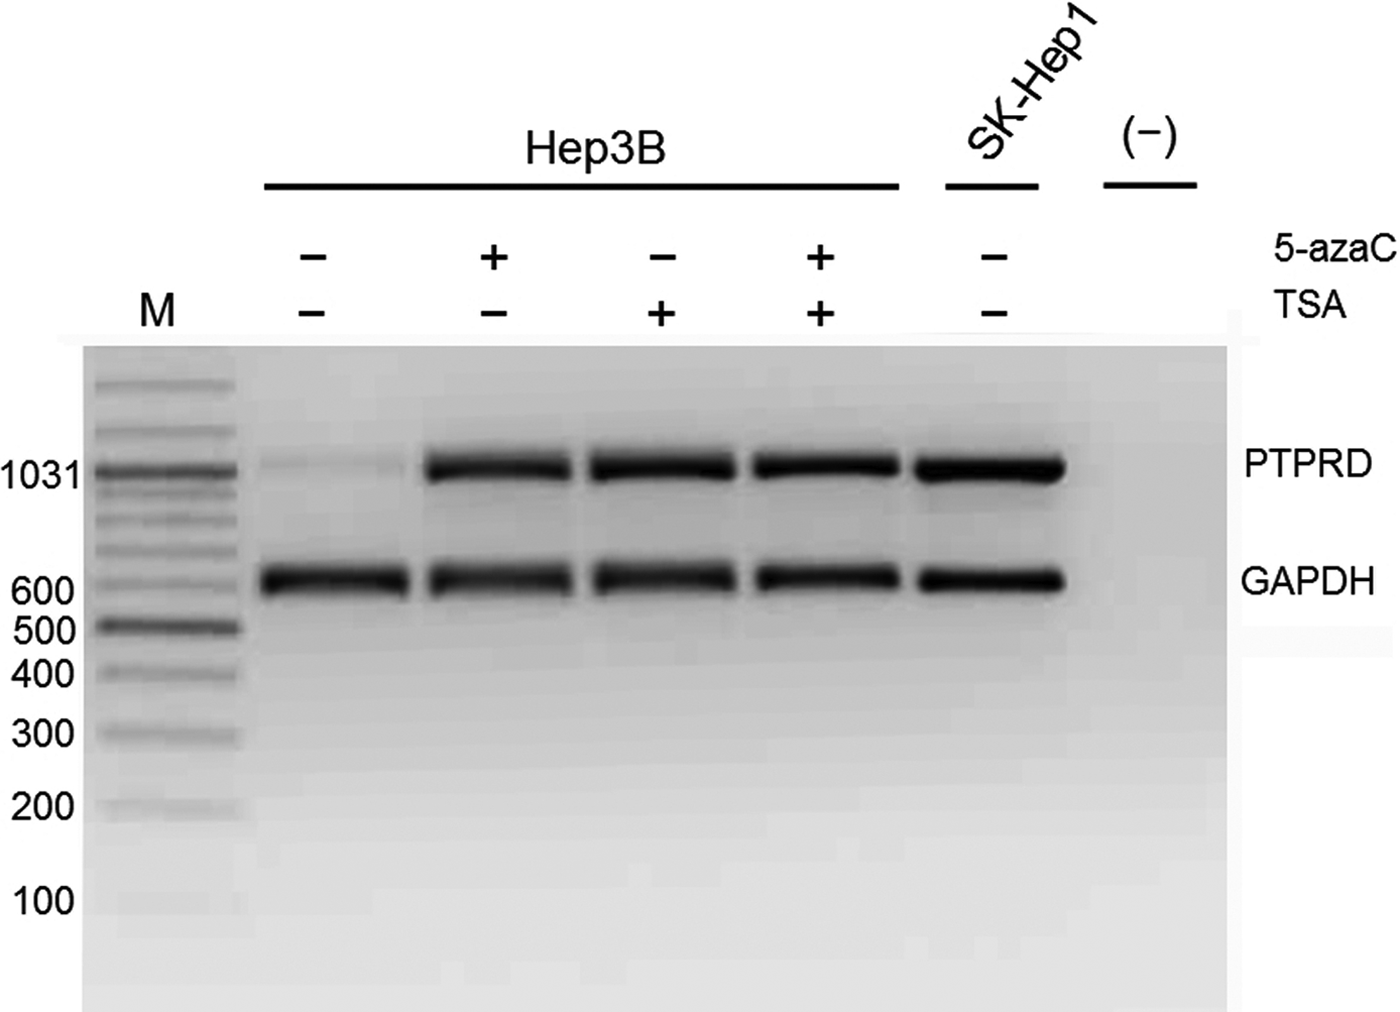
Treatment with 5-AzaC and/or TSA restored PTPRD expression in Hep3B cell line. Multiplex semi-quantitative RT-PCR results showing restoration of PTPRD mRNA expression in Hep3B cell line after 5'-AzaC (2.5 μM) and/or TSA (1 μM) treatment. SK-Hep1 cell line was included as a positive control of PTPRD expression. GAPDH was used as an internal control. M, marker (bp); [(-)], DNA-free PCR mixture.
Discussion
In this study, we examined the putative DNA copy number changes in the genomic DNAs of 14 HCC cell lines using SNP microarrays in order to identify genetic loci that are involved in hepatocarcinogenesis. We observed several copy number gains (on chromosomes 8, 9, 12, 14, 15, 16, 17, 19, 22, and X) and three homozygous deletions (on chromosomes 9, 13, and X). We excluded LOH profiles based on genotype calls due to the cell line's nature. The cell lines used in this study were hyperploid; therefore using genotyping calls as a qualitative marker would be erroneous.
There were two distinct interstitial regions of deletions on the short arm of chromosome 9 localized at 9p22.1–p21.2 and 9p23. The 9p22.1–p21.2 region harbors important tumor suppressor locus of cyclin-dependent kinase inhibitor 2 (CDKN2) that has been shown to be frequently inactivated in HCC (Biden et al., 1997). Concerning 9p23, PTPRD localizes at this region that is frequently deleted in various tumors (Giefing et al., 2011; Guichard et al., 2012; Kohno et al., 2010; Nair et al., 2008; Nalesnik et al., 2012; Purdie et al., 2007; Solomon et al., 2008; Stallings et al., 2006; Stark et al., 2007; Zhao et al., 2005). Interestingly, a recent in vivo study has shown that heterozygous loss of Ptprd is sufficient to promote tumorigenesis, and co-deletion of Ptprd and Cdkn2a accelerate tumorigenesis in mice (Ortiz et al., 2014).
Our results provide a comprehensive genome-wide copy-number profile of the most commonly used 14 HCC cell lines and showed deletions in 2 out of 14 HCC cell lines, Mahlavu and SNU475, in 5′UTR and coding region, respectively (Fig. 1, Fig. 2). The Sanger CONAN (Copy Number Analysis) database showed the same exonic deletion in SNU475 cell line, but among the 14 HCC cell lines that we analyzed, seven cell lines (Mahlavu, SNU398, Focus, SNU182, Hep40, HepG2, and Hep3B) are absent in this database (Bamford et al., 2004). Recently, two deletions were described in an intronic region (between exons 24–25) and 5′UTR region (between exons 7–9), in 17% and 0.08% of HCC samples, respectively (Guichard et al., 2012; Nalesnik et al., 2012).
Since many tumor suppressor genes are silenced during carcinogenesis, we investigated PTPRD mRNA levels in HCC cell lines and found low or undetectable expression in 11 out of 14 cell lines (Fig. 3). We than extended this study to clinical samples and observed that 82.6% primary HCCs were displaying low PTPRD mRNA expression. Our results show that downregulation of PTPRD was not restricted to the cell lines but also occurred in vivo (Fig. 4).
Immunohistochemical analysis confirmed the reduction of PTPRD in HCCs at the protein level. There is a significant difference between normal (non-tumoral) and HCC samples according to their PTPRD expression profile (P value=0.0002; Table 1). Moreover, there is a tendency towards a lower expression of PTPRD in cancer samples with higher grades compare to lower grades, which may indicate PTPRD's prognostic value in HCCs.
Although tumor suppressor genes are commonly inactivated by loss-of-function mutations in cancer, somatic PTPRD mutations in HCCs have been reported with very low rates (1.4%–4%) (Bamford et al., 2004; Guichard et al., 2012), which is consistent with our observation. Our targeted mutation analysis failed to detect somatic mutation in HCC cell lines and HCC samples.
Downregulation of tumor suppressor genes by epigenetic mechanisms is a common phenomena in cancer (Cameron et al., 1999). As somatic mutations were not frequent in HCCs, we reasoned the downregulation of PTPRD due to epigenetic silencing. First, we checked the methylation status of PTPRD promoter in HCC samples. Six out of 27 tumors (22.2%) displayed higher CpG methylation, suggesting that promoter methylation of PTPRD is a frequent event in HCCs (Fig. S3). Some non-tumoral counterparts of HCC samples also displayed methylation, which can be explained by the presence of precancerous lesions in these tissues. Moreover, PTPRD expression was successfully restored in Hep3B cell line after 5-AzaC and/or TSA treatments, providing an additional layer of evidence for epigenetic silencing (Fig. 8). Thus, our data suggest that PTPRD promoter hypermethylation and histone deacetylation are associated with downregulation of the PTPRD.
Conclusions
PTPRD is homozygously deleted and epigenetically downregulated in human HCCs. Consequently, it seems reasonable to hypothesize that PTPRD expression may have potential clinical value, presumably as a prognostic marker. We anticipate that such questions will be a subject of future research with studies in larger samples. Compelling evidence that is present in other organ systems for a role of PTPRD inactivation strengthen the hypothesis suggesting PTPRD as a strong candidate for a tumor suppressor gene in HCC.
Footnotes
Acknowledgments
We thank Prof. Dr. Mehmet Ozturk for kindly providing patient samples used in methylation analysis. We also grateful to Assoc. Prof. Dr. A. Elif Erson Bensan for providing tissue microarrays that were used in immunohistochemistry studies. We also thank Prof. Dr. Ergun Pınarbasi for critically reading the manuscript. This work was supported by Scientific and Technological Research Council of Turkey (TÜBİTAK) Grants 107S174 (to MC Yakicier) and Turkish Council of Higher Education (YÖK) visiting scientist fellowship (to Tolga Acun).
Author contributions: TA designed and processed all the experiments except the SNP microarray study, participated in the design of the study, drafting the manuscript and data interpretation. KD designed and performed the SNP microarray study, analyzed and interpreted the array data, confirmed hit regions, participated in drafting the manuscript. EO and DA designed and participated in the IHC study, interpreted the IHC results, and participated in drafting the manuscript. MCY initiated and coordinated the whole study, participated in the design of the study, drafting the manuscript and data interpretation. All authors have read and approved the final manuscript.
Author Disclosure Statement
The authors declare that they have no competing financial interests.
References
Supplementary Material
Please find the following supplemental material available below.
For Open Access articles published under a Creative Commons License, all supplemental material carries the same license as the article it is associated with.
For non-Open Access articles published, all supplemental material carries a non-exclusive license, and permission requests for re-use of supplemental material or any part of supplemental material shall be sent directly to the copyright owner as specified in the copyright notice associated with the article.