




Abstract
Abstract
Type 2 diabetes mellitus is a major global public health burden. A complex metabolic disease, type 2 diabetes affects multiple different tissues, demanding a “systems medicine” approach to biomarker and novel diagnostic discovery, not to mention data integration across omics-es. In the present study, transcriptomics data from different tissues including beta-cells, pancreatic islets, arterial tissue, peripheral blood mononuclear cells, liver, and skeletal muscle of 228 samples were integrated with protein–protein interaction data and genome scale metabolic models to unravel the molecular and tissue-specific biomarker signatures of type 2 diabetes mellitus. Classifying differentially expressed genes, reconstruction and topological analysis of active protein–protein interaction subnetworks indicated that genomic reprogramming depends on the type of tissue, whereas there are common signatures at different levels. Among all tissue and cell types, Mannosidase Alpha Class 1A Member 2 was the common signature at genome level, and activation-ppara reaction, which stimulates a nuclear receptor protein, was found out as the mutual reporter at metabolic level. Moreover, miR-335 and miR-16-5p came into prominence in regulation of transcription at different tissues. On the other hand, distinct signatures were observed for different tissues at the metabolome level. Various coenzyme-A derivatives were significantly enriched metabolites in pancreatic islets, whereas skeletal muscle was enriched for cholesterol, malate, L-carnitine, and several amino acids. Results have showed utmost importance concerning relations between T2D and cancer, blood coagulation, neurodegenerative diseases, and specific metabolic and signaling pathways.
Introduction
T
The duration of hyperglycemia caused by failure of beta-cells also affects insulin secretory capacity, mass, and apoptosis rate of beta-cells, resulting in additional alterations in several processes such as islet inflammation, amyloid deposition, critical B-cell phenotypic alterations (Prentki and Nolan, 2006). On the other hand, the state of hyperglycemia damages nerves and blood vessels, leading to major health-related issues such as cardiovascular diseases, stroke, blindness, dental problems, and diabetes-related amputations. Other complications of T2D include enhanced vulnerability to neurodegenerative diseases, presence of various cancer types, pregnancy problems, loss of mobility with aging, and depression (Musselman et al., 2003; Retnakaran et al., 2006).
Due to the high prevalence of T2D and its fateful complications, identifying the genes or genetic factors associated with the development of T2D and elucidating the mechanisms underlying the disease are crucial in prognosis, and development of personalized medicine and therapeutic strategies.
Since it is a polygenic disorder (i.e., multiple genes located on different chromosomes take active roles in the development of the disease), it is better to reveal that gene expression varies more across tissues than across individuals. Several studies reported findings on T2D gene expression profiles of different tissues individually (Kazier et al., 2007; Cangemi et al., 2011; Misu et al., 2010; van Tienen et al., 2012; Dominguez et al., 2011). Despite individual studies exploring T2D specific genes in various tissues, studies considering the meta-analysis of diverse transcriptomics datasets and integrating gene expression profiles with biological networks are very limited.
Keller and co-workers (2008) studied gene expression profiles in eight experimental groups of lean and obese mice. Six tissues (pancreatic islets, adipose, liver, gastrocnemius, soleus, and hypothalamus) were analyzed for their T2D effects. Very recently, Zhang and colleagues (2015) proposed a methodology integrating gene expression profiles with protein–protein interactions to identify module biomarkers (i.e., sets of interacted genes with discriminant ability). Module biomarkers constituted from transcriptome data of skeletal muscle have been reported as high performance indicators in classification of T2D, and possess a reliably high precision across various tissues such as liver, beta-cells, and heart, in addition to skeletal muscle. Increased rate of transcriptome data related to T2D provides advantage to work on comparative analysis across various human tissues.
Genome-scale biological networks provide a systems-level understanding of the mechanisms underlying diseases by serving as a model for data integration and analysis. Recently, genome scale metabolic networks (GEMs) were constructed using high throughput genome-wide data.
Biochemical knowledge based on human metabolism can be attained by current versions of Recon 2 (Reconstruction of the Human Genome) database (Thiele et al., 2013), along with HMR 2.0 (Human Metabolic Reaction) database (Mardinoglu et al., 2014). Similarly, theoretical advances in network science and paralleling advances in high-throughput efforts have provided a conceptual framework with which we interpret protein–protein interaction networks (Sevimoglu and Arga, 2014).
On the other hand, regulatory network studies including transcriptional factors and lately microRNAs are promising areas of complex diseases and their effects. The miRNAs are key regulators of a wide variety of fundamental biological processes, such as proliferation, differentiation, apoptosis, mobility, and invasiveness (Huang et al., 2011) and dysregulation of miRNAs are linked to many diseases (Fabian et al., 2010). Also, miRNAs could play an important role in the diabetes development processes, such as in insulin secretion, beta-cell differentiation, and pancreatic islet development. Many miRNAs were already associated with T2D in literature, for example miR-375, which is one of the abundant miRNAs in beta cells and pancreatic islets, has been one of the first identified with a priori function in the diabetes diseases (Tang et al., 2008).
Since T2D is a polygenic and complex disease, the identification of diverse genes associated with T2D was not surprising. However, an important reason for the inconsistency in the findings on gene expression profiling studies is that these studies were performed using various cell or tissue types from T2D patients. The distinct signatures of T2D in different tissue types may present relations between tissue-specific T2D related gene expressions and metabolite profiles, thus revealing potential pathological mechanisms and its relationships with other diseases.
This study aims at the identification of tissue-specific gene sets and reporter biomolecules (i.e., metabolites, proteins, miRNAs) that were differentially expressed in T2D patients. High throughput transcriptomics datasets associated with T2D were integrated with human biological networks (protein–protein interaction network, metabolic network, and transcriptional regulatory interaction network) to elucidate the genetic mechanism underlying the disease and to shed light on the mutual and tissue-specific disease mechanisms.
Materials and Methods
Gene expression datasets of T2D
The raw data of high throughput gene expression datasets associated with T2D from a total of seven studies (GSE2572, GSE19420, GSE20966, GSE38642, GSE13760, GSE23343, and GSE9006) have been obtained from Gene Expression Omnibus (GEO) (Barrett et al., 2013) and analyzed to characterize gene expression profiles in T2D (Table 1). The samples in these datasets were taken from pancreas (pancreatic islets and beta-cells), liver, skeletal muscle, arterial tissue, and blood (peripheral blood mononuclear cells). A total of 228 samples were explored, including 149 nondiabetic and 79 T2D.
Identification of differentially expressed genes
The previously designed methodology (Karagoz et al., 2015), employing RMA normalization (Irizarry et al., 2003) and linear models for microarray data (LIMMA) method (Smyth et al, 2003), was followed in statistical analysis of each dataset in order to identify differentially expressed genes (DEGs). DEGs were selected according to computed p < 0.05. At least 20% alteration in average expression levels between two conditions was considered as significant in determination of up- or downregulation of DEGs. The gene–protein associations were obtained from UniProt ID Mapping tool (Uniprot Consortium, 2014) and bioDBnet platform (Mudunuri et al., 2009).
Functional enrichment analysis
Enrichment analyses were carried out through DAVID bioinformatics tool (Huang et. al., 2009) to find out functional annotations (i.e., signaling and metabolic pathways, biological processes, molecular functions, and cellular components) that DEGs were significantly associated with. Kyoto Encyclopedia of Genes and Genomes (KEGG) (Kanehisa et al., 2012) and Gene Ontology (GO) terminology (Barrett et al., 2013) were employed as annotation sources. Benjamini correction was used as the multiple testing correction technique and enrichment results with adjusted p < 0.05 were considered as statistically significant.
Protein–protein interaction (PPI) subnetworks associated with T2D
The physical protein–protein interaction dataset of Homo sapiens was obtained from iRefIndex Database (Razick et al., 2008). The interactions associated with proteins corresponding to DEGs were identified and PPI networks consisting of down- and upregulated genes were reconstructed. The visualization and topological analysis of the PPI network was performed via Cytoscape (Shannon et al., 2003). The dual-metric approach (Karagoz et al., 2015), incorporating degree as a local metric and betweenness centrality as a global metric, was employed in determination of hub proteins via Cytohubba plugin (Chin et al., 2014).
Reporter metabolites associated with T2D
Differentially expressed genes were integrated into Human Metabolic Model HMR 2.0 (Mardinoglu et al., 2014) via BIOMET Toolbox (Agren et al., 2013), and p values of reporter metabolites were determined. Benjamini correction was used as the multiple testing correction technique and reporter metabolites with adjusted p < 0.05 were considered as statistically significant. The top 20 reporter metabolites were taken into consideration in further analysis as significantly influenced in tissues of T2D. The biological roles of metabolites and related metabolic pathways as well as diseases were explored through MBRole bioinformatics tool (Chagoyen and Pazos, 2011).
Transcriptional regulatory modules associated with T2D
Down- and upregulated hubs were employed to reconstruct transcriptional regulatory networks. Transcriptional regulations between transcription factors (TFs) and downstream effectors in the transcriptional regulatory network were acquired from GENOMATIX (Genomatix Software Inc, Ann Arbor, MI, USA). The TF–gene and miRNA–gene interactions were assembled from the PAZAR database of transcription factors and regulatory sequence annotation (Portales-Casamar et al., 2010) and the miRTarbase repositories of experimentally supported miRNA gene targets interactions (Hsu et al., 2014), respectively. TF–gene and miRNA–gene interactions of each tissue/cell associated hub genes were extracted from downloaded data to identify common transcriptional regulatory elements (i.e., TFs and miRNAs) at various tissue/cells. Visualization of interaction networks were accomplished using Cytoscape.
Results
T2D related differentially expressed genes (DEGs) across different tissues
In the present study, we investigated eight gene expression datasets for T2D, which included samples of nondiabetic and T2D tissues. The impressions of T2D at gene expression levels were distinct in different tissues indicating that the genomic reprogramming depends on the type of tissue (Supplementary Table S1; supplementary material is available online at www.liebertpub.com/omi). However, a common signature was that most of the DEGs were upregulated. Result of statistical analyses of datasets yielded a total of 18514 genes as DEGs, 6696 of which were downregulated, while 11,818 were upregulated. There was a substantial amount of upregulated activity in pancreatic islets (Table 1).
Despite the high number of DEGs in T2D datasets, the comparative analyses of DEG sets demonstrated a small number of mutual genes (i.e., Mannosidase Alpha Class 1A Member 2 (MAN1A2) was the only common DEG among all tissue and cell types). There were also mutual DEGs across several tissues. For instance, the expressions of ITIH4, AKAP13, and ZFP36L2-EIF4E-MTRR gene set were altered in three cell and tissue types: pancreatic islets, arterial tissue, and beta cells. Pancreatic islets were the most influenced tissue as predicted, while the least influenced was arterial tissue (Fig. 1). According to comparative analysis, liver, pancreatic islets, and PBMCs had the highest number of mutual DEGs with 265 genes.
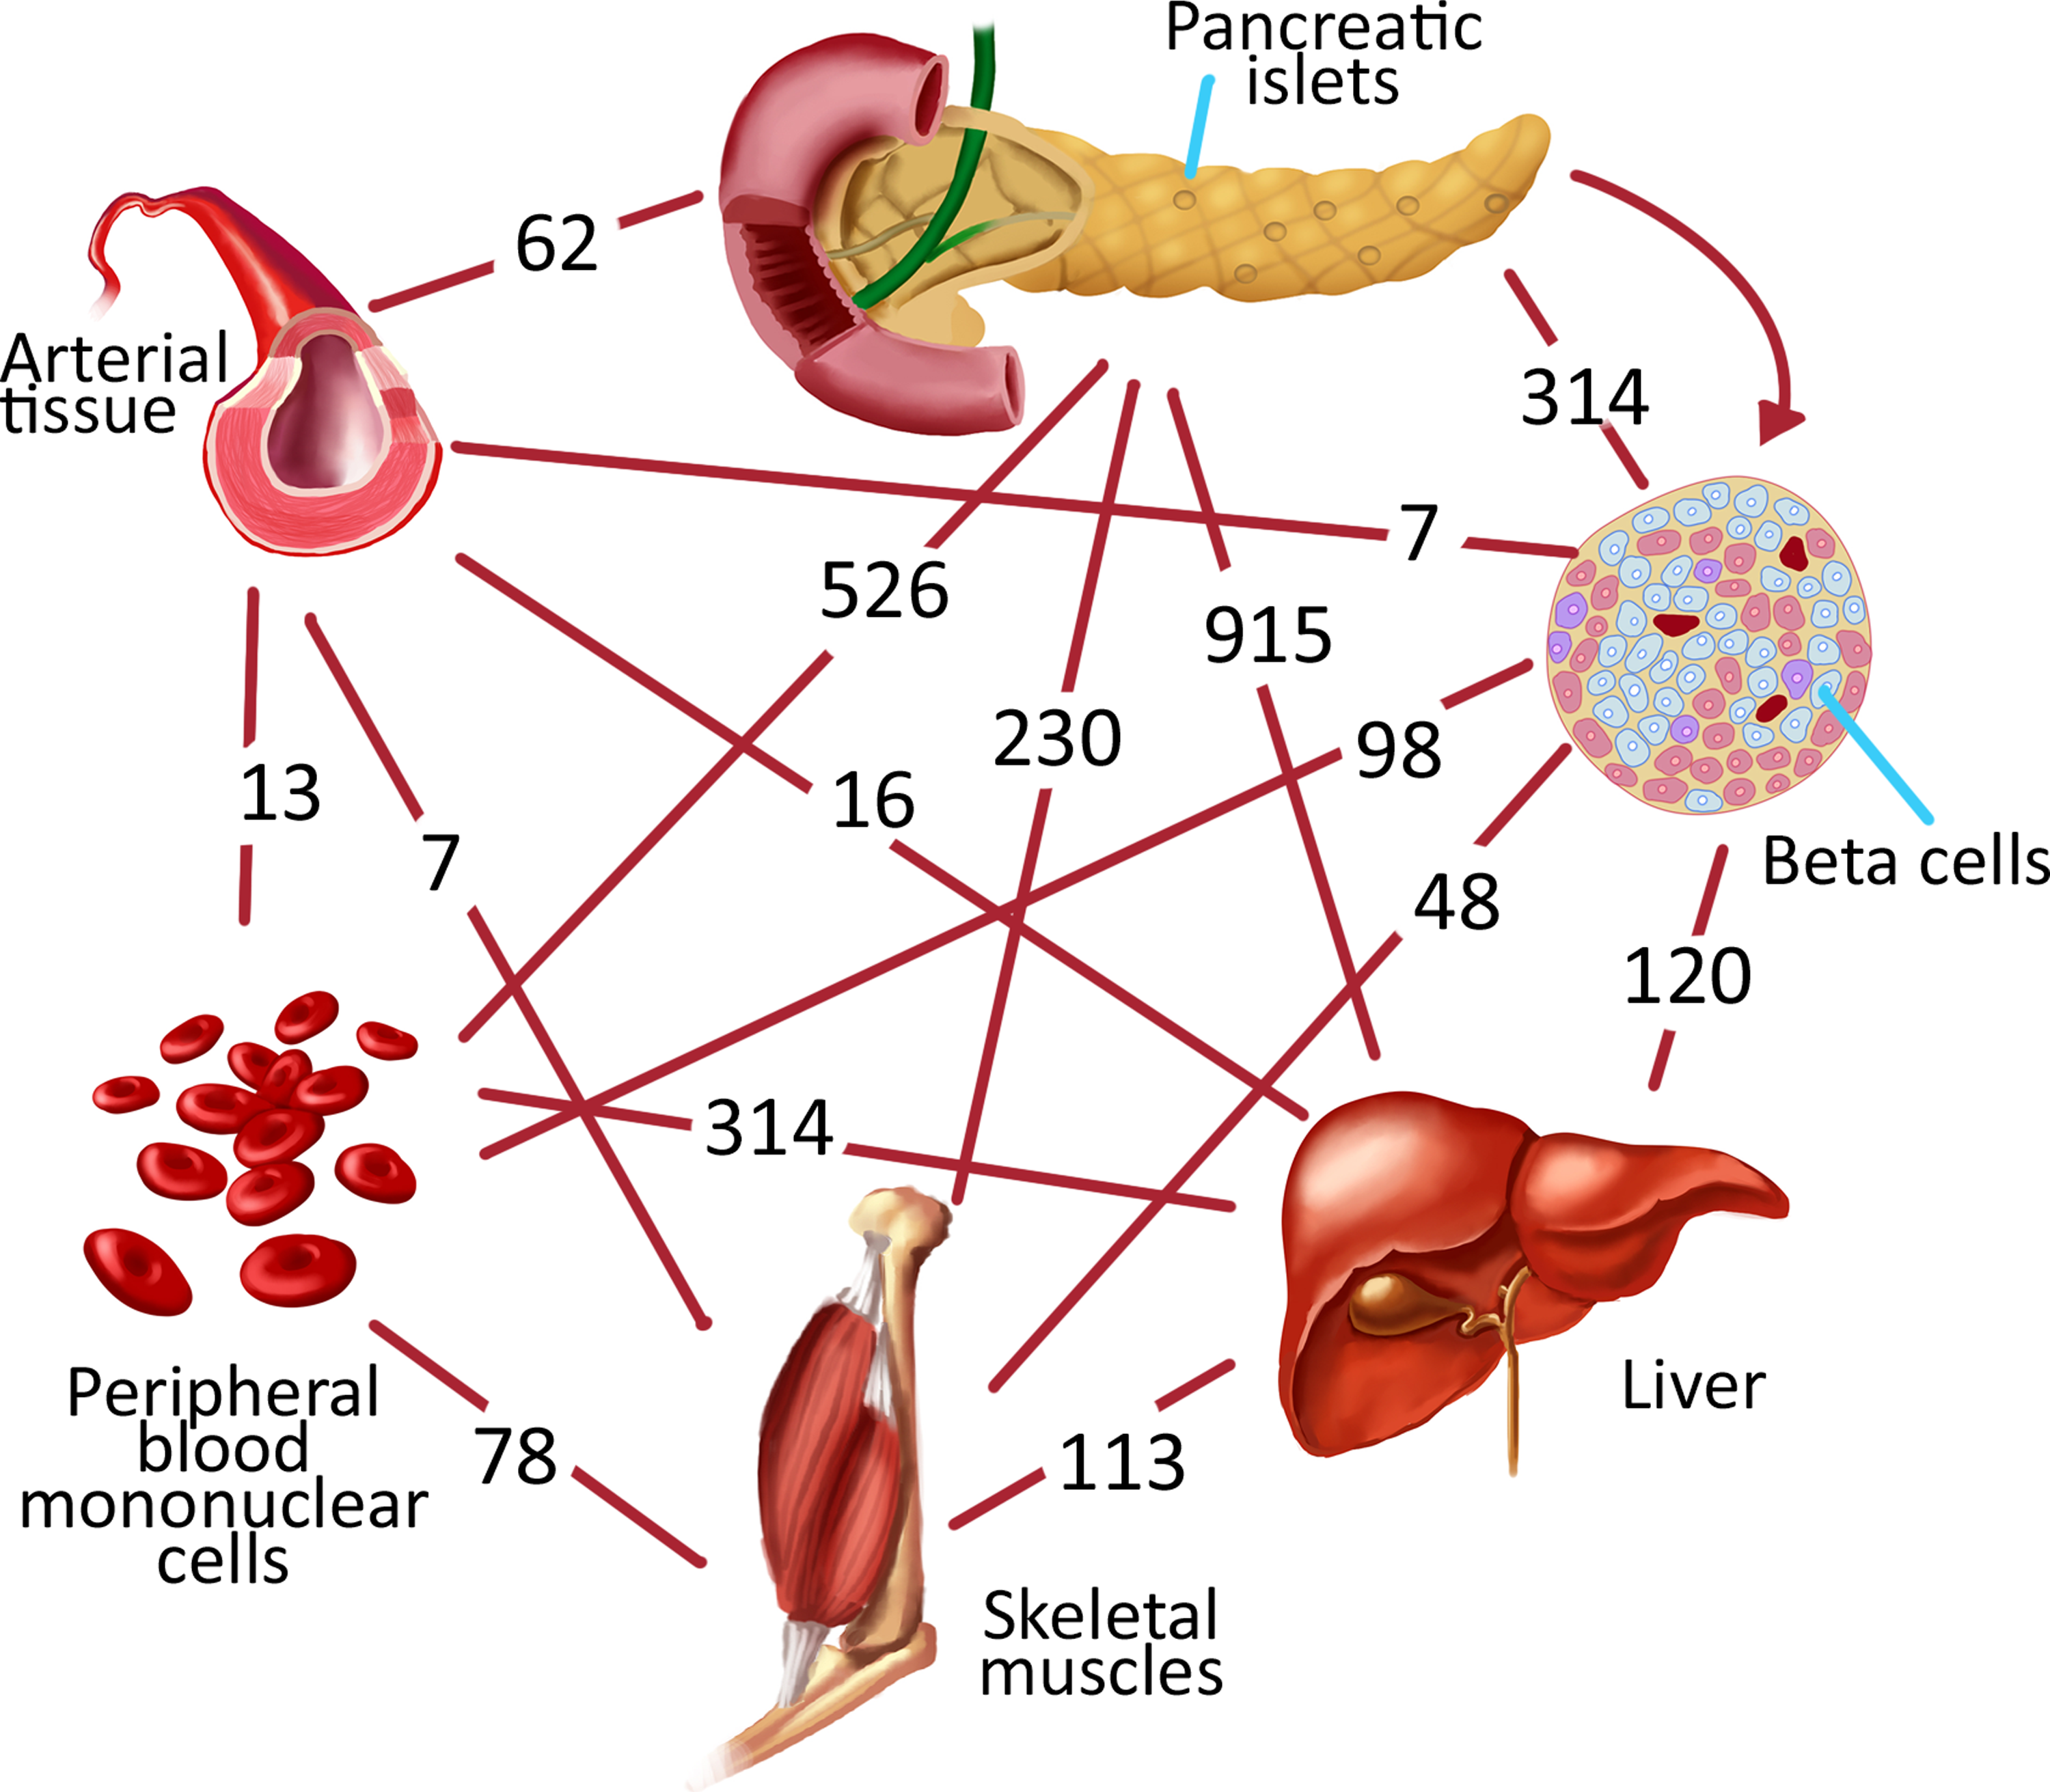
Mutual DEGs between only two different tissues/cells.
The enrichment results based on DEGs indicated that several signaling pathways and biological processes were mutual among the individual tissue types (Fig. 2A, Supplementary Table S2). Signaling by insulin receptor came into prominence in all tissues except beta cells. Pathways in cancer, prostate cancer, and PDGF signaling pathways were highlighted in all tissues except beta cells and arterial tissue. Moreover, B cell activation, which is among the mechanisms of immune response, was also detected in all tissues except skeletal muscle and arterial tissues.
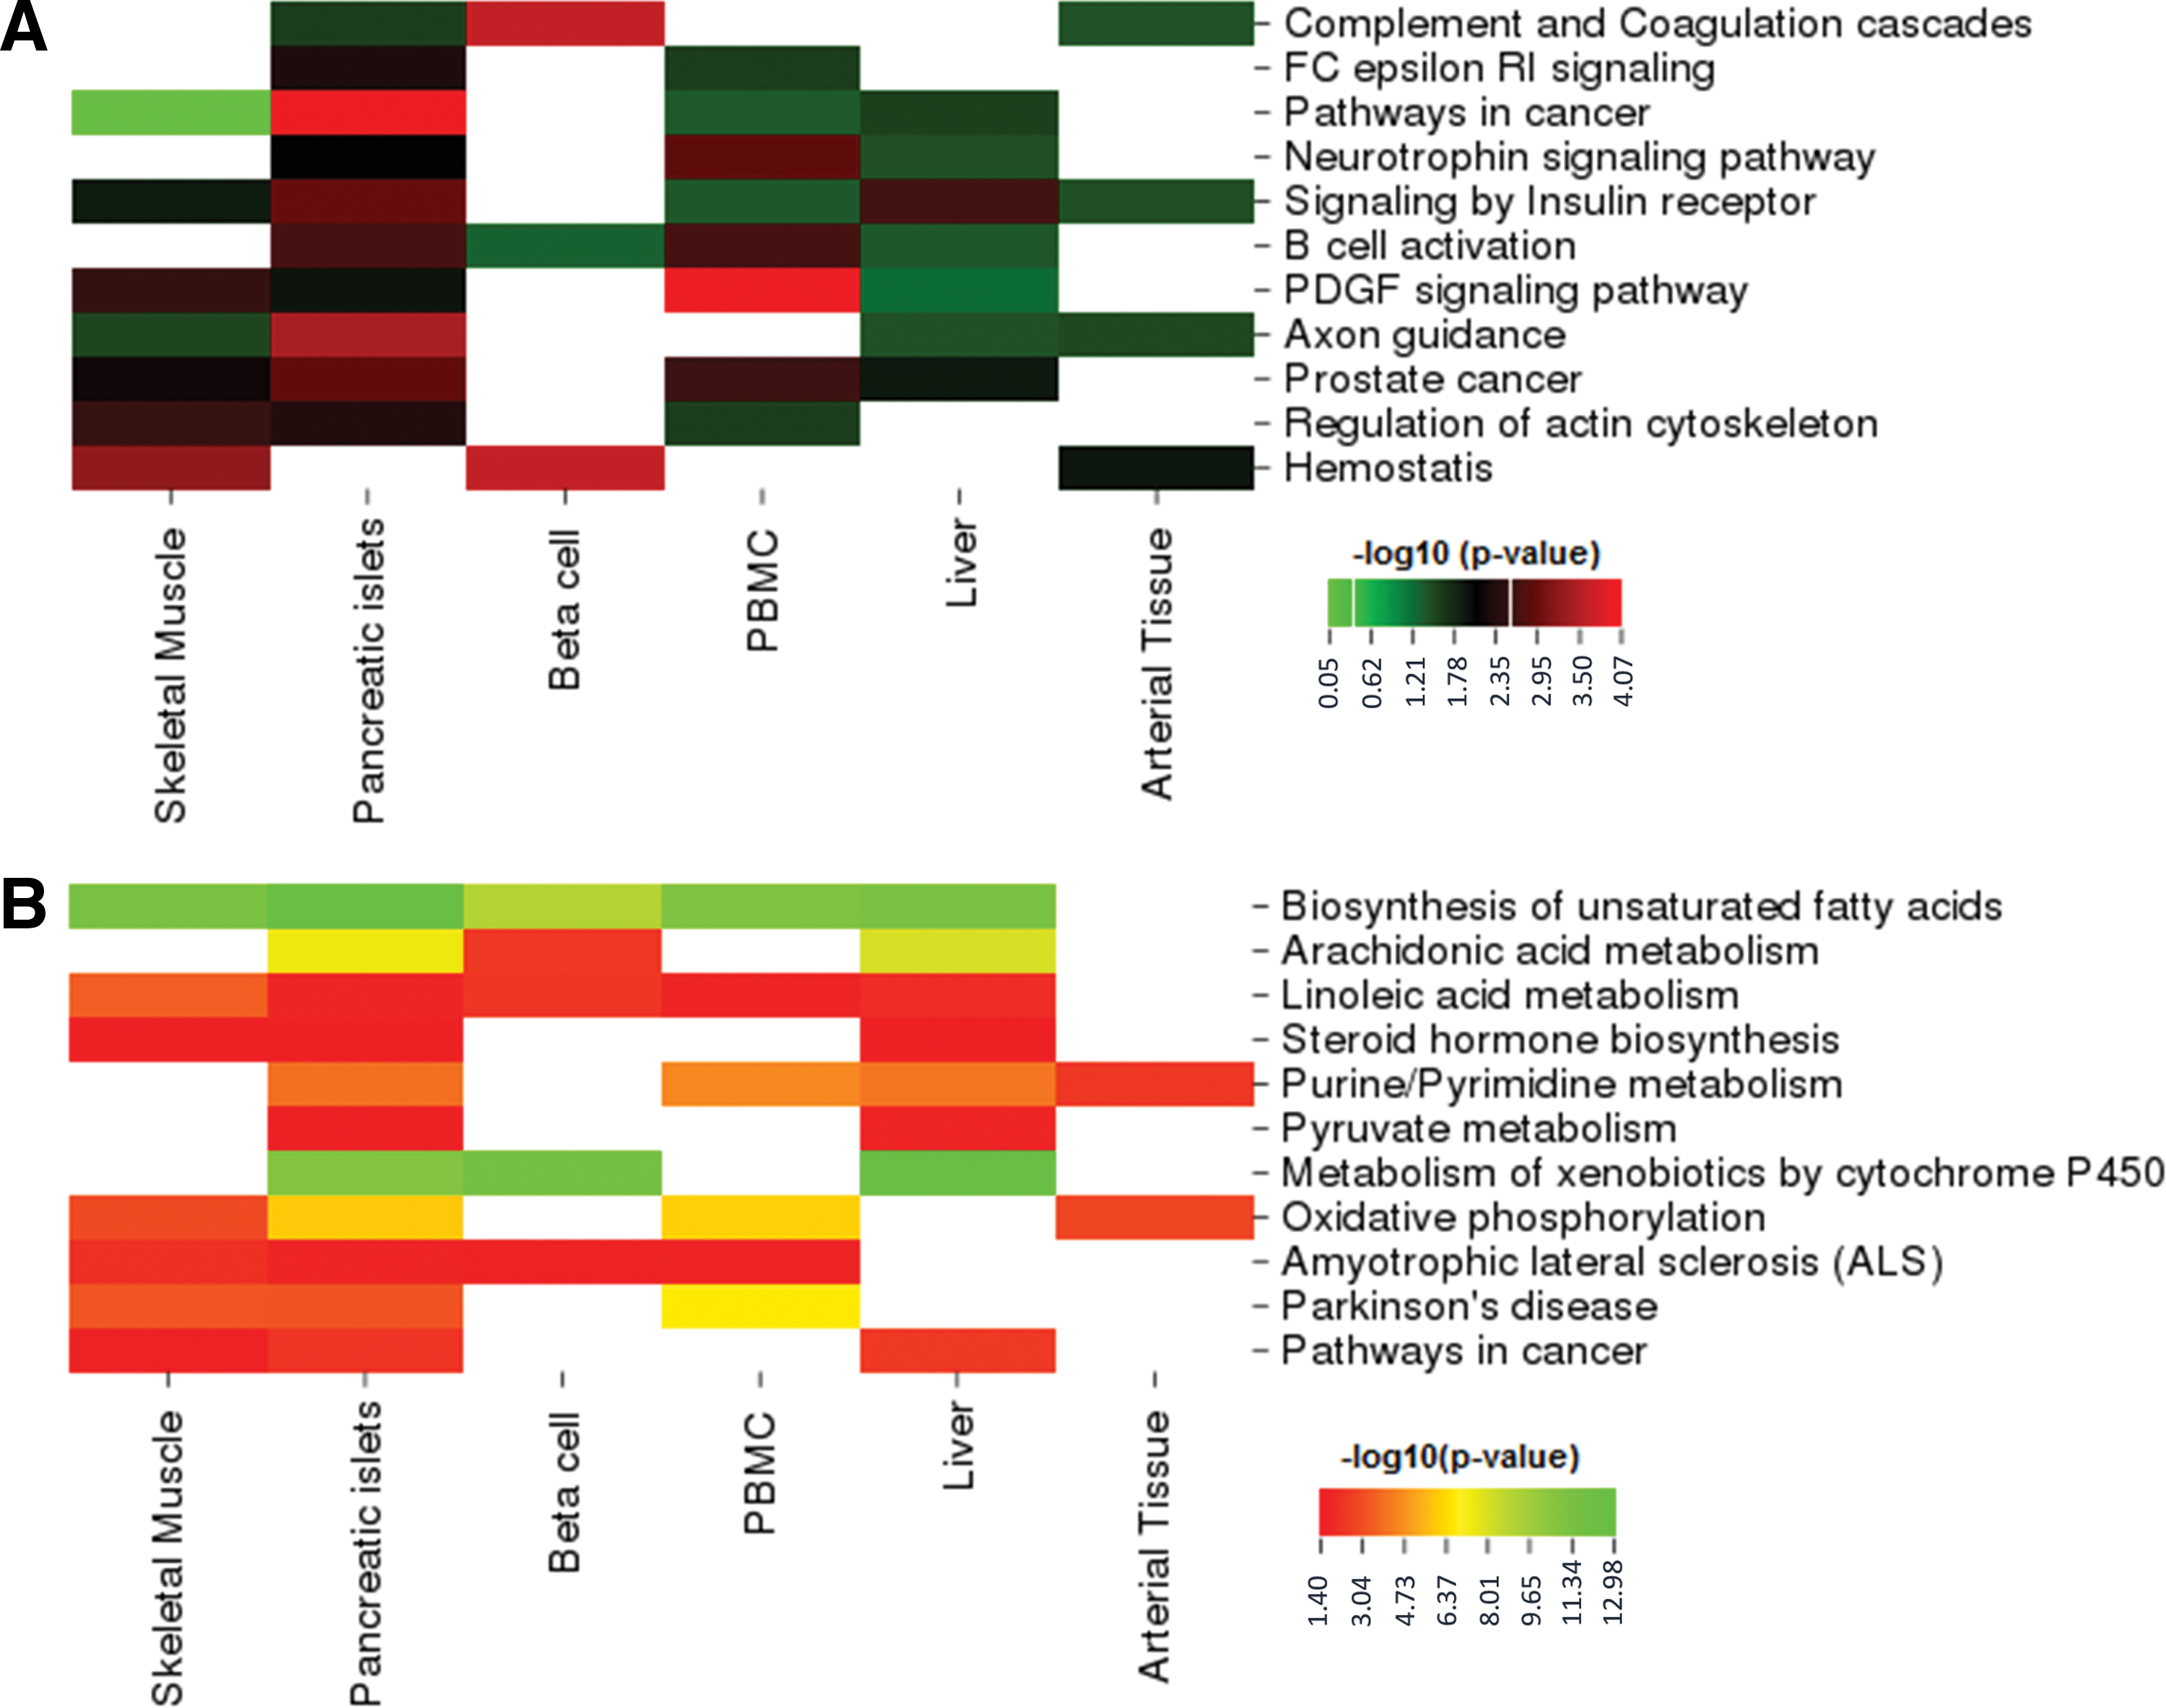
Functional enrichment analysis results based on
Protein–protein interaction (PPI) networks associated with T2D
After an overall evaluation of DEGs, active PPI subnetworks were reconstructed via proteins associated with DEGs and their physical interacting partners. Up/down-regulated interaction subnetworks of six different types of tissues were constructed. The largest downregulated subnetwork was (GSE25724–pancreatic islets) consisting of 12,697 binary interactions between 2268 proteins, and the largest upregulated interaction subnetwork (GSE25724–pancreatic islets) included 9612 interactions between 2793 proteins (Supplementary Table S3).
A set of hub proteins were obtained as the results of the topological analyses of reconstructed networks. Using a local-based metric (i.e., degree), and a global-based metric (i.e., betweenness centrality), both local and global features of nodes within the graphs were considered simultaneously to determine the hubs. Among upregulated hubs, EGR1 came into prominence in at least two tissues. Similarly, APC was the downregulated hub protein represented in at least two different tissues/cells. 1433Z, CALM, CSK21, PSA3, SMAD3, SRC, SUMO2, EGFR, and SUMO1 were the hub proteins observed in both downregulated and upregulated subnetworks of at least two different tissues/cells. Tissue specific other hub proteins were indicated in each tissue (Supplementary Tables S3 and S4).
Downregulated 42 hub proteins from eight different datasets classified into five groups: i) receptors (EGFR, ESR1, TNR6), (ii) transcriptional factors (TF65, PPARA), (iii) enzymes (1433T, 1433Z, CALM, CSK21, DDX6, KPCA, MK08, PRKN2, PSA3, RBP2, SRC, UB2D3, UBC9), (iv) signaling proteins (CAP2, DLG4, SH3K1, SMAD3, SQSTM, CUL4A, NCK1), and (v) repressors (EWS, U2AF2, P53). Moreover, there were also initiation factor (IF4E), microtubule protein (MAP1A), tumor suppressor (APC), neurotransmitter transporter (STX1A), nuclear protein (H2AX), ribonucleo protein (ROA1), calcium related binding proteins (PDC6I, CAC1A), component of the SCF-ubiquitin ligase complex (FBX25, SKP1, CUL1), RNA-binding protein (FUS), ubiquitin-like proteins (SUMO1, SUMO2) (Supplementary Table S4). PPARA, SMAD3, FUS, TF65, P53, ESR1, 1433T, CSK21, EWS, and SKP1 were highlighted as down regulated hub proteins in the transcriptional regulatory system (Supplementary Fig. S1).
Upregulated 43 hub proteins classified into five groups: (i) receptors (A4, EGFR, GCR, IL7RA, LRP1), (ii) transcriptional factors (CREB1, MYC, EGR1, BCL6), (iii) enzymes (1433Z, CBL, CSK21, FYN, MDM2, MK01, MK14, P85A, PSA3, PYRG1, SRC, TRAF6), (iv) signaling proteins (CALM, CTNB1, MOES, SMAD1, SMAD3, NCK1), and (v) repressor (NCOR1). Furthermore, there were also actin (ACTB), antigen (1C07), collagen (COL1A1), component of nucleosome (H4), cytoplasmic peripheral membrane protein (EZR1), developmental protein (DAB2), elongation factor (EF1A1), fibronectin (FINC), growth factor (MK), DNA repair regulator (PAF15), ubiquitin like proteins (SUMO1, SUMO2), and ribonucleoprotein (IMP4) (Supplementary Table S4). SMAD3, BCL6, SMAD1, EGR1, MYC, CREB1, CTNNB1, NR3C1, MDM2, CSNK2A and NCOR1 were the upregulated hub proteins in the transcriptional regulatory system (Supplementary Fig. S1).
Considering the pathway enrichment analyses around hub proteins, signaling pathways including WNT, MAPK, and cell cycle were highlighted in sets of downregulated hub proteins, while T cell receptor, VEGF, EGFR, NGF, PDGF, Fc epsilon RI, and immune system signaling pathways were enriched in upregulated hub proteins in T2D. On the other hand, hub sets included both down- and upregulated members of ErbB, neurotrophin, and GnRH signaling pathways. Furthermore, enrichment analyses also pinpointed specific disease pathways including upregulated prostate cancer, bladder cancer, thyroid cancer, small cell lung cancer, melanoma, endometrial cancer, and chronic myeloid leukemia pathways, as well as both down- and upregulated pancreatic cancer, colorectal cancer, glioma, and Parkinson`s disease pathways (Supplementary Table S5).
Metabolic signatures on different tissues
Distinct and common signatures of T2D were observed for different tissues as a result of reporter metabolites analyses (Supplementary Table S6). Glucose is the routine and mainly used metabolite to determine any insulin deficiency problem. In the present analyses, glucose was observed as a reporter metabolite in beta cells and pancreatic islets, while it was identified in different compartments such as extracellular and cytosolic in beta cells, lysosome, and endosplasmic reticulum in pancreatic islets. In PBMC, cytosolic fructose-1-6-bisphosphate and fructose-1-phosphate were also reported.
On the other hand, fibrinogen, prothrombin, plasminogen, and albumin were only chased as reporter metabolites in arterial tissue, while heparan sulfate precursor was identified in liver, PBMC, and skeletal muscle beside arterial tissue. These metabolites were all related to biological activities such as angiogenesis and blood coagulation.
Moreover, there were various reporter metabolites such as palmitoleic acid, arachidonate, and linoleic acid related to fatty acid biosynthesis with multiple tissue associations. Various amino acids including proline, asparagine, and aspartate as nonessential, and isoleucine, leucine, phenylalanine, threonine, tryptophan, and valine as essential were common only in skeletal muscle and arterial tissue. Although each dataset has its own specific reporter metabolites, activation-ppara reaction which stimulates nuclear receptor protein encoded by PPARA gene was found out as the only reporter common among all tissues (Supplementary Table S6).
Results of enrichment analysis based on reporter metabolites indicated T2D-related metabolic pathways such as biosynthesis of unsaturated fatty acid metabolism (particularly linoleic acid and arachidonic acid metabolism), steroid hormone biosynthesis, and also diseases such as various cancer types (lung, pancreatic, prostate, and colorectal cancers) and neurodegenerative diseases (Fig. 2B, Supplementary Table S7). This finding is interesting in light of the fact that biosynthesis of unsaturated fatty acids were effected in almost all tissues (except arterial tissue) of T2D patients.
T2D associations with psychiatric diseases such as schizophrenia and depression, as well as neurodegenerative diseases such as Parkinson's disease (PD), Huntington's diseases (HD), amyotrophic lateral sclerosis (ALS), and Alzheimer disease, were also pointed out in our analyses. In this study, T2D connectivity with various neurodegenerative diseases are concurred so as Parkinson's disease (PD) and amyotrophic lateral sclerosis (ALS) were prominent. Although other tissues have showed signatures related to PD and ALS, liver and arterial tissues have not been associated with these diseases.
Transcriptional regulatory modules associated with T2D
In the present study, some hub proteins were functioning as TFs or downstream effectors in transcriptional regulatory systems of beta cell, pancreatic islets, PBMC, skeletal muscle, and liver (Supplementary Fig. S1). Results showed that TFs belonged to beta cell, pancreatic islets and PBMC were both downregulated and upregulated. In beta cells, SMAD3, SKP1, and YWHAQ were downregulated and CTNNB1 and CSNK2A1 were upregulated. ESR1 and CSNK2A1 were downregulated, and MYC and SMAD3 were upregulated in pancreatic islets. RELA, FUS, and TP53 were downregulated, and EGR1, NCOR1, BCL6, NR3C1, CREB1, and SMAD1 were upregulated in PBMC. Moreover, there were downregulated TFs (PPARA and CSNK2A1) in liver and upregulated TF (MDM2) in skeletal muscle.
miRNA–target hub gene interaction networks of various tissue and cells in T2D were also reconstructed. miRNAs related more than three hub target genes were selected as mutual miRNA in T2D (Fig. 3). Interaction with eight target hub genes (EGFR, MYC, LRP1, BCL6, SMAD3, PPARA, DAB2, and STX1A) of miR-335 and six target hub genes (CUL4A, SMAD1, EGFR, ACTB, RRP12, and DAB2) of miR-16-5p were prominent at various tissues in T2D. All interactions of mutual miRNAs and their targeted hub genes were observed at pancreatic islet and/or beta cell modules.
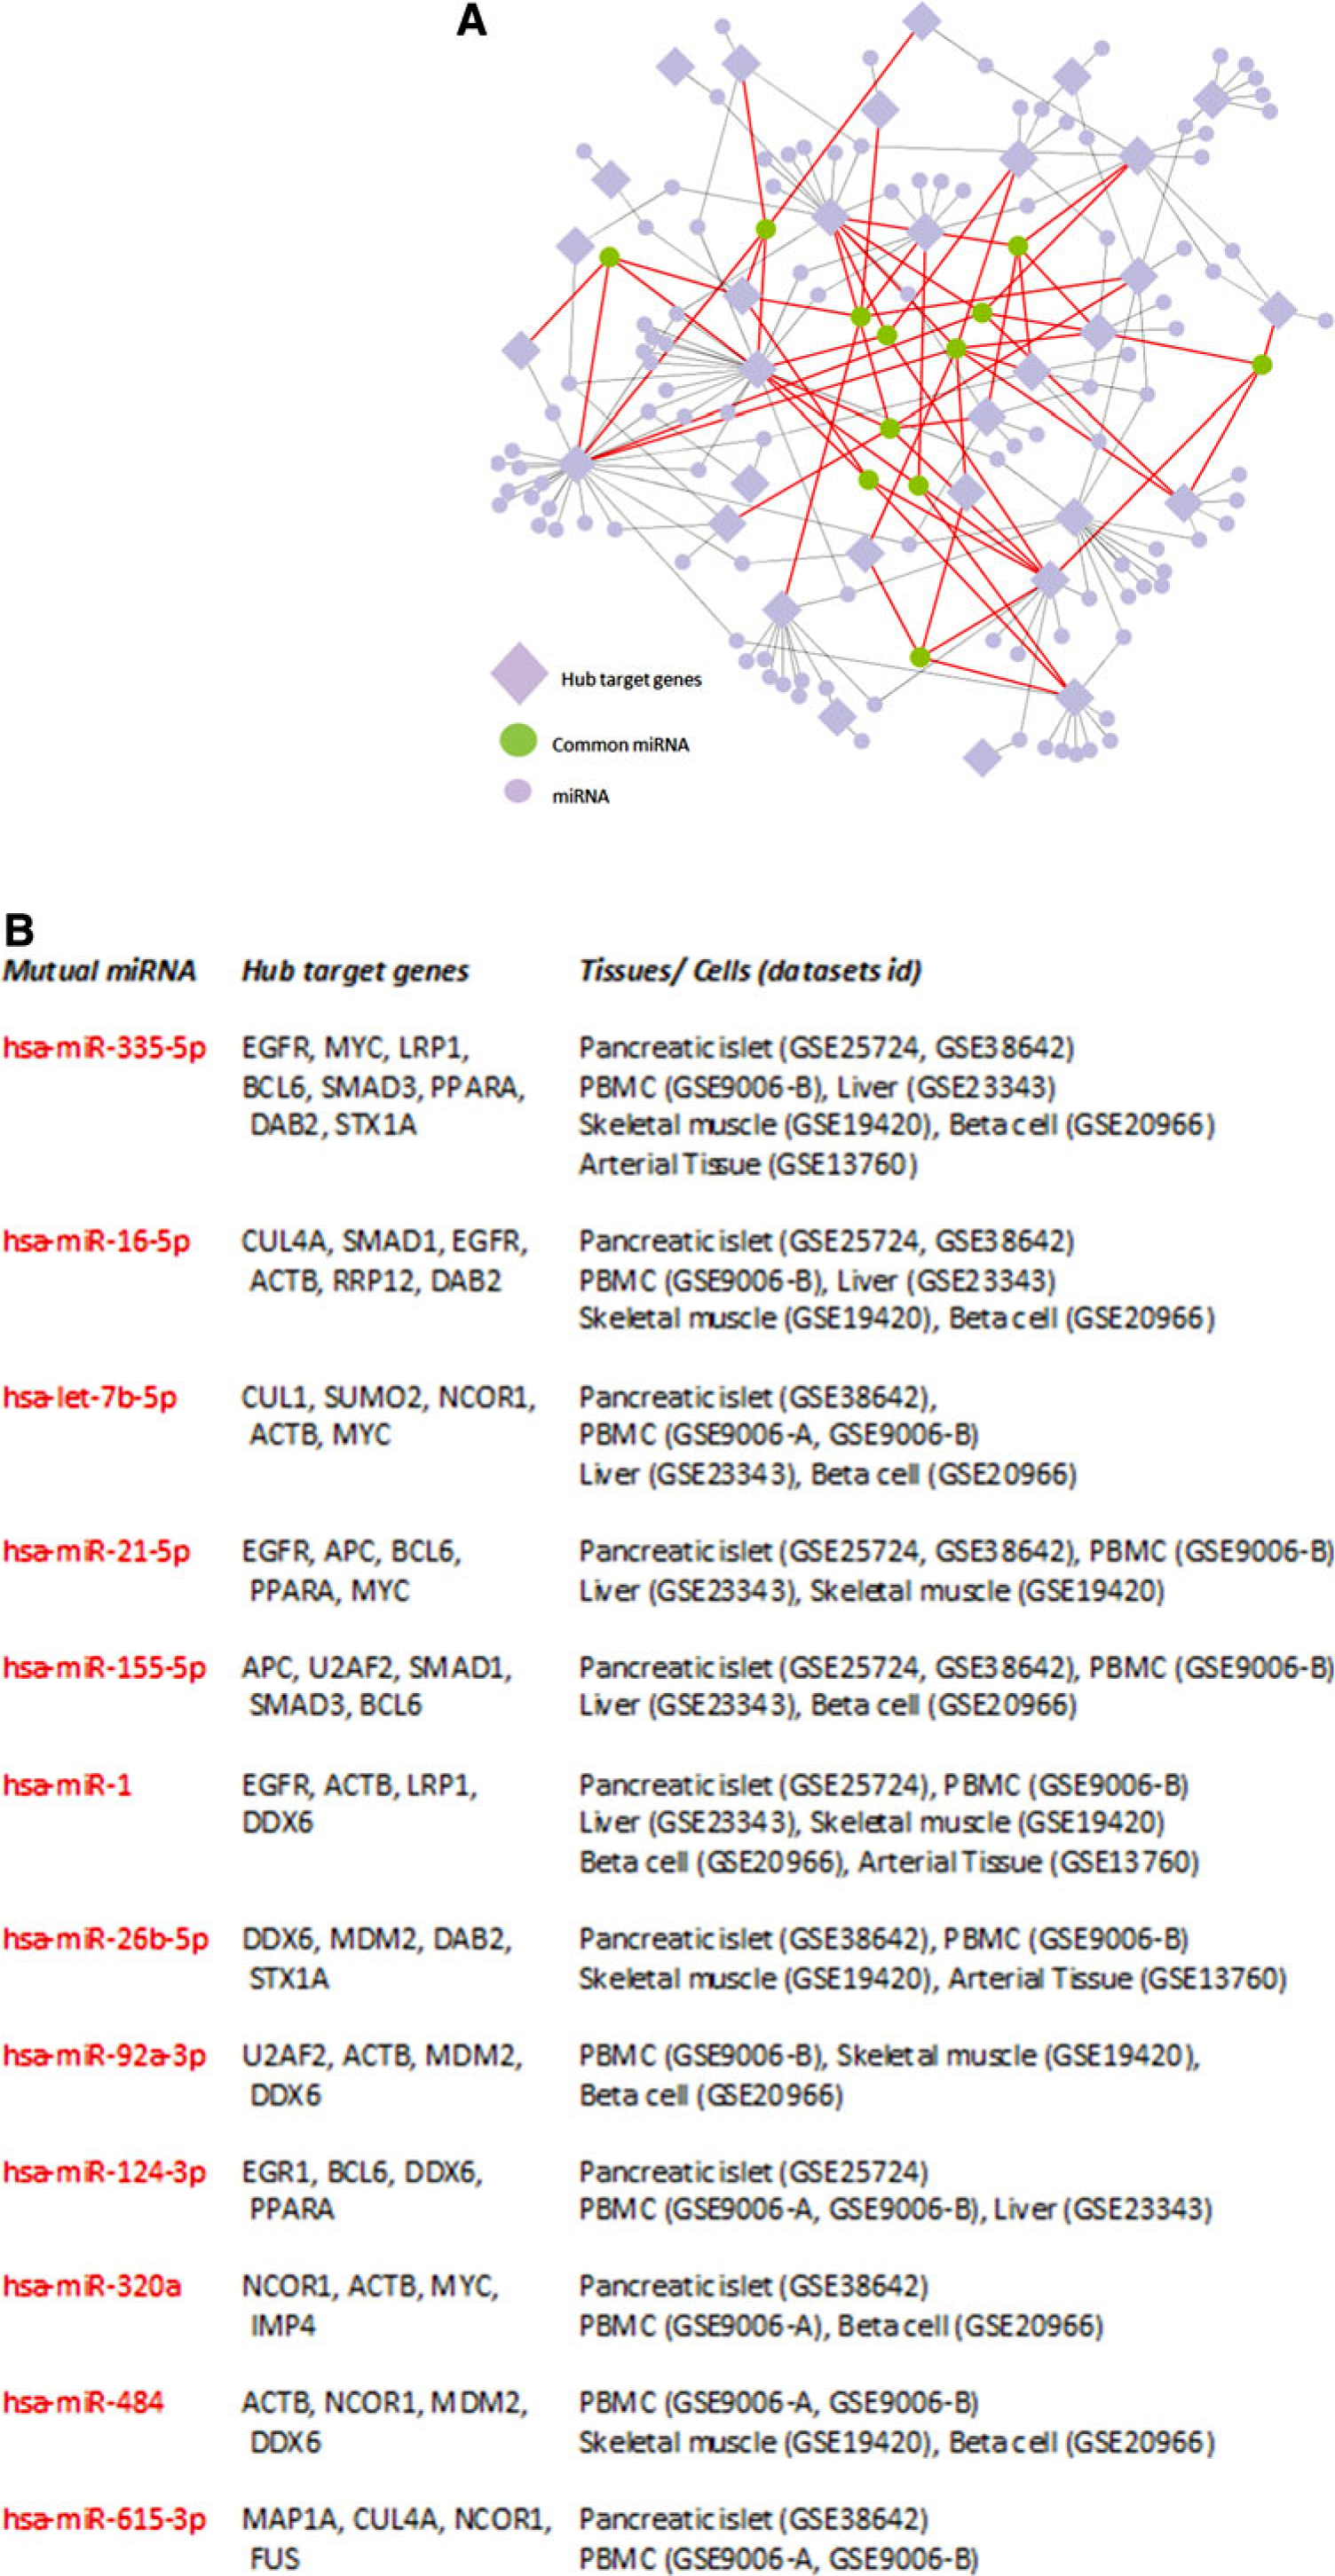
miRNA-targeted hub gene interaction network.
Discussion
Identification of mutual and tissue-specific DEGs, and reporter biomolecules (i.e., metabolites, proteins, and miRNAs) were explored across different tissues in T2D via integrative analysis of transcriptomics datasets with human biological networks in order to elucidate the genetic mechanism underlying T2D. The analyses indicated that genomic reprogramming depends on the type of tissue, whereas there were common signatures at genomic and metabolic levels. On the other hand, distinct signatures were observed for different tissues at metabolome level. Results has showed utmost importance concerning relations between T2D and cancer, blood coagulation, neurodegenerative diseases, and specific metabolic and signaling pathways.
Analyses of T2D datasets yielded a wide range of DEGs; however, the comparative analyses in terms of DEGs demonstrated that Mannosidase Alpha Class 1A Member 2 (MAN1A2) was the only common DEG among all tissue and cell types. Previous studies have pointed out that MAN1A2 is pursued by the peroxisome proliferator-activated receptor (PPAR-γ) in a novel anti-inflammatory mechanism in endothelial cells (Chacko et al., 2011) and assigned as a biomarker for diabetes as well as pancreatic disease (PD) (Santiago et al., 2013). Numerous DEGs were expressed in different tissues. Therefore, it was difficult to introduce distinct signatures of T2D on each tissue at genome level.
On the other hand, distinct signatures were observed for different tissues at metabolome level. Saccharides (fructose, glucose, mannose, and galactose) and glucosamine were significantly enriched metabolites in beta cells. Reporter metabolites in liver were mevalonate, thioredoxin, dolichyl-phosphate, chondroitin sulfate, and their derivatives. Aspartate was the common reporter metabolite in arterial tissue and skeletal muscle. Reporter metabolites specific for arterial tissue were choline and glutamate, whereas skeletal muscle was enriched for cholesterol, malate, L-carnitine, and several amino acids including aspargine, homoserine, and tyrosine. The acids, HEPE and HETE, and their derivatives, as well as prostaglandin, were specific metabolites for PBMC. Various coenzyme A derivatives were significantly enriched metabolites in pancreatic islets.
Topological analysis of reconstructed protein–protein interaction subnetworks for each tissue pointed out several hub proteins (Supplementary Table S4), which can be incorporated to future experimental studies, since they possess a significant potential for being candidate biomarkers or drug targets for T2D. Among those, two tumor suppressors (EGR1 and APC), five enzymes (1433Z, CALM, CSK21, PSA3, and SRC), three signaling proteins (SMAD3, SUMO1, and SUMO2), and epidermal growth factor receptor (EGFR) came into prominence in at least two different tissues/cells.
In the present study, the mutual and tissue-specific transcriptional regulatory modules (TF-gene) were also identified in T2D (Supplementary Fig. S1) and miRNA- gene interaction networks of various tissue and cells in T2D were reconstructed (Fig. 3). miR-335 and miR-16-5p came into prominence at various tissues in T2D. The roles of miR-335 in adipose tissue inflammation, and miR-335 in the process of obesity complications have been reported recently (Zhu et al., 2014). T2D may affect the adipokines process at various tissues and miR-335 is an adipogenesis-related miRNA, which is implicated in both fatty acid metabolism and lipogenesis, indicating an association between obesity and diabetes.
Clinical studies have indicated that the major targets of miR-16-5p were associated with insulin resistance and abnormal pregnancies, and miR-320a and miR-1 were reported as associated with angiogenesis, cardiac aritmogenic potential (Shan et al., 2010; Wang et al., 2009). Also miR-1 is upregulated by high glucose in cardiomyocytes, where it accelerates apoptosis (Shan et al., 2010).
The mutual miRNAs in various tissues related to T2D may be assigned to adipogenesis, muscle development, and apoptosis-related roles. miRNAs have already been shown to carry out important regulatory functions in the T2D, and therefore a study focusing on the miRNA changes in various tissue (pancreatic islet, beta cells, muscle, liver etc.) in response to adipogenesis, angiogenesis, apoptosis, and tumorogenesis is essential for a complete systemic understanding of T2D.
As a result of this study, we have found significant association between T2D and increased risk of cancer. In a 2010 report of American Diabetes Association and American Cancer Society, T2D was linked to an elevated risk for many different types of cancers such as colorectal, breast, endometrial, liver, pancreatic, and bladder, however there was less evidence for other types of cancers including kidney cancer, leukemia, and esophageal cancer (Giovannucci et al., 2010). Tsilidis and colleagues reported robust associations between T2D and the risk of breast, colorectal, intrahepatic cholangiocarcinoma, and endometrial cancer.
Here, the relation between T2D and cancer was explained by biological heterogeneity. In the present study, APC, EGFR, KPCA, MDM2, MK01, MK08, MYC, P53, TF65, TNR6, P85A, and SMAD3 were reported proteins associated with more than one cancer type. Except a few proteins, most of the other hub proteins related to cancer and T2D were pervasive in different cancer types. However, TRAF6 and FINC were distinctive for small cell lung cancer. CREB1 and CTNB1 were identified in prostate cancer and thyroid cancer, respectively. The molecular mechanisms guided this relationship that were encompassed by insulin resistance, hyperinsulinemia, hyperglycaemia, chronic inflammation, and dysregulations of sex hormones (Shi et al., 2014; Tsilidis et al., 2015).
Insulin interacts with insulin-like growth factor I to cause the direct and indirect growth of tumors. The higher insulin concentrations are common in the early stages of T2D due to insulin resistance and decrease over the time due to deprivation of islet cells and disrupted insulin secretion. Hence, the duration of diabetes can alter the links between T2D and cancer prevalence (Elena et al., 2013).
The other point of interest has become links between T2D and neurodegenerative diseases. A comparison between the enrichment analysis of reporter metabolites and DEGs revealed that neurodegenerative diseases may be more relevant to T2D at metabolite levels (Fig. 2B). The association of Parkinson's disease (PD) and ALS with T2D are prominent, as well as implications of associations with Alzhemier's disease and Huntington's disease. The motor symptoms of Parkinson's disease occur from death of dopamine-generating cells in the brain. Although T2D was connected with an increased risk of PD by epidemiological studies independent of other potential factors such as coffee or alcohol consumption (Hu et al., 2007), the biological mechanism of the association between T2D and PD is not discovered yet.
Dopamine, which was suggested as a regulator of the proliferation and apoptosis of rat pancreatic beta cells after glucose-stimulated insulin secretion, has been chased as a tissue-specific reporter metabolite in beta-cells in our study. Dopamine has several effects such as decreased insulin release, increased apoptosis, and decreased proliferation in pancreatic islets, which mean dopaminergic dysregulation might ultimately take part in the enhancement of glucose intolerance (Garcia Barrado et al., 2015). Any dysregulation in dopamine-generating cell groups may trigger problems in other tissues. There were seven down regulated DEGs (ATP5G2, CYC1, NDUFA5, NDUFB8, VDAC1, COX5A, and UBE2G1) common in PBMC and pancreatic islets, while PD associated DEGs in liver were reported as upregulated.
Alzheimer disease is characterized by progressive loss of neurons and protein misfolding, resulting in the accumulation of tau protein and extracellular amyloid beta peptides containing senile plaques. T2D and AD have similar pathological mechanisms resulting from misfolded proteins, insulin impairment, and abnormal glucose and fatty acid metabolism. Systematic analysis of diabetes and glucose metabolism-related proteins also aid in the rehabilitation of Alzheimer's patients (Yang et al., 2013).
Furthermore, PPAR-γ co-activators and anti-diabetic drugs targeting PPARs are neuroprotective in PD (Santiago et al., 2013). PPARa is reported as a downregulated hub protein and “activation PPARa” is the only common reporter reaction in all investigated tissues of this study. PPARa is a transcription factor that regulates lipid metabolism in the liver. It has utmost importance of impacting fatty acid uptake and intracellular binding, mitochondrial β-oxidation and peroxisomal fatty acid oxidation, triglyceride turnover, and gluconeogenesis. As pointed out in our research, neurodegenerative diseases and T2D have mutual DEGs and pathways that may assist in treatment response to drugs of neurodegenerative diseases as well as the control of dysglycemia.
T2D has been reported to reduce insulin action and insulin resistance of glucose transport in skeletal muscle and adipose tissue (Del Guerra et al., 2005), and low glucose levels are associated with changes in coagulation factor levels and clot structure or lysis (Alzahrani and Ajjan, 2010). Clotting of the blood (also known as coagulation or hemostasis) is an important process that protects the body against bleeding, preventing excessive blood loss, and thus protecting the living being from a certain death. It involves plasma, platelets, tissue factor-bearing cells, and vascular components (Erem et al., 2005). Significant changes in clotting factors are induced by diabetes, causing an increase in thrombosis risk as well. This leads to clot formation and resistance to fibrinolysis (Alzahrani and Ajjan, 2010).
The key player of innate immunity is the complement cascade, and the key player of hemostasis is the coagulation cascade in case of injury and inflammation (Oikonomopoulou and Lambris, 2012). Erem and co-workers (2005) stated that patients with T2D had an increased risk of vascular disease resulting from the activation of coagulation with decreasing fibrinolytic activity. Yürekli and colleagues (2006) reported extrinsic pathway of the coagulation cascade that was activated slightly with a contributing reduction from the intrinsic pathway in T2D. Fujita (2013) suggested a possible role of complement activation in the development of renal endothelial injury in T2D patients.
The functional enrichment analysis results indicated that the coagulation and complement cascades have been activated in pancreatic islets conforming to previous studies. Coagulation factors such as F2, F5, F7, F12, F13B of the coagulation cascade, complement factors B (BF) and H (BG), complement components C2, C4A, C4B, C8G, C9, and their receptors CR1 and CR2 of the complement cascade, and serpin peptidase inhibitors SERPINC1, SERPING1, and SERPINF2 were all upregulated in this tissue.
Some of the complement and coagulation cascade members such as serpin peptidase inhibitors SERPINA1, SERPINA5, and SERPINGI, complement components C2, C3, and C6, coagulation factors F10 and F12, and fibrinogen alpha, beta, and gamma chain (FGA, FGB, and FGG) were upregulated in beta cells as well. These results were in agreement with the current understanding that T2D is caused by dysfunctioning of beta cells in pancreatic islets. Additionally there are also several members of these cascades upregulated in liver and PBMC in T2D.
Moreover, other significant metabolic or signaling pathways could be mentioned for different tissues. For instance, oxidative phosphorylation in skeletal muscle and arterial tissue stand out substantially in addition to PBMC and pancreatic islets in this study, while a set of genes associated with oxidative phosphorylation have previously been shown to be downregulated in human diabetic muscle tissue (Mootha et al., 2003). Fc epsilon RI signaling pathway, B cell activation, signaling by insulin receptor, and neurotrophin signaling pathway were distinguished for T2D in our analysis in line with a recent study (Zhang et al., 2015).
Conclusion
Tissue-specific T2D signatures were screened during the current study from different biological levels such as genes, proteins, reporter metabolites, and miRNAs. There was no opportunity to express specific reporters in each tissue because the number of gene or metabolites were abounding. However we chased some common reporters in each tissue.
MAN1A2 as a gene and miR-335 as a miRNA was shared in six different cells and tissue levels. While common signatures were observed, distinct responses in each tissue were also represented. Distinct signatures were observed at the metabolome level, and different groups of metabolites were significantly enriched in each tissue. Overall this study has resulted in discoveries of the utmost importance concerning relations between T2D and cancer, blood coagulation, neurodegenerative diseases, and specific metabolic pathways, respectively.
Results have also showed that the relationship between cancer and T2D were based on some common proteins independent of the cancer type. Biosynthesis of unsaturated fatty acids and other fatty acid metabolism-related pathways were found highly significant in each tissue except arterial tissue. As a conclusion, the methodology employed here from a network point of view provided a holistic insight into the signaling, regulatory, and metabolic state of T2D across different tissues. Current in silico analysis of T2D across different tissues can be assumed as the first step and the results of the present study may lead to various T2D candidate markers on gene, protein, miRNA, or metabolite level for further experimental studies.
Footnotes

References
Supplementary Material
Please find the following supplemental material available below.
For Open Access articles published under a Creative Commons License, all supplemental material carries the same license as the article it is associated with.
For non-Open Access articles published, all supplemental material carries a non-exclusive license, and permission requests for re-use of supplemental material or any part of supplemental material shall be sent directly to the copyright owner as specified in the copyright notice associated with the article.
