
Abstract
Abstract
Tissue lipidomics is one of the latest omics approaches for biomarker discovery in pharmacology, pathology, and the life sciences at large. In this context, matrix-assisted laser desorption/ionization (MALDI) mass spectrometry imaging (MSI) is the most versatile tool to map compounds within tissue sections. However, ion suppression events occurring during MALDI MSI analyses make it impossible to use this method for quantitative investigations without additional validation steps. This is especially true for lipidomics, since different lipid classes are responsible for important ion suppression events. We propose here an improved lipidomics method to assess local ion suppression of phospatidylcholines in tissues. Serial tissue sections were spiked with different amounts of PC(16:0 d31/18:1) using a nebulization device. Settings for standard nebulization were strictly controlled for a detection similar to when using spiked tissue homogenates. The sections were simultaneously analyzed by MALDI MSI using a Fourier transform ion cyclotron resonance analyzer. Such a spray-based approach allows taking into account the biochemical heterogeneity of the tissue for the detection of PC(16:0 d31/18:1). Thus, here we present the perspective to use this method for quantification purposes. The linear regression lines are considered as calibration curves and we calculate PC(16:0/18:1) quantification values for different ROIs. Although those values need to be validated by a using a different independent approach, the workflow offers an insight into new quantitative mass spectrometry imaging (q-MSI) methods. This approach of ion suppression monitoring of phosphocholines in tissues may be highly interesting for a large range of applications in MALDI MSI, particularly for pathology using translational science workflows.
Introduction
S
However, the reliability of the method for the “quantitative” mapping of some compound classes can be discussed since MALDI applied to complex mixtures of compounds greatly suffers from ion suppression effects (Jadoul et al., 2014b; Stoeckli et al., 2007). The ion intensity recorded within tissue sections depends on different factors including the complex environment of the analyzed tissue.
In the last few years, important efforts have been made to design methods that take into account the effect of a biological matrix on the ionization of specific compounds, especially for quantification investigations. The use of standards to create calibration curves for quantitative mass spectrometry imaging (q-MSI) research (Landgraf et al., 2009; Pirman et al., 2013; Pirman and Yost, 2011) appeared. For label-free q-MSI, the notion of tissue extinction coefficient (TEC) was proposed to highlight signal extinction of a specific compound in the different organs of a whole animal body (Hamm et al., 2012). In this investigation, spraying approaches were used for the deposition of the compound of interest through the surface of the whole animal section.
Thereafter, particular attention has been devoted to the introduction mode of the standards in tissues since the external deposition of a solution on tissue sections may indeed generate great artifacts for q-MSI. The detection of the standard could be biased by the fact that it is not inherent to the tissue. Thus, approaches relying on the use of spiked tissue homogenates were proposed to create calibration curves for the quantification of drugs in tissue sections (Groseclose and Castellino, 2013; Takai et al., 2014). In those approaches, known amounts of a standard are directly included into tissue molds. They do more properly mimic the context of a tissue section for the extraction, desorption, and ionization events of a given compound initially incorporated in a complex sample.
Our team has recently developed an approach based on spiked tissue homogenates to quantify a lipid PC(16:0/18:1) in mouse brain sections (Jadoul et al., 2015). Lipids bear essential biological functions such as cell signaling, cell membrane constitution, and energy storage. Alterations in their metabolism can provoke several pathological afflictions such as diabetes (Paradisi et al., 2010), cancer (Santos and Schulze, 2012), and neurodegerative afflictions such as Alzheimer disease (Frisardi et al., 2011; Giannopoulos et al., 2014). For several years it has been suggested that phospholipid level changes may be associated with the evolution of Alzheimer disease (Kosicek and Hecimovic, 2013).
MSI rose as the most interesting approach for in situ mapping of lipids in many fields (Arafah et al., 2014; Berry et al., 2014; Dyer et al., 2014; Gode and Volmer, 2013; Kawashima et al., 2013a, b; Matsumoto et al., 2011; Wang et al., 2014). However, known artifacts due to ion suppression have been poorly described (Jadoul et al., 2014b).
In this study, we aimed to monitor the ion suppression effects of a phosphatidylcholine during MSI analyses. We incorporated a deuterated lipid standard [PC(16:0 d31/18:1)] at different concentrations in brain homogenates. Sections of the spiked tissue homogenates were simultaneously prepared and analyzed by MALDI MSI using a Fourier transform ion cyclotron resonance (FT-ICR) analyzer with high mass resolution (Cimino et al., 2013; Sparvero et al., 2012). We created calibration curves from the signal intensity of the standard ionic species ([M+H]+, [M+Na]+, [M+K]+) and used those to extract quantitative data for endogenous PC.
Although tissue homogenate methods closely mimic the influence of the biochemical environment on the analyte signal, it is a tedious and complex procedure that requires large amounts of tissues to prepare the spiked homogenates. Also, as this technique relies on the use of tissue homogenates, the linear regression lines of the standard intensities reflect the global ion suppression from the whole tissue. Therefore, it does not allow to assess the local ion suppression events that differentially occur in the ROIs.
We propose here an improved method to evaluate local ion suppression of PC(16:0/18:1) in different tissue ROIs. Accurate amounts of PC(16:0 d31/18:1) using a capillary nebulization device were deposited on serial tissue sections. In order to minimize the impact of the spray during the deposition of the standard, important settings were optimized. We used spiked tissue homogenates in order to ensure that the detection of the sprayed standard is the same as when it would be incorporated into the tissue homogenates.
Moreover, we accurately controlled the actual amount of PC sprayed on the tissue by considering the surface surrounding the tissue (which is also sprayed with the standard by the nebulization device). Next, the tissue sections sprayed with the standard were analyzed and used to create linear regression lines of the different PC(16:0 d31/18:1) ionic forms recorded ([M+H]+, [M+Na]+, [M+K]+). A dedicated software was used for the creation of normalized images, taking into account the observed ion supression effects. In addition, manual data treatments were also carried out for validation purposes.
The use of spraying methods for the deposition of standards on the tissue sections represents an original way to address the issue of differential ion suppression events in regions of interest of a single tissue section. Finally, we offer new insights into the quantitative values that can be obtained from our experiments using this spray-based method. The quantitative approach of our work also offers an alternative to other known methods such as LC-MS for in-situ quantification of compounds.
Material and Methods
Chemicals
Methanol (MeOH, HPLC grade) and acetonitrile (ACN) were purchased from Biosolve (Valkenswaard, Netherlands). Ethanol (EtOH, absolute) was purchased from Thermo Fisher Scientific (Waltham, MA, USA)). Eosin Y and hematoxylin solution (modified according to Gill III) were acquired from Merck (Darmstadt, Germany). 1,5-Diaminonapthalene (1,5-DAN, purity 97%), chloroform (CHCl3, purity ≥99.9%), 2,5-dihydroxybenzoic acid (2,5-DHB), and trifluoroacetic acid (TFA) were purchased from Sigma-Aldrich (St. Louis, MO, USA).
Lipid standard
PC(16:0 d31/18:1) (1-palmitoyl-d31-2-oleoyl-sn-glycero-3-phosphocholine) was acquired from Avanti Polar Lipids Inc. (Alabaster, USA) and used without further purification. We prepared a stock solution with a concentration of 45.46 mg/mL using a MeOH/CHCl3 mixture (50/50 v/v). Additional standard solutions were prepared using a MeOH/CHCl3 mixture (50/50 v/v) with concentrations of: i) 0.001, 0.002, 0.005, 0.011, 0.025, 0.044, and 0.083 mg/mL for the quantification of PC on brain sections, and ii) 0.003, 0.008, 0.016, 0.034, 0.064, 0.272, and 0.684 mg/mL for the quantification of PC on kidney sections.
Tissue samples
The Central Animal Housing of the University of Liège provided BALB/c mice. Pig brains of controlled origin were supplied by a slaughterhouse. Tissues were collected before being snap frozen by immersion in pre-cooled isopentane at −50°C. They were then stored at −80°C. All subsequent sample manipulations were done using dry ice. Experiments were conducted in compliance with the ethics commission for animals of the University of Liège.
Tissue homogenates
Tissues were removed from the freezer and placed at −4°C during 1 hour. Mice brains and kidneys were placed in 2 mL tubes filled with ceramic beads before being homogenized using a MagNA Lyser instrument (4500 g for 30 sec; Roche, Basel, Switzerland). Pig brains were homogenized using a Potter-Elvehjem tissue grinder A 966 driven by a rotor (until complete homogenization; Thomas Scientific, Swedesboro, USA). Homogenates were then collected by pipetting, using a 100 μL pipette, and transferred in micro-tubes of 0.6 mL (Axygen, Tewksbury, USA). In order to facilitate the collection, the conical extremity of the pipette tips were cut off. The micro-tubes containing the homogenates were immersed in pre-cooled isopentane at −50°C. All these handlings were conducted in a cold room at −4°C. Finally, the homogenates were stored at −80°C.
Incorporation of PC(16:0 d31/18:1) in tissue homogenates
100 μL of the standard solution (prepared at various concentrations) was transferred into the 0.6 mL micro-tubes containing the tissue homogenates. A Vortex-Genie 2 instrument (USA Scientific Inc., Ocala, USA) and an Intelli-Mixer instrument (F64 at 99 rpm; ELMI Ltd., Riga, Latvia) were used to incorporate the standard solutions into the tissue homogenates. The micro-tubes containing the homogenates were immersed in pre-cooled isopentane at −50°C. Handlings were conducted in a cold room at −4°C.
Tissue samples sectioning
The micro-tubes containing the homogenates were taken from the freezer. The conical extremities of the micro-tubes were cut off. To extract the homogenates from the micro-tubes, tweezers were used and all these handlings were done using dry ice.
An optimal cutting temperature compound (Thermo Scientific) was used to mount the tissue samples onto a sample holder and a cryostat Thermo (Thermo Scientific) was used to cut them into 10 μm thick sections. When the intact brain and kidney were cut, coronal and sagittal sections were prepared, respectively. The temperatures of the sample holder and the razor blade were of i) −45°C and −35°C for the spiked tissue homogenates, ii) of −12°C and −20°C for the brain samples, and iii) −15°C and −25°C for the kidney samples. All the sections were thaw-mounted onto indium tin oxide (ITO) coated glass slides (Bruker Daltonics, Bremen, Germany) that were placed in a vacuum desiccator for about 1 hour in order to dry. Hematoxylin and eosin (H&E) staining was conducted on serial tissue sections.
Deposition of PC(16:0 d31/18:1) on the surfaces of tissue sections
The method for PC standards deposition is described in Supplementary Data (supplementary material is available online at www.liebertpub.com/omi).
Tissue samples coating
1,5-DAN matrix was also deposited using the SunCollect system and consists of 5 mg/mL DAN in ACN/TFA 0.2% (70/30, v/v). Deposition settings were the following: needle speed 5, spray head height of 11 mm, 50 deposition cycles, solution flow rate passing gradually from 0.5 to 8 μL/min.
Tissue staining
Tissue sections were stained using hematoxylin and eosin stain (H&E). They were successively immersed in 100% EtOH (8 sec), in 90% EtOH (8 sec), in 70% EtOH (8 sec), and in distilled water (4 sec). They were then immersed in a hematoxylin Gill III solution during 2 min. Sections were washed using HCl 0,1% (2 sec) and running water (3 min). They were then stained by immersion in an eosin solution (1 min) before being washed using distilled water (4 sec). Finally, the sections were successively immersed in 70% EtOH (4 sec), in 90% EtOH (4 sec), in 100% EtOH (4 sec), and in two xylol baths (10 min).
An IX81 inverted microscope (Olympus, Tokyo, Japan) was used to conduct microscopic examinations. The cellSens 1.9 software was used to control the microscope and to measure the surface of regions defined on the tissue sections. For histological comparison, we used a reference atlas provided by the Allen Institute for Brain Science (Allen Brain Atlas: data portal, http://www.brain-map.org/).
MALDI mass spectrometry imaging analysis
A SolariX FTMS 9.4 T mass spectrometer (Bruker Daltonics, Bremen, Germany) was used to conduct MALDI MSI analyses. Mass spectra were recorded at each position in positive ion mode. Acquisition settings were the following: laser frequency of 1 kHz, 2000 laser shots, mass range from m/z 100 to 1500, 20% laser power, and 165 μm lateral resolution was set for imaging analyses. The spectra were acquired in broadband mode. In order to tune the settings, we used a sample that contained four lipid standards: PC(16:0/14:0), PC(18:0/18:1), PE(16:0/18:1), and PE(18:0/18:1) (Avanti Polar Lipids, Inc., Alabaster, AL, USA). This sample was also used to calibrate the instrument considering the different ionic forms detected (protonated and salt adduct species). SolariX Control 1.5.0 and FlexImaging 3.0 softwares (Bruker Daltonics, Bremen, Germany) were used to control the instrument and to set-up the imaging parameters, respectively. The latter was also used to visualize molecular images using a 0.005-Da mass filter.
Data treatment
Details about the calculation of the quantitative data will be further described in the text. For the so-called “manual measurements,” mean spectra intensity values obtained from ROIs selected in FlexImaging were reported in an Excel file (Microsoft, Redmond, WA, USA) from which calibration curves are calculated and hence, the quantity of the compounds of interest.
The software Quantinetix 1.7 (Imabiotech, Lille, France) was used to perform some further calculations. This tool was especially used in the final part of this work: i) to control PC(16:0/18:1) quantification in brain and kidney sections, and ii) to normalize PC(16:0/18:1) molecular images by PC(16:0 d31/18:1) signals. We called the quantification based on this software “automated measurements.”
Results
Deposition of PC(16:0 d31/18:1) on tissue sections using the spraying device
For homogeneity issues, a pneumatic atomization approach was used for the deposition of both the standard and the matrix. Detailed explainations are provided in Supplementary data. The spraying process using the selected device is also illustrated (Supplementary Fig. S1).
Determination of “spraying effects”
Prior to the deposition of PC(16:0 d31/18:1) for the evaluation of ion suppression effects due to the tissue environment on PC(16:0/18:1), we had to take into account important issues related to the external incorporation of a standard compound into tissue samples. It was mandatory to prove that using spraying methods for the deposition of standard compounds in ion suppression monitoring is possible without creating artifacts. The sprayed standard may “stay” at the surface of the tissue or migrate through the thickness of the section, depending on the volume of solvent used. High solvent volumes may also cause the extraction from or the “burying” in the tissue section of the endogenous compound itself.
In order to obtain some insight into the phenomenon of extraction/burying caused by solvent spraying, we used brain tissue homogenates spiked with PC(16:0 d31/18:1) (Jadoul et al., 2014a). Therefore, three sections of a blank brain homogenate and six sections of a brain homogenate spiked with PC(16:0 d31/18:1) were thaw-mounted on a single ITO-coated glass slide. A MeOH/CHCl3 50/50 mixture was deposited on three spiked homogenate sections with the following spray parameters: needle speed 5, solution flow rate 20 μL/min, 100 deposition cycles, and spray head height 11 mm. 1,5-DAN matrix was deposited on the sample surface before starting the MALDI MSI analysis. The monoisotopic peaks of the different PC(16:0 d31/18:1) and PC(16:0/18:1) ionic forms ([M + H+], [M+Na+], [M + K+]) were taken into account for data treatment.
As illustrated in Figure 1, the signal intensities of the different PC(16:0/18:1) and PC(16:0 d31/18:1), their ionic species ([M + H+], [M+Na+], [M + K+]) were lower when solvent was added on spiked homogenate sections (Fig. 1B) compared to blank homogenates (Fig. 1A) and spiked homogenate section without solvent addition (Fig. 1C). This indicates that the deposition of the solvent mixture has an “extinction effect” rather than an “extraction effect” on both PC(16:0 d31/18:1) and PC(16:0/18:1) signals.
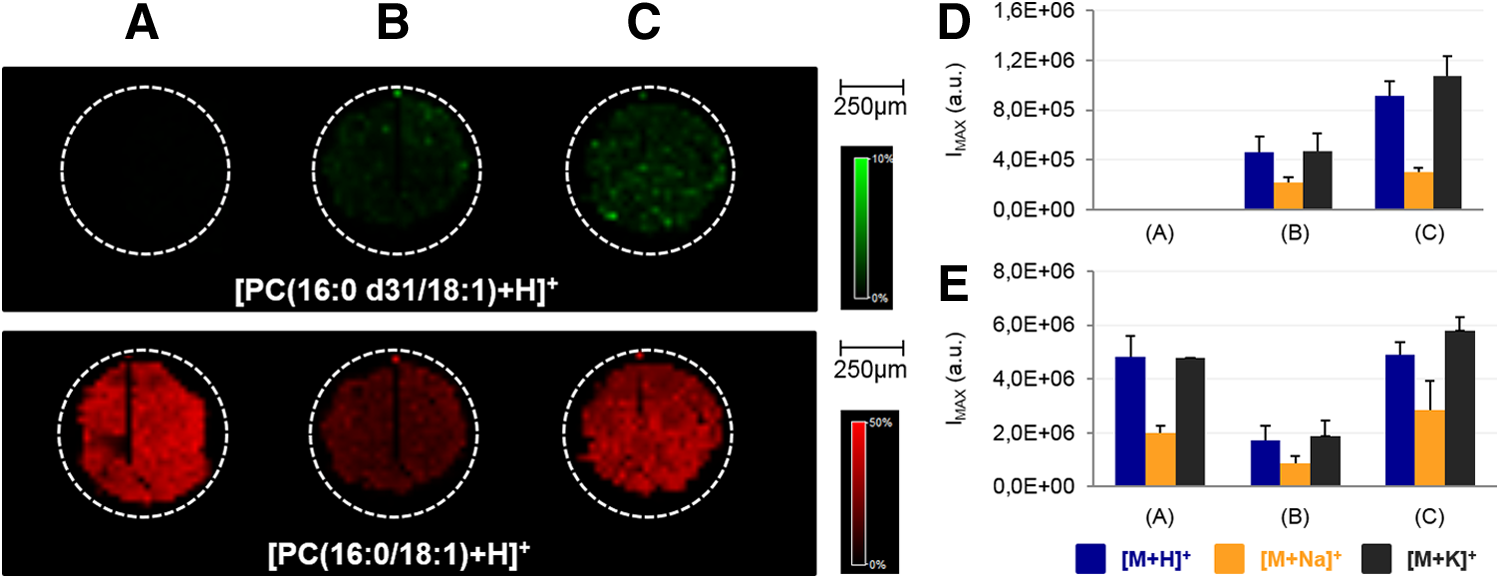
Analysis by MALDI MSI of sections originating from
Considering this, we decided to use very low flow rates to deposit standard solutions on tissue sections in order to limit the solvent effect. This required the use of higher PC(16:0 d31/18:1) concentrations to compensate for the additional dead volumes sprayed between the different cycles (see Material and Methods, Supplementary material). However, when we sprayed more concentrated solutions, the capillary tended to block. PC(16:0 d31/18:1) was therefore applied on a tissue homogenate section by 3 μL/min in 100 cycles (Fig. 2C), which was the minimum flow rate without blocking the spray head.

Analysis by MALDI MSI of sections originating from
Four additional conditions were tested to evaluate the reliability of the method. A blank homogenate (Fig. 2A) and a spiked homogenate (Fig. 2B) were used to control the absence of contamination of the standard in the blank homogenate and signal intensities without solvent addition. Sections of blank homogenate (Fig. 2D) and spiked homogenates (Fig. 2E) sprayed with only solvent were analyzed in order to determine the specific solvent effect when using low flow rates. However, we could still observe (see Fig. 2C–E) a slight increase in the signal of the endogenous compound, demonstrating that extraction events may appear.
Nevertheless, the signal of the deuterated compound remained similar when incorporated in the homogenate (Fig. 2B), sprayed on the tissue section (Fig. 2C), or when solvent was sprayed on a spiked homogenate (Fig. 2D). The intensities of PC(16:0 d31/18:1) were sufficiently similar. So it could be considered that the PC(16:0 d31/18:1) sprayed on the sample surface was detected just as if it would directly be incorporated in the homogenate sample. The solvent had almost no effect on the standard detection in this set of experiments.
Using low flowrates, the solvent was probably almost completely evaporated when the standard reached the tissue section surface, thus it did not influence the signals. Consequently, this “dry” deposition method was used to spike tissues in further quantitative experiments. As the signals of the endogenous compounds appeared to be slightly higher when solvent was added on the tissue section, control tissue sections were preferentially used for the evaluation of ion suppression effects in tissue sections.
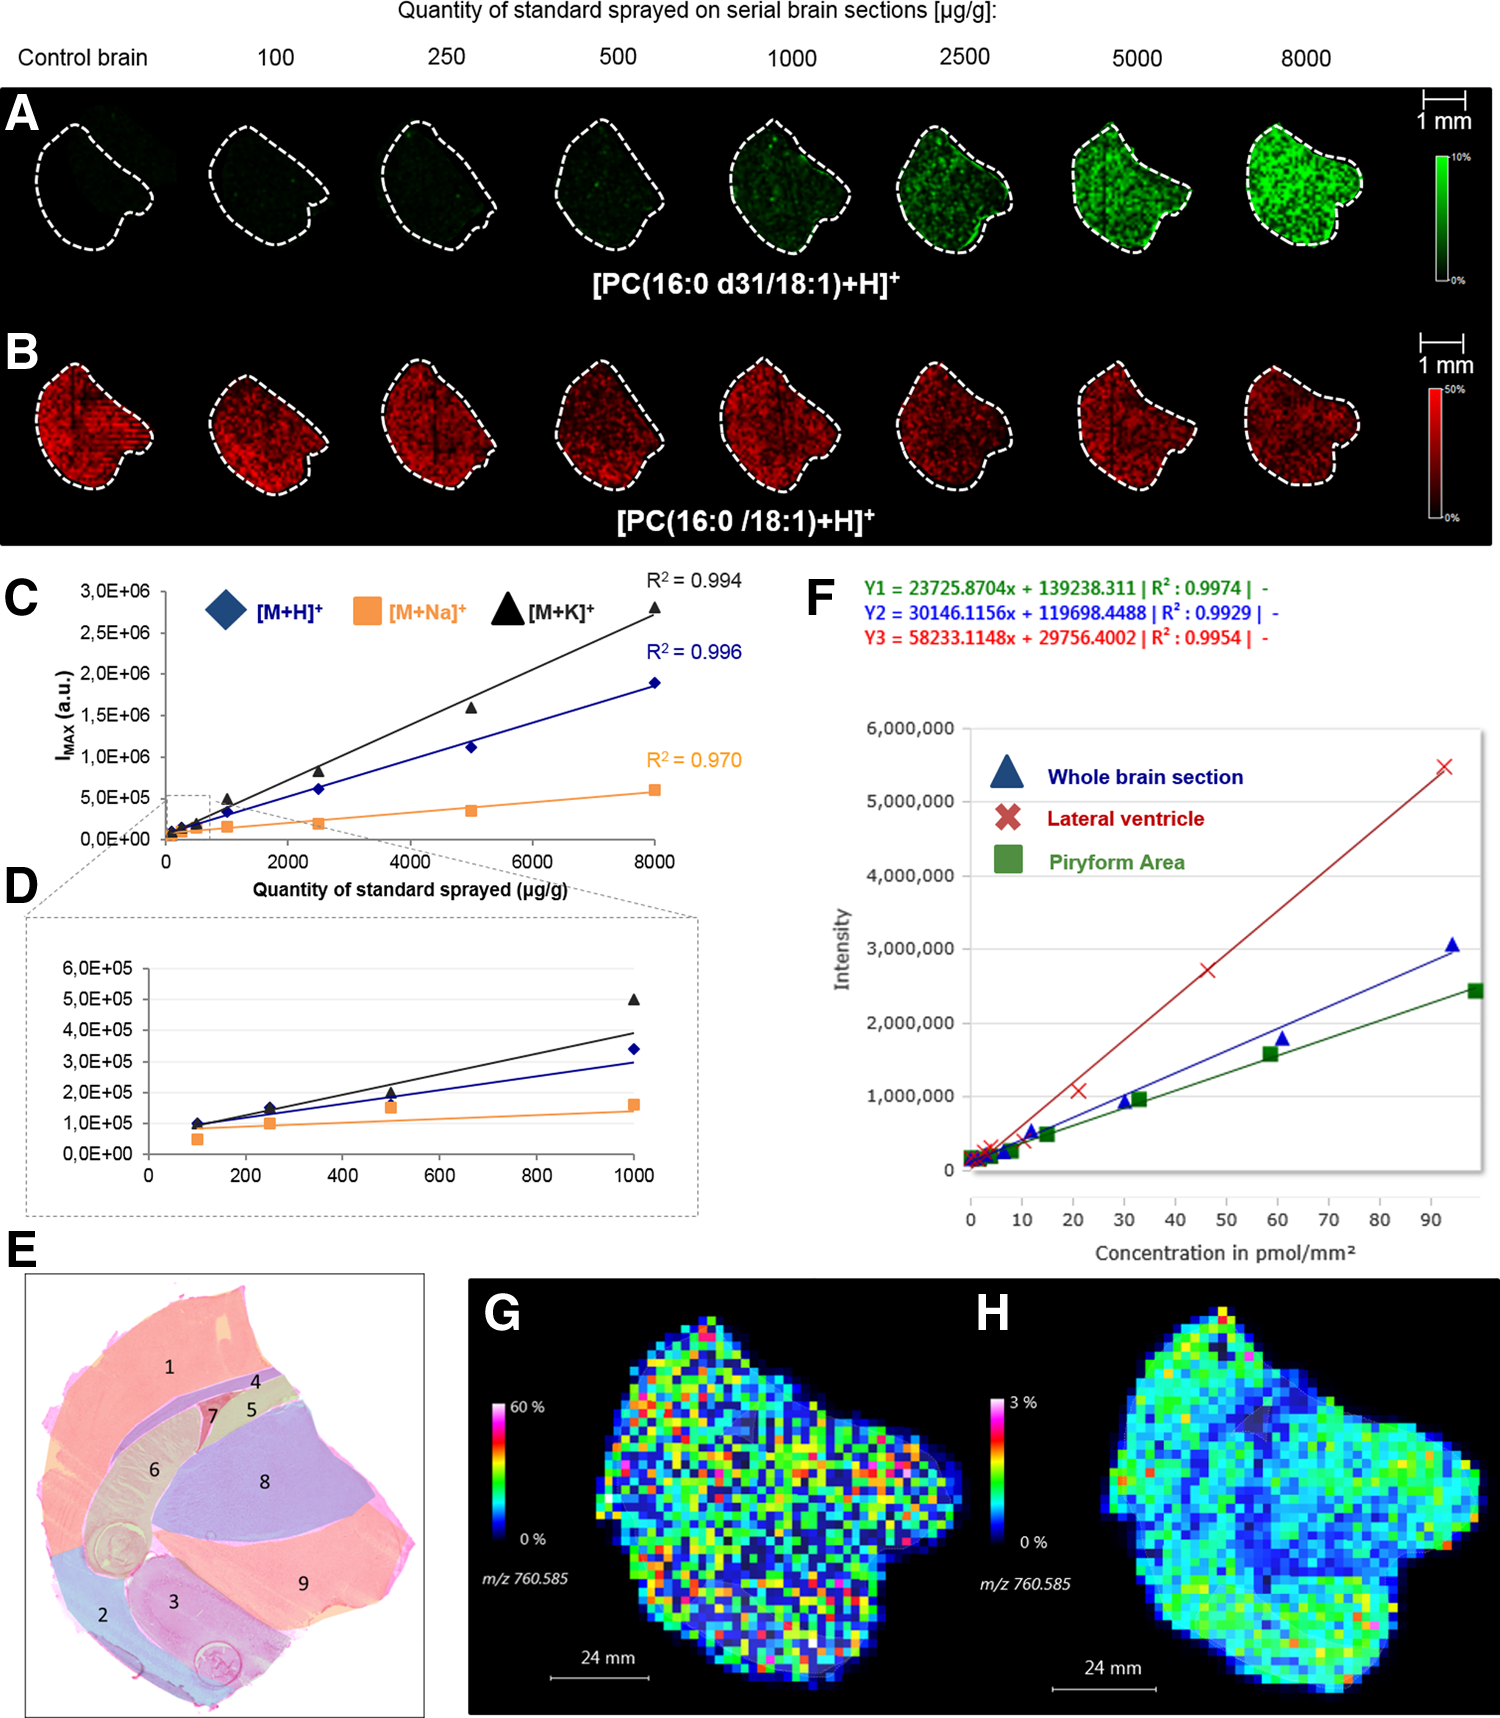
Determination of PC(16:0/18:1) ion suppression events in brain sections
Serial brain sections were thaw-mounted on a ITO-coated glass slide. Sections were spiked with a range of different PC(16:0 d31/18:1) concentrations (from 100 to 8000 μg/g of tissue) using the pneumatic atomization system. Spiked sections and a control were covered with 1,5-DAN before being analyzed by MALDI MSI (Fig. 3A,B). For each concentration, the average intensities of the monoisotopic peaks corresponding to [PC(16:0 d31/18:1)+H]+, [PC(16:0 d31/18:1)+Na]+, and [PC(16:0 d31/18:1)+K]+ species were manually reported. Linear regression lines were generated for each ionic form by plotting these values as a function of the quantities of PC(16:0 d31/18:1) sprayed on tissue sections (Fig. 3C,D). The coefficients of determination (R2) corresponding to the three ionic forms were respectively 0.996, 0.970 and 0.994. The linearity proved the accuracy of the deposition method. No significant differences were observed between the R2 values of the three ionic forms. However, the linear regression equations were different.
Analysis by MALDI MSI of serial brain sections spiked with a range (between 100 and 8000 μg/g) of PC(16:0 d31/18:1) concentrations using the SunCollect system (flow rate 3 μL/min, 100 deposition cycles).
Brain sections ROIs specific ion supression monitoring
The majority of organs or tissues (e.g., kidney, brain, tumors) are composed of different structures that may have different morphological and chemical environments. During the MALDI process, these are likely to have different suppressive effects on the PC signals. Therefore, we aimed at obtaining more reliable quantitative data by taking these different effects into account.
To this end, we generated “ROI-specific” linear regression lines from the previous quantitative data. We identified particular histological structures (cortex, piriform area, amygdala, corpus callosum, fimbria, caudoputamen, lateral ventricle, thalamus, and hypothalamus) from a serial section stained using H&E (Fig. 3E). In parallel, the DAN matrix was removed from the analyzed sections and those were also H&E stained. For each section, ROIs were defined on the molecular image and average mass spectra were simultaneously generated for each ROI and concentration. From these spectra, the intensities of the monoisotopic peaks corresponding to [PC(16:0 d31/18:1)+H]+, [PC(16:0 d31/18:1)+Na]+, and [PC(16:0 d31/18:1)+K]+ were used to generate manually “ROI-specific” standard curves.
Quantinetix 1.7 was used for the automatic establishment of calibration curves from standard compounds sprayed on several tissue sections at different amounts. We selected the ROIs on spiked tissue sections for each concentration and created separate standard curves. The protonated ionic form was here taken into account. For the brain sections, the R2 values generated for the whole section, the piriform area, and the lateral ventricle were, respectively, 0.9929, 0.9974, and 0.9954 (Figure 3F).
The software then generated linear regression lines presenting excellent linearity, indicating the possibility to elaborate valuable “ROI-specific” ones using the spray-based approach. The data were manually treated in parallel for verification and R2 values ranging from 0.913 to 0.998 (Table 1) were obtained. The R2 values in the different ROIs were approximately the same. However, the regression lines were different. It thus seemed that different ion suppression effects occurred according to the histological structures. Consequently, it is essential to consider the data independently from the different histological structures.
ROI1, cortex; ROI2, piryform area; ROI3, amygdala; ROI4, corpus callosum; ROI5, fimbria; ROI6, caudoputamen; ROI7, lateral ventricle; ROI8, thalamus; ROI9, hypothalamus.
Finally, we used a functionality of the program that allows normalization of the image based on local ion suppression events. Ion suppression of an endogenous molecule can only be monitored in different ROIs of a tissue section by spraying its corresponding standard (Isotope Labelled Compound) with the same quantity through the surface of the tissue, and measuring its average intensity in the ROIs. With the proposed normalization, the intensity of PC(16:0/18:1) (the endogenous compound) was divided by the intensity of PC(16:0 d31/18:1) (the standard compound) in every pixel of the imaging dataset. With this normalization process, ion suppression was then specifically taken into account in every analyzed pixel and used as a correcting factor for the signal of the endogenous compound.
The normalization was applied on the molecular images corresponding to the brain section. Figure 3 illustrates the image of PC(16:0/18:1) before (Inset G) and after normalization (Inset H). The normalization clearly revealed that the apparent homogeneous distribution of PC(16:0/18:1) through the sample surface in the non-normalized image was actually due to artifacts. After normalization, the image did reveal a more heterogeneous distribution of the lipid. This was in line with the differences found in the standard curves corresponding to PC(16:0 d31/18:1) in the different ROIs.
We can clearly see that the signal recorded in the corpus callosum and the lateral ventricle was lower in the normalized image than in the non-normalized one. Also, different ion intensities were observed within some tissue areas, such as the thalamus and hypothalamus. Image normalization clearly illustrates the importance of monitoring ion suppression for some types of compounds in tissues as it can hide the anatomical structures of, for example, the brain section in the PC(16:0/18:1) image. The normalization of every pixel allowed us to recover the structure of the brain section.
Determination of PC(16:0/18:1) ion suppression events in kidney sections
We tested the workflow with a totally different tissue (mouse kidney) to evaluate the impact of different chemical environments on local ion suppression. The kidney presents important tissue heterogeneity: cortex, inner medulla, and outer medulla that bear different functions and show important morphological differences.
As a control of the reliability of the spraying method to evaluate ion suppression effects from the whole tissue section, we created a spiked tissue homogenate with 2500 μg/mL of standard and compared the signal intensities between the sprayed section and the spiked homogenate section. As [M+H]+ species allowed us to retrieve the most linear calibration curve, we decided to focus on these values for the comparison of PC(16:0 d31/18:1) signals. As expected, similar standard intensities (5.33% difference) were found between the whole spiked tissue homogenate section and the sprayed section. With low flow-rate spray settings, the average signal from all the ROIs of the tissue corresponded to the signal from the spiked tissue homogenate.
Using manual interpretation, R2 values were found to be 0.986, 0.974, and 0.973 for [PC(16:0 d31/18:1)+H]+, [PC(16:0 d31/18:1)+Na]+, and [PC(16:0 d31/18:1)+K]+, respectively (Fig. 4C,D). We further defined ROIs on all sections according to the different structures (cortex, inner medulla and outer medulla) identified after the histological examination of a serial stained section (Fig. 4E) and “ROI-specific” standard curves were generated for each ionic form. The R2 values ranged from 0.922 to 0.988 (Table 2) and showed a relatively good linearity, as it was the case when using the software (Fig. 4F). Figure 4 illustrates the image before (Inset G) and after (Inset H) normalization. The signal of the endogenous compound measured in the cortex was found to be higher for the latter case. However, the normalized image showed that PC(16:0/18:1) signal intensity differences between the different ROIs of the tissue were less striking than expected, contrary to the brain section.
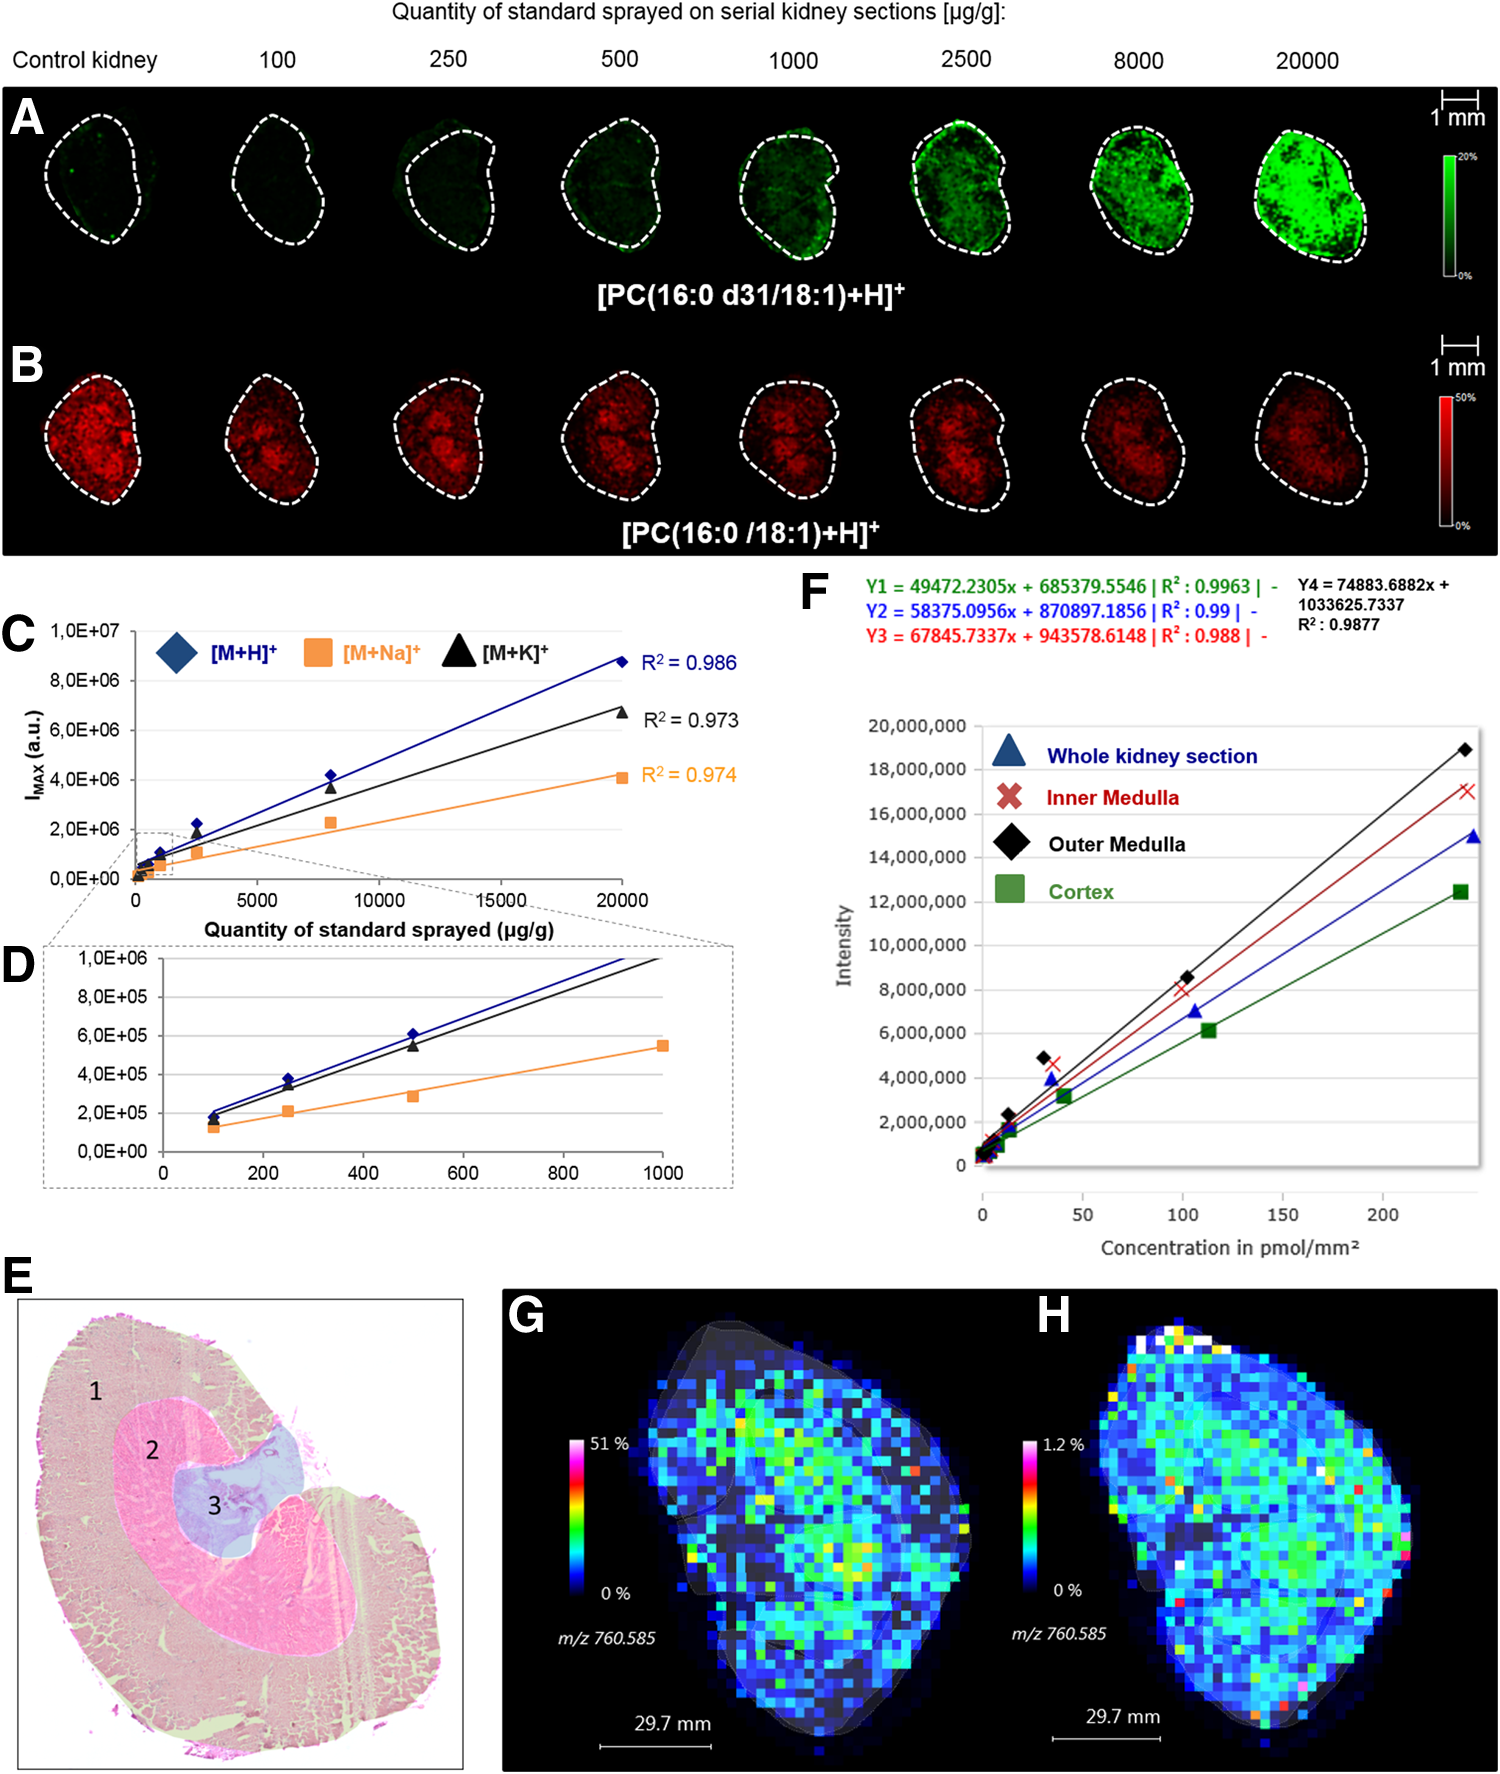
Analysis by MALDI MSI of serial kidney sections spiked with a range (between 100 and 20,000 μg/g) of PC(16:0 d31/18:1) concentrations using the SunCollect system (flow rate 3 μL/min, 100 deposition cycles).
ROI1, cortex; ROI2, outer medulla; ROI3, inner medulla.
Among the sections sprayed with different amounts of standard, we found a more obvious normalization effect when the intensity of the endogenous compound is divided by a higher intensity value of standard. The normalized MALDI image presented in the figure was created from the tissue sprayed with 8000 μg/g of standard.
Insight in quantification values from MALDI MSI data
In the near future, it would be interesting to use the method for MALDI MSI ion suppression monitoring during quantification calculations in different ROIs. Here, we give some insight in the values of PC(16:0/18:1) quantities when using the linear regression lines of PC(16:0 d31/18:1) for different ROIs as calibration curves for further quantification. It is important to note that using this approach for quantification would necessitate the validation of the calculated quantities presented here by another well-known quantification method. Laser microdissection coupled to LC-MS analyses recently proved to be highly efficient for lipid quantification in tissues (Hebbar et al., 2014).
Manual and automated measurements were tested. The linear regression lines generated from the different PC(16:0 d31/18:1) ionic species were used to convert the signal intensity of PC(16:0/18:1) into a concentration (μg/g, Supplementary Table S1) from the whole tissue section. To achieve this, we manually reported the intensities of the monoisotopic peaks of [PC(16:0/18:1)+H]+, [PC(16:0/18:1)+Na]+, and [PC(16:0/18:1)+K]+ recorded for the whole control brain section. They were then compared to the standard curves specific for each ionic species in order to extract quantitative data. Considering that the weight of the brain section was approximately 240 μg, the quantification values in μg/g were reported in g (Supplementary Table S1).
The same approach was used for the different ROIs of the brain sections. We reported the intensities of the monoisotopic peaks of PC(16:0/18:1)+H]+, [PC(16:0/18:1)+Na]+, and [PC(16:0/18:1)+K]+ recorded on the ROIs defined on the control section. These values were compared to the different “ROI-specific” standard curves in order to convert the signal intensity of PC(16:0/18:1) into concentration (μg/g, Supplementary Table S1). Then, we converted the data in grams using the ratio of each ROI surface against the whole tissue section surface. The same calculations were made for the kidney (Supplementary Table S2).
To test automated measurements in brain tissue, PC(16:0/18:1) was quantified in the whole section, the piriform area, and the lateral ventricle. These histological structures were selected because they presented the most important differences in ion suppression and quantitative values. Concerning the kidney, the endogenous lipid was quantified in the whole section, the cortex, the inner medulla, and the outer medulla.
We compared the quantitative results obtained for the different ROIs defined on the brain section (Fig. 5A) using the software with the quantitative results previously obtained for the [M+H]+ species. Results were in very good agreement as we found only 9.12% more PCs in the whole brain, 10.07% more in the piriform area, and 6.22% less in the lateral ventricle. Considering the quantitative data generated by the software, we also noted slight differences: +11.52%, + 8.16%, - 6.49%, and +16.1% of PC for the mentioned ROIs, respectively. Those slight differences may be due to differences in calculation methods between manual and automatic measurements and by slight differences in the ROIs selected for the calibration curves.

Insight in the quantitative values that can be obtained from MALDI MSI analyses using dedicated software. These values were calculated from the protonated ionic form.
Based on these results, it appeared that the values generated by the software were consistent with the values obtained by manual analysis. In possible applications for q-MSI, automated measurement would greatly accelerate the process, since it took only 30 minutes to obtain the results as against 8 hours for manual measurements. The software allows switching easily from a calibration equation to another for quantification calculations.
In order to check what would be the quantification result if an “average” calibration curve was used for the quantification of PC(16:0/18:1) in the most heterogenous regions of brain section (i.e., piriform area and lateral ventricle), we applied the calibration equation from the whole section to these regions. We found 33.164 mg/g in the piriform area and 16.417 mg/g in the lateral ventricle, which were respectively 21.2% less and 108.95% more than what was obtained when ROIs are considered for the calibration curves. These data proved again the importance of ion suppression in some tissue regions. Also, when using quantitative values, the level of ion suppression can be evaluated on the right point of the linear regression line. In this specific case, ion suppression is then about 2-fold less important in the lateral ventricle for PC(16:0/18:1) than in the entire tissue section.
For the kidney, results obtained by manual measurments are shown in Supplementary Table S1. Using automated measurements, PC quantities would be 3.602, 5.504, and 2.823 mg/g in inner medulla, outer medulla, and cortex, respectively, which were 16.02% less, 24.78% less, and 27.2 more than what was found when an “average” calibration curve is used. Those results are illustrated in Figure 5B. This reinforces the information obtained from the normalized images (i.e., the brain tissue seems to be much more heterogenous than the kidney), regarding PC(16:0/18:1) content.
As mentioned before, those values represent a first insight in the in-situ quantification of a phosphatidylcholine when using a MALDI MSI approach. Using low flow rates for standard deposition on tissue sections, its signal was the same compared to when it is incorporated in a tissue homogenate. In brain tissues, we found that creating calibration curves for each ROI allowed us to find up to 2-fold less PC in the lateral ventricle compared to what would be found if only one “average” calibration curve was created. Using another method might tell if these quantity shifts between the ROIs are the same.
Discussion
MALDI imaging is considered as the ultimate method for molecular histology as it allows the simultaneous localization of hundreds of compounds through tissue sections of different origin and nature. However, multiplexing ion detection can really be altered because of well-known ion suppression effects that are observed when complex samples containing compounds of very different nature are analyzed, leading to detection changes of some classes of compounds. Several methods have been proposed for the elaboration of calibration curves of the compound of interest or its associated standard within the tissue sample for quantification purposes.
The creation of tissue homogenates into which the standard is directly incorporated for the creation of the calibration curves is today the most reliable method for q-MSI of phosphatidyl choline. The method allows the standard and PC to be mixed in the same biochemical environment and to be detected under the same conditions. However, the method is highly sample-consuming as the creation of the homogenates requires large tissue amounts. This renders the approach impossible to use for pathological applications when only small tissue amounts are available from surgery. Also, this method is only applicable to organs presenting homogenous tissue types, but not to those with different tissue types or to full body animals. The homogenate only represents an “average” chemical environment and does not allow to monitor the differential ion suppression effects that occur in different regions of interest of a very heteregenous tissue.
In this work, our aim was to propose a method for the evaluation of differential ion suppression effects in tissues. First, spray settings have been optimized in order to minimize the solvent effect on the extraction of compouds from the tissue during the deposition of standard solutions. The elaboration of regio-specific linear regression lines from the intensities of PC(16:0 d31 /18:1) sprayed at different amounts of tissue sections revealed the influence of the different chemical environments on the detection of the standard lipid in some organs.
As a perspective of the possible use of this method for quantification purposes, we reported the values obtained when considering the linear regression lines calculated for increasing amounts of sprayed labelled PC as calibration curves. The values reveal the importance of considering ROIs separately for the creation of calibration curves. Indeed, up to 100% more PC was found in the lateral ventricle of the brain, when a calibration curve corresponding to the signal of the whole tissue was used instead of the one from the lateral ventricle itself.
Further, it would be interesting to compare the quantification values obtained with this method with another one that would also take into account the anatomical context of the tissues, such as laser micro dissection. Recently, Hebbar et al. (2014) proposed a methodogy that allows the simultaneous extraction and analysis of lipids from small microdissected tissue pieces. The collection of the dissected tissue pieces is directly in the cartridges that are used for the tissue processing, thus limiting sample loss.
Any quantification method suffers from the fact that the standard used for the analyses is not inherent to the sample but externally added. The standard detection is indeed directly related to its amount added, but the detection of the endogenous compound depends on the sampling approach and its extraction yield on the sample preparation process. In our case, the measurement of the PC quantity could depend on the way the standard is differently incorporated in the ROIs of the tissue when it is sprayed.
Regarding this fact, knowing the “true” amount of a compound in a specific environment is difficultly achievable. Therefore, in the near future, the comparison of quantification values obtained with completely different approaches would be interesting as a cross validation step.
Compared to the spiked homogenate method, the present approach as a quantification method would present the advantages of being less sample-consuming, and to be adequate for organs presenting different tissue types in very heterogeneous chemical environments. Although developed for endogenous compounds, it could also be applied to exogenous compounds such as drugs in pharmacological studies, and especially in whole body animals, with very heterogeneous chemical environments between the different organs.
Finally, this method would be easy to perform and its automation would be feasible. We can easily imagine the automatic preparation of tissue sections by the spraying device software. The position of the sections to spray and the corresponding amounts of lipids could then be programed in the software controlling the spraying device. This could soon offer the possibility for laboratories to apply ready-to-use MALDI-MSI based procedures for the evaluation of ion supression on compounds of interest in tissues. When used as a quantitative method, it would also offer an alternative to the use of other approaches such as LC-MS/MS.
Conclusions and Outlook
The approach for MALDI-MSI ion suppression monitoring may soon be extremely helpful for targeted MALDI MSI investigations. Contrary to the spiked tissue homogenates approach, this method is applicable to a large range of tissue models, as only few sections are required for the establishment of linear regression lines. This may find ground in pharmacokinetic experiments and their associated pharmacometabolomic follow-up. Also, ion suppression monitoring would be interesting for the study of tissue heterogeneity in pathology.
Generally, classical histology fails to recognize groups of cells originating from different clones in cancer since they have the same morphology. MALDI imaging appears to be an adequate tool to study this heterogeneity (Balluff et al., 2015) as molecular signatures can be detected for some tissue regions that are not distinctible by visual examination. As presented in our work, ion suppression monitoring of PC revealed the “anatomy” of tissue sections, especially in brain where only the normalized image of PC(16:0/18:1) revealed the structures of the section. We could imagine the use of this approach to reveal different anatomical structures in tumors, by taking into account the heterogenous ion suppression in cancer sections.
Ion suppression effects could then be considered as a pathology “marker” and studies could be carried out to search for the molecules that would best represent the “contrasts” in the image of the afflicted tissues. As an example of the application of the method for research in pathology, Alzheimer disease can be mentioned. Since phospholipids were partly found associated with Alzheimer disease, MALDI MSI ion suppression monitoring of PC may help to find altered structures in diseased brains.
Finally, compounds of interest could also be quantified in parallel to their ion suppression monitoring. In the future, this may be highly valuable for a panel of applications in different fields such as histopathology, when specific biomolecules of interest would have to be monitored for routine MALDI MSI-based diagnosis.
Footnotes
Acknowledgments
LJ thanks the REFRACT project for funding (“Action de Recherche Concertée”, ULg, Belgium). RL was funded by a postdoctoral fellowship of the ULg Research Council and MolekularPathologieTrier. The FTMS instrument was acquired with European funds for regional development (FEDER) and the FNRS. The team warmly thanks Pr. Pierre Drion who kindly provided the tissues from mice.
Author Disclosure Statement
The authors have declared no financial conflicts of interest.
Abbreviations Used
References
Supplementary Material
Please find the following supplemental material available below.
For Open Access articles published under a Creative Commons License, all supplemental material carries the same license as the article it is associated with.
For non-Open Access articles published, all supplemental material carries a non-exclusive license, and permission requests for re-use of supplemental material or any part of supplemental material shall be sent directly to the copyright owner as specified in the copyright notice associated with the article.