
Abstract
Abstract
The development of drug-resistant pathogenic bacteria poses challenges to global health for their treatment and control. In this context, stress response enables bacterial populations to survive extreme perturbations in the environment but remains poorly understood. Specific modules are activated for unique stressors with few recognized global regulators. The phenomenon of cross-stress protection strongly suggests the presence of central proteins that control the diverse stress responses. In this work, Escherichia coli was used to model the bacterial stress response. A Protein-Protein Interaction Network was generated by integrating differentially expressed genes in eight stress conditions of pH, temperature, and antibiotics with relevant gene ontology terms. Topological analysis identified 24 central proteins. The well-documented role of 16 central proteins in stress indicates central control of the response, while the remaining eight proteins may have a novel role in stress response. Cluster analysis of the generated network implicated RNA binding, flagellar assembly, ABC transporters, and DNA repair as important processes during response to stress. Pathway analysis showed crosstalk of Two Component Systems with metabolic processes, oxidative phosphorylation, and ABC transporters. The results were further validated by analysis of an independent cross-stress protection dataset. This study also reports on the ways in which bacterial stress response can progress to biofilm formation. In conclusion, we suggest that drug targets or pathways disrupting bacterial stress responses can potentially be exploited to combat antibiotic tolerance and multidrug resistance in the future.
Introduction
B
The bacterial stress response system has been linked to expression of virulence factors, multi-drug resistant phenotypes, biofilm formation, and antibiotic resistance (Giuliodori et al., 2007; Poole, 2012; Raivio et al., 2013) but still remains a poorly understood phenomenon. While it is recognized that certain common phenomena underlie generalized stress responses (Guo and Gross, 2014), studies aimed at identifying central stress response proteins could only conclude that every stress response has a specialized mechanism of action. Cross-stress protection, the ability of one stress condition to provide protection against other stressors, also suggests a central control of stress response. The observed high plasticity in phenotype is likely to stem from a common set of pleiotropic genes/pathways (Dragosits et al., 2013).
While it is generally accepted that the stress response system is a complex network (Ron, 2013), till date, no efforts have been made to represent it as a network. Network studies are well-suited to obtain a model encompassing disjoint components, and in identifying the central components regulating the flow of signals in the network. Specifically, progression of specific central changes to cause complex diseases can be captured (Gupta et al., 2015; Vinayagam et al., 2015). Network studies have previously been used to encapsulate big data into a single picture, allowing inference of novel concepts and conclusion (Pavlopoulos et al., 2015; Vinayagam et al., 2015). Network studies in bacteria have been used to elucidate functional aspects (Kumar et al., 2016; Purves et al., 2016; Typas and Sourjik, 2015).
In the present study, we generated a Protein-Protein Interaction Network (PPIN) to represent stress response in Escherichia coli, the model bacterium. Escherichia coli, apart from being well characterized, inhabits a plethora of environments—making it the ideal candidate for studying stress response. We hypothesized the existence of a set of central proteins connecting and regulating different effector pathways involved in the varied responses to specific stressors. These central proteins are also likely to be involved in mediating cross-stress protection. The seed nodes for the construction of a stress response PPIN (SR-PPIN) were obtained from two sources—the E. coli Gene Ontology (GO) term for stress and differentially expressed genes under a range of different abiotic stress conditions (heat, cold, acidic pH, basic pH, kanamycin, gentamycin, ampicillin, and norfloxacin). Topological analysis and pathway annotation identified a group of proteins central to stress response and coincided with those obtained with a cross-stress protection network (CS-PPIN) constructed from an independent RNA-Seq dataset (Dragosits et al., 2013).
Significantly enriched terms and clusters in the SR-PPIN point to a transcriptional and translational control of various metabolic processes for control of energy production, which is orchestrated by Two Component Systems (TCS). Literature evidence suggests that these constitute the common thread joining a diverse set of stress responses. Our study identifies six novel proteins, with a potential role as central mediators of stress response in E. coli. Apart from providing an integrated view of the stress responses for better understanding of this complex control system, our study highlights the common nodes that may drive the stress response towards development of antibiotic tolerance and biofilm formation. As the stress response is a de facto determinant of antimicrobial and multidrug resistance (Poole, 2012), the proteins central to the stress response may be viable therapeutic targets for combating antibiotic tolerance and resistance in pathogenic bacteria.
Materials and Methods
Identification of the seed nodes for stress response network generation
Genes directly involved in stress response for E. coli K12 MG1655 were obtained from Ecocyc using the GO term GO:0006950 (Response to stress) (Keseler et al., 2013). Microarray datasets were obtained from the Gene Expression Omnibus (Barrett and Edgar, 2006). All available datasets for stress conditions in E. coli were evaluated, and three well-curated datasets were chosen to identify differentially expressed proteins. GEO2R was used to identify differentially expressed genes with a cut-off of |Log2Fc| ≥ 2 and Benjamini-Hochberg False Discovery Rate (FDR) ≤0.05 under the following stressors: pH (GSE4511), temperature (GSE11041), and antibiotics (GSE56133). The specific stress conditions explored were: a) pH 5.0 (acidic); b) pH 8.7 (basic); c) 15°C (cold); d) 46°C (heat); e) Ampicillin; f) Gentamycin; g) Kanamycin; and h) Norfloxacin. A list of differentially expressed transcripts is provided in Supplementary Table S1 (supplementary material is available online at www.liebertpub.com/omi).
Identification of seed nodes for CS-PPIN
The central stress response elements are likely to mediate the rapid response to a second stressor after one stress has already been experienced. Therefore, RNA-seq data were taken from a cross-stress protection study (Dragosits et al., 2013), consisting of growth of E. coli for 500 generations under five different abiotic stress conditions (nutrient deprivation, 0.3 M NaCl, 0.6 n-butanol, 0.1 mMol H2O2, and pH 5.5). Once the cells had adapted to a specific condition, they were subjected to a different stress condition individually, and expression data was recorded. 58 differentially expressed genes under two or more stress conditions with a Benjamini-Hochberg False Discovery Rate (FDR) <0.05 were obtained from the Supplementary data provided with RNA-seq study (http://www.ncbi.nlm.nih.gov/pmc/articles/PMC3588905/bin/msb201276-s3.xlsx). These were used as seed nodes for constructing the CS-PPIN.
Seed nodes for networks representing biofilm formation and response to antibiotics
Biofilm formation and response to antibiotics are important effector responses to stress that are also pertinent for therapy. Studying their relation to the generated stress response network may provide an insight into how these phenomena are related. Biofilm formation and response to antibiotic are independent GO terms nested under different ancestor terms (GO:0042710 and GO:0046677, respectively). The genes from these GO terms were obtained using EcoCyc.
Generation of PPINs
The STRING database (von Mering et al., 2003) was used to create three separate networks that included high confidence (cutoff score: 0.775) interactors of a) The GO term for stress response; b) differentially expressed proteins from the pH and temperature stress conditions; and c) differentially expressed proteins during response to four antibiotics. A union of these three networks was generated using Cytoscape 3.2. This was used as the final SR-PPIN. Similarly, STRING was also used to obtain PPINs for CS, biofilm formation (BF-PPIN), and response to antibiotics (AB-PPIN). The intersection of different PPINs was determined using Cytoscape 3.2.
Validation and topological analysis of generated network
The generated stress response network was cross-validated using the Random Networks plugin for Cytoscape 2.6 (Shannon et al., 2003) by comparing the clustering coefficient and the mean shortest path from 1000 random graphs with our working network. In this method, two random edges (u, v) and (s, t) are selected from the network such that u ≠ v ≠ s ≠ t and (u, t) or (s, v) do not already exist in the network. Then, (u, v) and (s, t) are removed from the network, with insertion of (u, t) or (s, v). Repetition of this process yields a random graph between the nodes.
Topological analyses were carried out using NetworkAnalyzer (Assenov et al., 2008). The node-degree distribution, Average Clustering Coefficient, Closeness Centrality, and Betweenness Centrality (BC) were plotted using the NetworkAnalyzer in Cytoscape. Values deviating from the mean by more than 2σ were taken to be significant. Clusters were identified using Molecular Complex Detection (MCODE) using the haircut option (Bader and Hogue, 2003). The algorithm behind MCODE detects densely connected regions in PPINs. These regions often represent pathways or protein complexes.
Shortest paths
The ShortestPath plugin for Cytoscape was used to identify the shortest paths between two nodes in the SR-PPIN. This was used to create the ‘backbone’ network, which consisted of all hub-bottlenecks. The ‘backbone’ network helps to visualize the connectedness of the central nodes and indicates the completeness/robustness of the network.
Sub-network generation
Analysis of sub-networks has previously been used to identify and study the characteristics of related genes in networks (Alexeyenko et al., 2015; Pan et al., 2015). SubNet (Lemetre et al., 2013) was used for extracting the shortest path sub-networks from the parent SR-PPIN using a set of selected nodes.
GO and functional annotation
The final SR-PPIN consisted of 516 seed nodes from GO, 1248 differentially expressed nodes in response to various stressors, and their 785 first interactors. GO and functional annotation of the stress response network was carried out using Database for Annotation, Visualization, and Integrated Discovery (DAVID). The CS-PPIN was also annotated in the same way. The GO terms obtained from DAVID were reduced to relevant terms and visualized using REViGO (Supek et al., 2011). Key pathways were identified using KEGG Pathways resources in DAVID.
Results
SR-PPIN has a compact, scale free topology characteristic of biological networks
The SR-PPIN investigated had biological characteristics and contained 2497 nodes and 15,768 edges. Upon topological analysis, it was found that the highest degree was 109, while the average degree was 13.76. The node-degree distribution (Supplementary Fig. S1A) for the network followed a power law with a degree exponent of 1.55, indicating scale-free topology. The average clustering coefficient (Supplementary Fig. S1B) for randomly generated networks was 0.025 ± 0.001, while that from the SR-PPIN was 0.47. This almost 20x difference strongly suggests that the network had a potential to adopt a hierarchical organization. The mean path length for the SR-PPIN was calculated to be 4.89, which was congruous with the generally accepted average path length for E. coli (Xu et al., 2011).
The central nodes of the SR-PPIN are unique in comparison with the E. coli whole proteome PPIN. To compare the generated SR-PPIN with the larger E. coli PPIN, hub-bottlenecks were identified, and it was found that none of the 108 hub-bottlenecks coincided with those from the SR-PPIN. The SR-PPIN constitutes almost three-quarters of the entire proteome (Yellaboina et al., 2007). However, the lack of overlap between the proteome PPIN and the SR-PPIN indicates that the generated network is not generic and pertains to stress response in composition and connectivity.
Twenty-four proteins are central to the stress response
Analysis of the network identified twenty-four proteins as central nodes, which were hypothesized to be crucial to stress response. 133 (5.2%) of the total 2549 nodes were highly connected (having degree greater than 2σ) and accounted for 58.7% of the connectivity in the network. 65 nodes had a high BC (greater than 2σ) and will be referred to as ‘bottlenecks.’ The list of all high BC and high degree nodes is provided as Supplementary Table S2.
Constructing a sub-network with the twenty-four hub-bottlenecks (Fig. 1) showed that they form a highly connected backbone, with only FliC and GlyA disconnected from the other 22. On expanding the sub-network, 15 more nodes were added to connect all twenty-four hub-bottlenecks. Literature annotation of the hub-bottlenecks (Table 1) showed well-documented roles for sixteen proteins in bacterial stress response. The roles of Adk, FliC, PykA, GlyA, Eda, and AldA in the phenomenon will be investigated further.
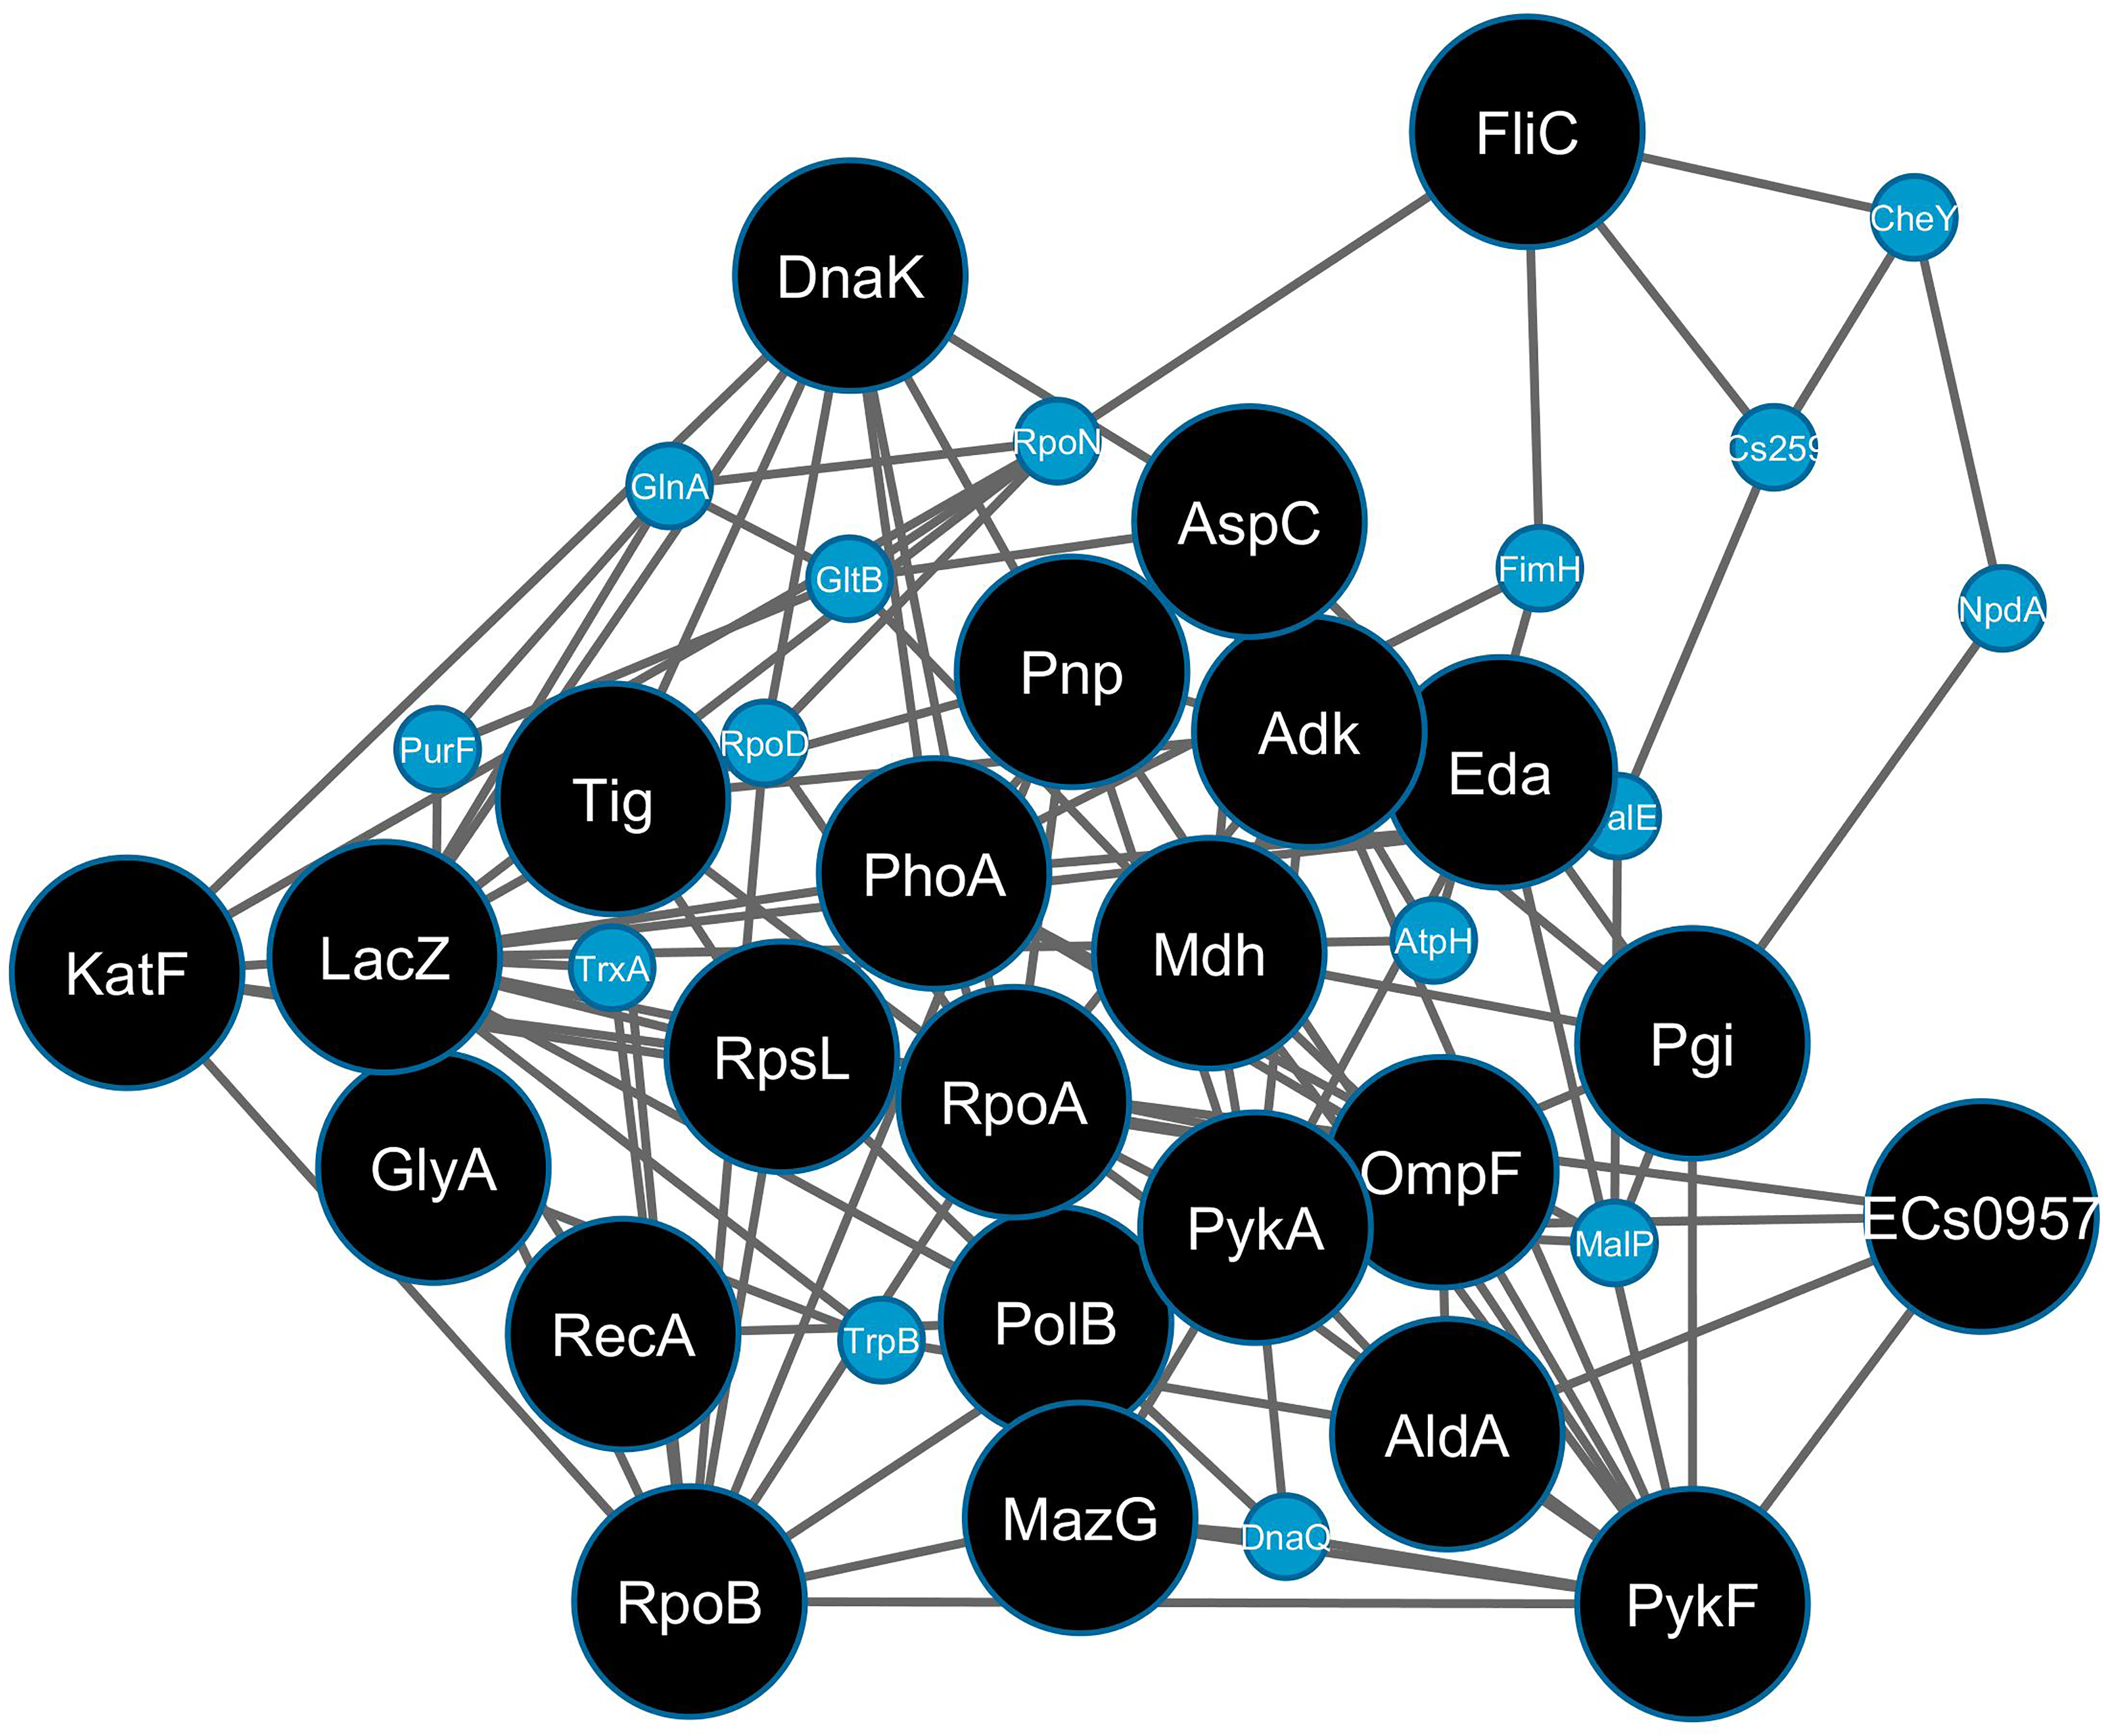
The highly connected sub-network of 24 hub-bottlenecks (black) nodes from the SR-PPIN. The additional connecting nodes are shown as smaller blue circles.
The table enlists hub-bottlenecks identified in the network along with their known role in stress response from literature.
>90% of the hub-bottlenecks are present in each stressor-specific sub-network
Eight sub-networks generated were generated corresponding to each stress condition (Fig. 2). A majority of the hub-bottlenecks (>90%) from the SR-PPIN were present in each of the sub-networks generated. The presence of most hub-bottlenecks in the eight sub-networks generated shows that a majority of these hypothesized central proteins are crucial to a wide variety of stress responses, also supporting our hypothesis that a common set of stress mediators is present. The list of all the identified hub-bottlenecks found in each stressor-specific sub-network is provided as Supplementary Table S3.

Schematic showing the presence of hub-bottlenecks in sub-networks. The central circle represents the hub-bottlenecks (24 nodes) from the SR-PPIN. The ovals represent sub-networks constructed from differentially expressed genes from eight conditions under three broad categories, namely pH, temperature, and antibiotics. The overlap of each oval with the central circle denotes the presence of hub-bottlenecks from the SR-PPIN. The numbers outside each oval represent the number of nodes in the sub-network.
Translational control of metabolism and energy production is important during stress response
GO annotation of nodes in the SR-PPIN identified translation, carbohydrate metabolism, anaerobic respiration, and generation of precursor metabolites and energy as significant terms. Pathway annotation of the genes from mapped ontology term highlighted glycolysis/gluconeogenesis, citric acid cycle (TCA cycle), and pentose phosphate pathways.
RNA binding, flagellar assembly, ABC transporters, and DNA repair are highly enriched clusters from the SR-PPIN
The MCODE cluster finding algorithm detects large densely interconnected areas of a network that are likely to represent large molecular complexes. Six highly connected clusters were identified in the SR-PPIN using MCODE, namely:
1. RNA-binding proteins: Most proteins in this cluster (63 proteins) were ribosomal proteins. It was the highest ranked cluster and contained the hub-bottlenecks Tig, RpsL, RpoA, and RpoB. 2. Flagellar assembly: The cluster contains FliC, the main flagellar subunit and a hub-bottleneck in the SR-PPIN. 3. Pyruvate synthesis: This cluster contains the kinases and dehydrogenases AldA, PykA, PykF, and ECs0957 that are hub-bottlenecks in the SR-PPIN. 4. Oxidative phosphorylation: An important energy metabolism pathway. 5. ABC Transporters: A class of transmembrane transport proteins. 6. DNA repair: This cluster contains RecA, a hub-bottleneck.
A detailed list of the genes in each cluster is provided as Table 2 (full names in Supplementary Table S4). The presence of connected clusters corresponding to central and essential GO processes identified reinforce their involvement in stress response.
The clusters are arranged in descending order of their MCODE score, along with number of nodes, edges, and constituent proteins. The hub-bottlenecks in each cluster are shown in
TCS as a central orchestrator of the flagellar assembly, ABC transporter, ribosome, and metabolic pathways
Several pathways were over-represented in the SR-PPIN. The top 10 significantly enriched pathways were: 1) purine and pyrimidine metabolism; 2) butanoate metabolism; 3) oxidative phosphorylation; 4) arginine metabolism; 5) glyoxylate pathway; 6) nitrogen metabolism; 7) TCS; 8) flagellar assembly; 9) ABC transporters; 10) ribosome. Apart from these pathways discussed above, a large number of other players in stress response were also identified by pathway annotation. A list of all the enriched pathways found from this network is provided as Supplementary Table S5.
The TCS pathway emerged as the most critical mediator of the pathway crosstalk, as all the top identified pathways were connected to the TCS pathway by first interactors, often hub-bottlenecks (Fig. 3). A list of the nodes shown in each pathway cluster (1–11) shown in Figure 3 is provided in Supplementary Table S6. TCS displayed crosstalk with the flagellar assembly pathway through the motility genes known to be involved in the process of biofilm formation and architecture (Wood et al., 2006). TCS crosstalk with the ABC transporter pathway was mediated by PstS, a part of the high affinity Pi transporter, PstSCAB, which is upregulated 100 fold during phosphate starvation (Magota et al., 1984).
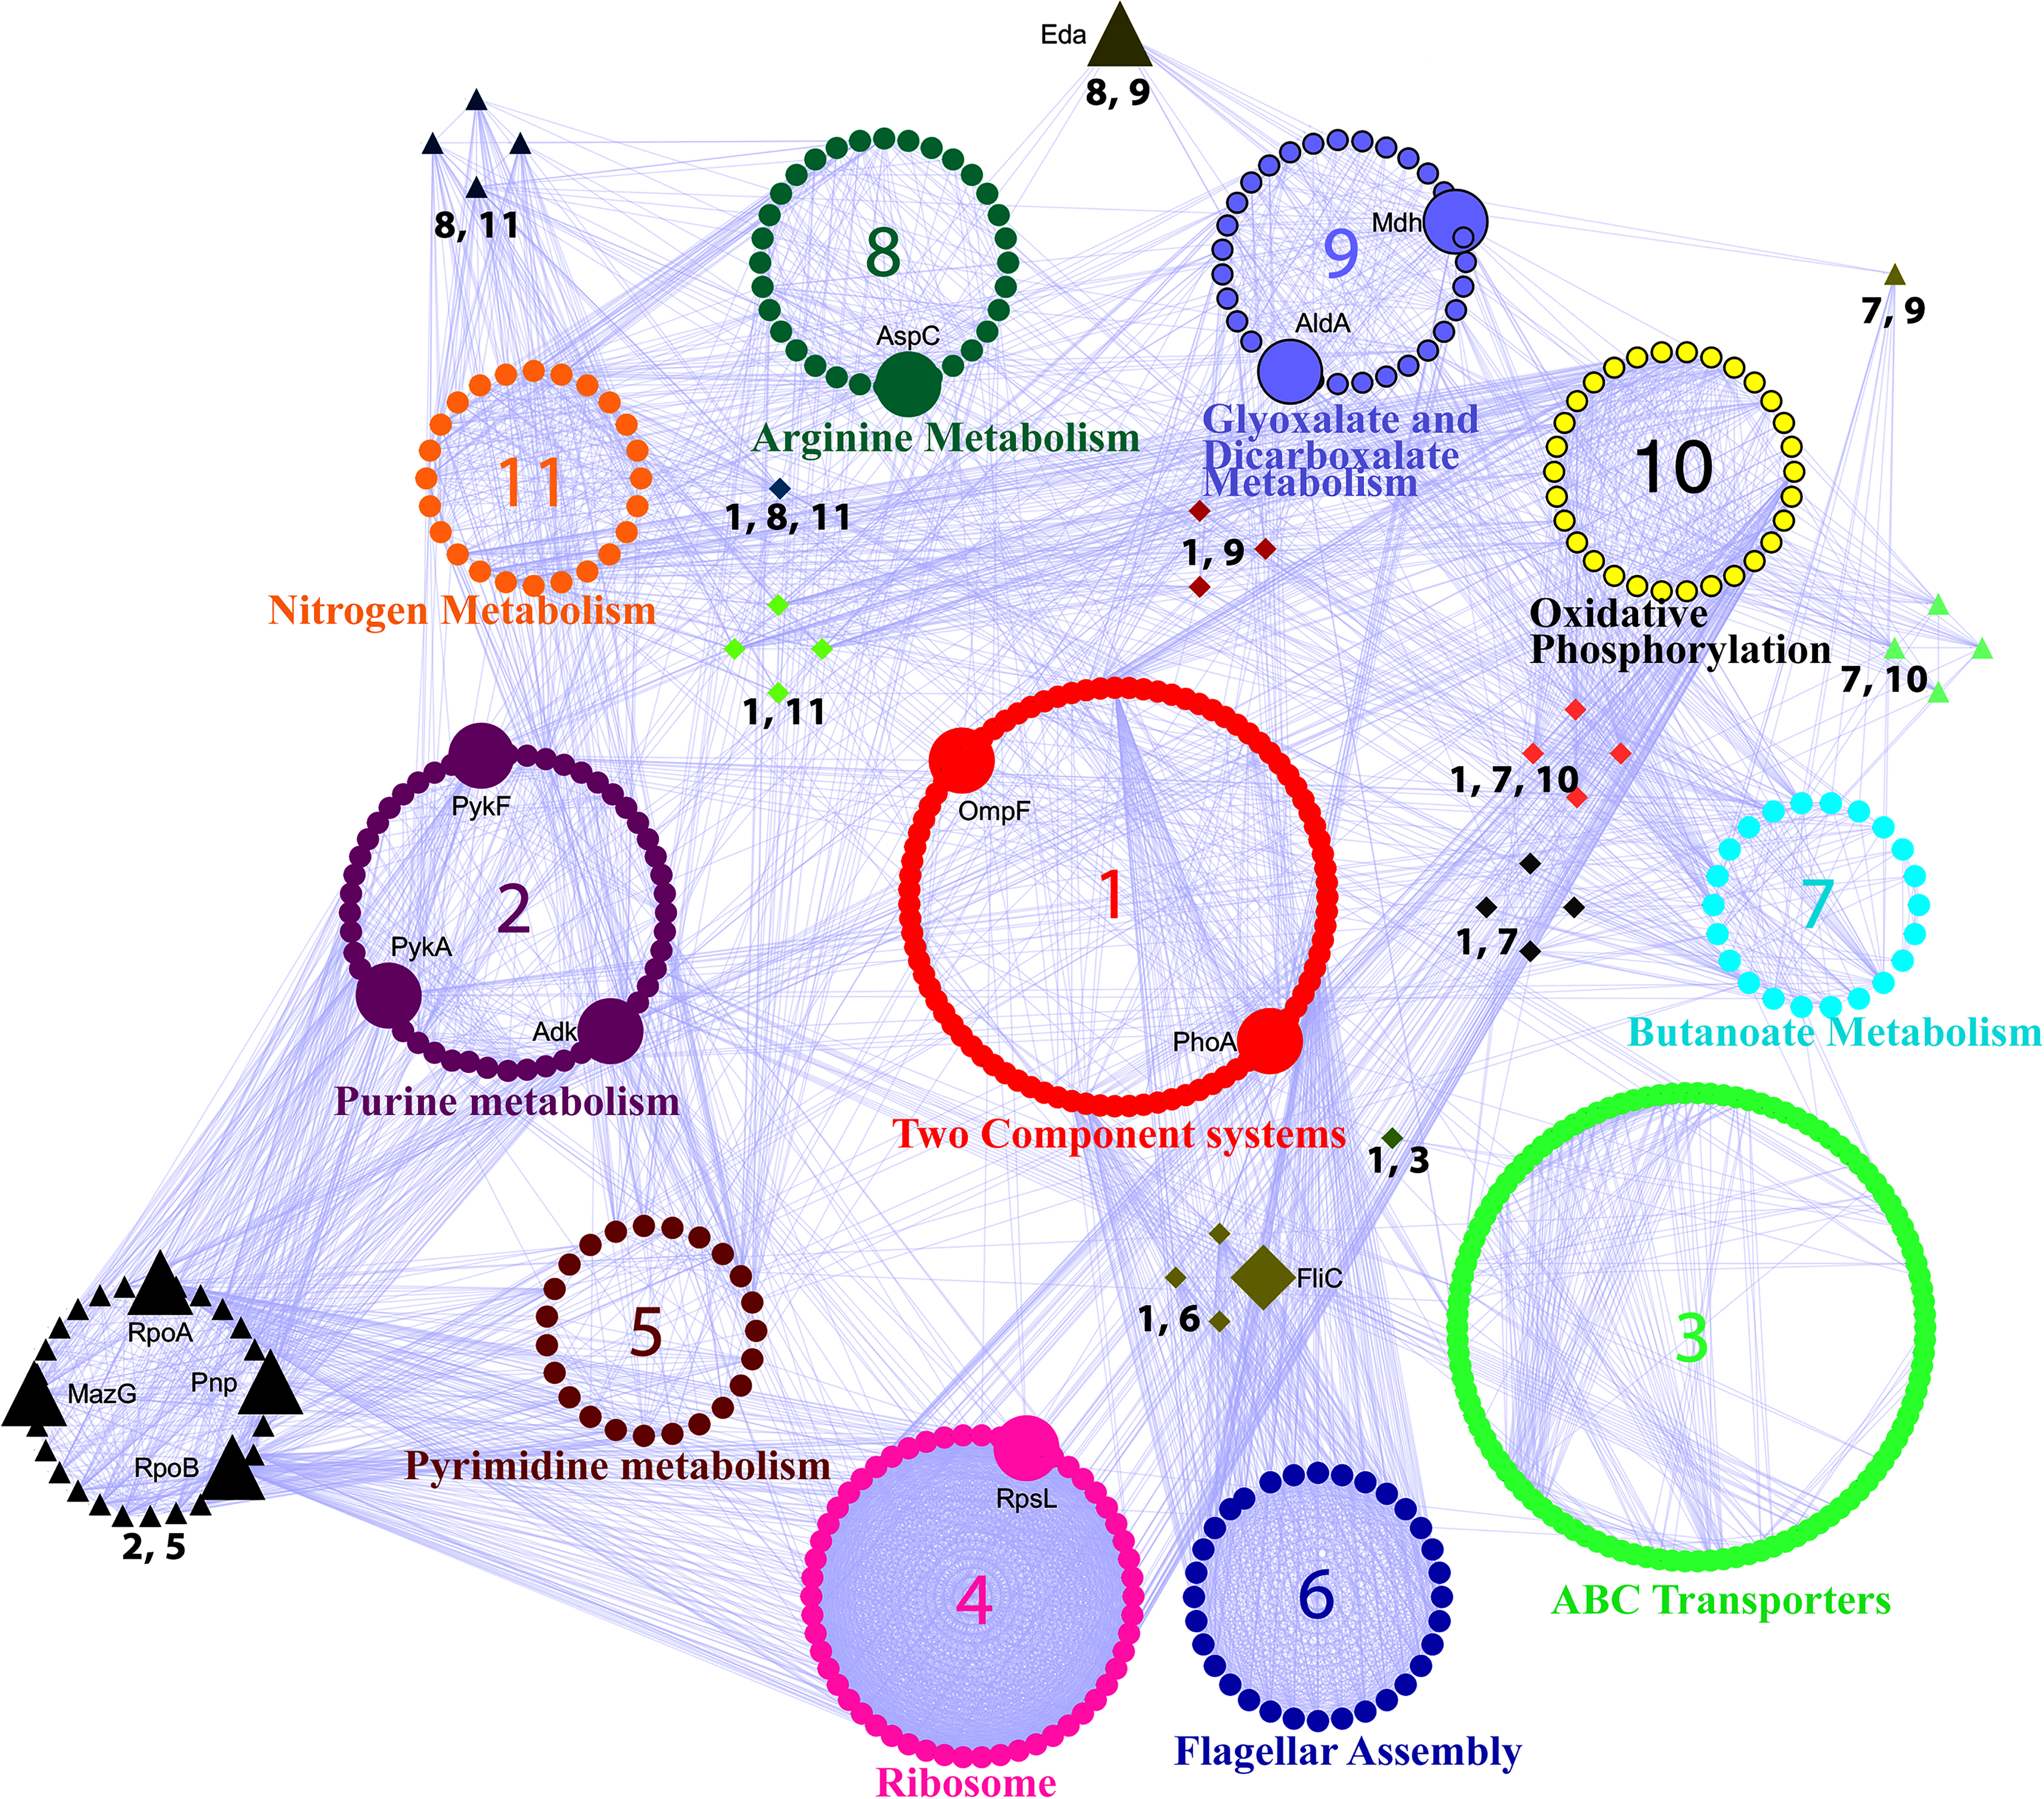
Crosstalk between the top enriched pathways in the SR-PPIN. The clusters represent the proteins in each named pathway, while edges show the interactions between the different pathways. The pathway clusters are numbered in order of their enrichment in the network and color coded as follows: 1. Two Component System (red); 2. Purine metabolism (purple); 3. ABC transporters (green); 4. Ribosome (magenta); 5. Pyrimidine metabolism (dark brown); 6. Flagellar Assembly (dark blue); 7. Butanoate metabolism (cyan); 8. Arginine metabolism (dark green); 9. Glyoxylate and dicarboxalate metabolism (light blue); 10. Oxidative phosphorylation (yellow); 11. Nitrogen metabolism (orange). The TCS cluster is placed in the middle as it has highest crosstalk with the other clusters (7 out of 11). Clusters of nodes with more than one number next to them are part of the overlap in the two pathways. Pathways having an overlap with TCS are shown as diamonds, while all other overlaps are shown as triangles. Hub-bottlenecks are depicted to be bigger than the other nodes, irrespective of shape. Edges between nodes are shown in violet color. The list of nodes present in each pathway cluster is provided as Supplementary Table S6.
Other transcriptional regulators in the SR-PPIN
Apart from the 38 TCS, 7 sigma factors and 157 transcriptional regulators were also present in the network. The well-established sigma factor RpoS emerged as one of the hub-bottlenecks identified in the SR-PPIN.
LacZ, GlyA, and OmpF connect stress response, response to antibiotics, and biofilm formation
Biofilm formation and response to antibiotics are highly important cellular phenomena for antimicrobial therapeutics. In order to see the central proteins common to these manifestations and stress response, an intersection between BF-PPIN and AB-PPIN was created. Also, if stressors are seen as triggers and biofilm formation to be an effector response, the proteins orchestrating the transition may be present in this intersection. It was found that the intersection of all three networks contained 51 nodes, 3 of which were hub-bottlenecks from the initial SR-PPIN (LacZ, GlyA, and OmpF) (Fig. 4). The ‘one carbon pool by folate’ pathway was most prominently featured amongst the 51 nodes of the intersection. Thus, GlyA, LacZ, and OmpF—the hub-bottleneck proteins present in the overlap between the three networks—may be the driver nodes for biofilm formation in response to certain stressors. These nodes are likely to drive the progression to antibiotic response and biofilm formation.

Correlation between nodes in the SR-PPIN, BF-PPIN, and AB-PPIN. The schematic shows an overlap between nodes in the networks created for biofilm formation (green), response to antibiotics (blue), and the SR-PPIN (orange). The intersection (shaded gray) contains 51 nodes, most of which are part of the ‘One carbon pool by folate’ pathway. Three hub-bottlenecks from the SR-PPIN: GlyA, OmpF, and LacZ (red) were part of the intersection.
The CS-PPIN shares the same hub-bottlenecks, pathways, and processes as the SR-PPIN
We hypothesized that the central nodes from the SR-PPIN would be critical for the phenomenon of cross-stress protection, responsible for fast and efficient response to serial stresses. A PPIN was constructed for the differentially expressed genes as identified from the cross-stress protection RNA-seqdataset as described in the Methods section. Topological analysis of this CS- PPIN made up of 685 nodes and 8271 edges showed that all 6 hub-bottlenecks from this network (RpsL, RpoA, RpoB, Tig, LacZ, and KatF) overlap with those found in our study. Pathways like ribosome, purine metabolism, and ABC transporters found to be enriched in the CS-PPIN also coincided with those from the SR-PPIN (Supplementary Table S5).
Discussion
The development of drug-resistant pathogenic bacteria poses challenges to the existing options for their treatment and control (Udwadia et al., 2012; Velayati et al., 2009). The drug-resistant/tolerant populations of bacteria develop by reprogramming of the metabolic network to allow growth in the presence of otherwise bactericidal concentrations of antibiotics and enable it to escape immune mechanisms (Murima et al., 2014). We reason that the central controllers of the stress response mechanism aid the development of drug resistance and could be targeted for disrupting its development.
With this aim, a network was constructed to decipher stress response in bacteria using E. coli as a model. Topological analysis of the network identified the central nodes, main pathways, and critical processes of the network. Despite the large size of the SR-PPIN, its central nodes were unique in comparison with the whole proteome PPIN. The presence of the same hub-bottlenecks in the CS-PPIN shows that the same nodes are responsible for the development of cross-stress protection.
Hub-bottlenecks correlate with essential genes in many organisms (Jeong et al., 2001; Raman et al., 2014). Therefore, these were treated as the most important nodes in the network. It is interesting to note that seven of the hub-bottlenecks (Pnp, RpoA, RpoB, RpsL, DnaK, Adk, and GlyA) of the SR-PPIN were identified as essential genes for E. coli in a rich medium (Baba et al., 2006; Gerdes et al., 2003). However, the ‘essential’ status of a gene is dependent on the choice of environment (Gerdes et al., 2003).
The transcriptional and translational control of stress response is a well-known phenomenon and forms the basis of dramatic cellular reprogramming in response to environmental stress (reviewed in Chung, 2006; Guo and Gross, 2014; Shimizu, 2013). An elaborate interconnected network of pathways is involved in regulating translation in response to varied stresses such as nutrient deprivation, pH, ionic strength, and temperature (Wilson and Nierhaus, 2007). While transcription is a well-established mediator of stress, recent studies of bacterial stress response show the formation of ribosomes that selectively translate leaderless mRNA. Such ribosomes are functionally distinct and can be selectively induced under stress (Moll and Engelberg-Kulka, 2012; Vesper et al., 2011).
The presence of glycolysis/gluconeogenesis, citric acid cycle (TCA cycle), and pentose phosphate pathway is coherent with what is previously known about the regulation of catabolic pathways during stress response (Jozefczuk et al., 2010; Shimizu, 2013). The changes in the translational machinery for control of energy and precursor molecules from the central carbon metabolism pathways is known to be a common stress response mechanism (Hardiman et al., 2007).

Schematic showing an overview of top pathways and clusters in the E. coli SR-PPIN. The image depicts the top pathways (rectangular boxes) and their correlation with similar clusters (ellipses) obtained from the SR-PPIN. Metabolic pathways have been clubbed under one header for better organization.
Annotation of the SR-PPIN also showed the clusters significantly enriched in the SR-PPIN as discussed below:
1. RNA-binding proteins, especially RpoA and RpoB, are RNA polymerase subunits with a documented central role in regulation of the transcription during stress (Bergval et al., 2007; Caspeta et al., 2009; Dragosits et al., 2013). RpsL is a ribosomal protein that stabilizes the bases of the 16s rRNA that are involved in tRNA selection in the A site with the mRNA backbone. Mutation in this protein seems to confer streptomycin resistance (Balashov and Humayun, 2002). Protein factors bind to the translational apparatus and reprogram or shut down translation. Another set of ribosomal binding proteins are known to bind to and rescue the ribosome stalled by a variety of mechanisms induced in response to stress (reviewed in Starosta et al., 2014). The importance of transcription and translation machineries in stress is reflected in the high ranking of this cluster. 2. Flagellar assembly is an important part of the stress response. Depletion of nutrients causes E. coli to produce flagella and become highly motile, leading to the induction of a foraging-like behavior (Zhao et al., 2007). Later, as the nutrients grow scarce and this foraging behavior is no longer required, the cells undergo a global switch to concentrate solely on growth and survival (Lange and Hengge-Aronis, 1991). Flagella-related morphological changes could be used to differentiate between different stages of the nutrient-dependent stress response in macrocolonies (Serra and Hengge, 2014; Serra et al., 2013). 3. Pyruvate is an important precursor metabolite involved in energy production. The phosphoenolpyruvate-pyruvate-oxaloacetate node forms an interface between the main carbon metabolism pathways. Thus, metabolite interconversion at this node regulates the flux distribution of the carbon metabolism between catabolism, anabolism, and energy production (Sauer and Eikmanns, 2005). Apart from the involvement of the phosphoenolpyruvate-pyruvate-oxaloacetate node in Glycolysis and TCA cycle, studies show the overall function of this node during nutrient starvation (Emmerling et al., 2002; Fischer and Sauer, 2003) and its effect on E. coli physiology (Chao et al., 1993; Gokarn et al., 2000). Hence, the control and regulation of energy production is important to stress response. 4. Oxidative phosphorylation is a central pathway for producing energy in the cell. As discussed in the previous section, energy production is closely regulated in a cell under stress to achieve the desired state to counter the effects of the stressor. Aerobic electron transfer chain components are known to be downregulated during growth arrest during stationary phase (Schurig-Briccio et al., 2009). The Small Colony Variant (SCV) in Staphylococcus aureus displays antibiotic resistance (Garcia et al., 2013; McNamara and Proctor, 2000) and is an adaptive mechanism for survival against environmental stress (Moisan et al., 2006) and intracellular factors (Schroder et al., 2006; Sendi and Proctor, 2009). This phenotype is mimicked by mutants of the electron transport chain proteins (Balwit et al., 1994). Comparison of gene expression profiles from the small colony variant with that of wild-type S. aureus showed that SCV mutants showed lower expression of genes required for thiamine metabolism (produces menadione, a component of electron transfer chain) as well as oxidative phosphorylation (Cui et al., 2012). The SCV phenotype has also been associated with persistent infections in S. aureus (Tuchscherr et al., 2011). Thus, regulation of oxidative phosphorylation is essential to control the energy output of the cell and further regulate other pathways involved in the response to stress. 5. ABC transporters are responsible for ATP-dependent translocation of substrates across the membrane. These proteins are known to be closely regulated during stress (Checroun and Gutierrez, 2004; Lubelski et al., 2007; Murugasu-Oei et al., 1999) and are known to confer multiple drug resistance on bacteria by virtue of their ability to drive active drug extrusion, thereby preventing it from exerting its cytotoxic effects (Shapiro and Ling, 1995). Apart from their role in antibiotic resistance, ABC transporters transport a variety of structurally unrelated substrates and mediate the interaction with their host organisms. ABC Transporters are activated in response to a variety of stressors and fitness responses like colonization, pathogenesis, cell-cell communication and biofilm formation (Nishino et al., 2009; Piddock, 2006). The stress response functions of bacterial ABC transporters were indicated by up-regulation in response to fatty acids, ethanol, high salt concentration, etc. (Ma et al., 1995). 6. DNA damage repair pathways play a role in the maintenance of genome integrity, colonization, and virulence. It is mediated by the SOS response that induces genes for excision of damaged nucleotides as well as error prone DNA polymerases (Zgur-Bertok, 2013). The SOS response is mediated by a wide range of stressors including ultra-violet radiation, mutagens, chemicals, acids, and physical stressors (Aertsen and Michiels, 2005). The SOS-associated polymerases enable increased mutation rate and adaptability. The SOS gene also causes induction of a toxin–antitoxin system that promotes formation of dormant persister cells by decreasing the proton motive force, leading to low energy production and shutdown of the metabolism (Dorr et al., 2010). The SOS response also promotes formation of antibiotic resistant, adherent microbial communities in biofilms (van der Veen and Abee, 2010).
Several pathways were over-represented in the SR-PPIN. The role of the top ten significantly enriched pathways in the network is discussed below:
1. Purine and pyrimidine metabolism. Purines are important for their energy transfer functions (as ATP and GTP) and cell signaling molecules (as cyclic AMP and bis-3′-5′-cyclic-di-GMP) (Hengge, 2009). These signaling molecules play a pivotal role in cellular stress response and biofilm formation (Gosset et al., 2004; Weber et al., 2006). The pyrimidine biosynthetic pathway regulates the production of biofilm determinants as a compensatory mechanism against environmental stress (Garavaglia et al., 2012). Thus, the purine and pyrimidine biosynthetic pathways allow the cell to sense the changing environmental conditions and to adapt to them. 2. Butanoate metabolism has a special role in energy production and is seen under anaerobic conditions (Herrmann et al., 2008). This pathway has been identified as an important mediator of oxidative stress tolerance (Kang et al., 2013). 3. Oxidative phosphorylation. This term was also identified as important by cluster analysis and as an enriched GO term. It has been discussed under the cluster analysis section. 4. Arginine metabolism is important for the acid resistance required for colonization of the host by E. coli (Castanie-Cornet et al., 1999). Arginine, an important carbon and nitrogen source during starvation (McFall E, 1996), has a role in oxidative stress and phosphate starvation (Cui et al., 2001). Nitrogen-limitation response controls genes that degrade arginine and ornithine as well as the general stress regulator RpoS—indicating its significance for stress response. Polyamine catabolism has been seen as a core metabolic response to several different types of stresses (Schneider et al., 2013). 5. Glyoxylate pathway. The glyoxylate shunt allows bacteria to grow on acetate or fatty acids as the sole source of carbon for the Krebs cycle (Smith, 2003). An important metabolic rearrangement occurs during the transition from high glucose conditions to glucose depletion. In the presence of glucose, the cells operate in glycolytic mode and synthesize ethanol, whereas upon depletion of glucose, they use the alternate glucose sources by switching to gluconeogenesis. This wide-spread phenomenon termed the diauxic shift and is marked by the activation of the glyoxylate cycle (Zampar et al., 2013), and is under control of the cAMP repressor protein (Shimizu, 2013). Specific enzymes for this pathway have been shown to be upregulated in the stressed environment of biofilms in Cryptococcus neoformans (Santi et al., 2014). 6. Nitrogen metabolism. As nitrogen is a key nutrient essential to the survival of the cell, gene modules related to nitrogen assimilation and scavenging are upregulated during nitrogen stress in Mycobacterium smegmatis (Williams et al., 2013). Nitrogen-starved cells synthesize a stress alarmone (guanosinetetraphosphate (ppGpp)) that initiates a large number of global physiological changes, finally leading to the stringent response. relA, a key gene responsible for the synthesis of ppGpp is activated by the nitrogen regulation protein NtrC (part of the NtrBC TCS) in response to nitrogen starvation (Brown et al., 2014). 7. TCS represent the most prevalent molecules for sensing and responding to their extracellular and intracellular environment. A typical TCS consists of a sensor histidine kinase and its cognate response regulator. A signal activates the phosphodonor function of the histidine kinase to cause phosphorylation of the response regulator (Laub, 2011), in turn, enabling the output domain of the response regulator to bind to DNA, control transcription, perform enzymatic activities, or participate in new interactions (Gao et al., 2007). Thus, TCS are the main transducers of extracellular signals into the cell. Due to their property to act at the level of transcription, TCS are regarded as global regulators (Shimizu, 2013). 8. Flagellar assembly. Increased flagellar production and motility is associated with the initial phase of the stress response (Zhao et al., 2007) while sustained nutrient starvation leads to a shutdown of the flagellar genes, enabling the cell to conserve resources for growth and survival (Lange and Hengge-Aronis, 1991). Flagellar assembly was also identified as a highly connected cluster. Its significance has been discussed in the cluster analysis results. 9. ABC transporters are known to be upregulated during stress while specific members have been implicated in DNA repair during stress (Al Mamun et al., 2012), osmotic stress (Checroun and Gutierrez, 2004), and multidrug-induced stress resistance (Lubelski et al., 2007). This was also a highly connected MCODE cluster and has been discussed previously. 10. Ribosome. The prominent role of the ribosome and ribosome binding proteins in stress was also evident from the GO and cluster analysis of the SR-PPIN in this study. While control of translation has long been recognized as a response to varied stressors, a fundamental way for regulating gene expression is the control of ribosomal biogenesis. A large number of factors are involved in processing, modification, assembly, and unusual initiation of the ribosome during stress (Wilson and Nierhaus, 2007). The role of this pathway in stress was discussed in the cluster analysis section.
Cluster and pathway analysis together confirm the importance of the pathways as discussed above. Combinatorial integration of the crosstalk between versatile component pathways has been viewed as the mechanism for generating a specific biological response (Kolch, 2000). Therefore, the finding that all the prominent pathways in the network showed cross-talk with the TCS highlights their role as the orchestrator of the stress response in E. coli.
This work also explores the common nodes between stress response, biofilm formation, and response to antibiotics. The ‘one carbon pool by folate’ pathway, identified from nodes at the intersection of biofilm formation and response to antibiotics, is essential for the high-fidelity synthesis of DNA and activated groups that are required for DNA methylation (Dev and Harvey, 1982). This reiterates the fact that DNA repair is an important feature of stress response. The pathway enzymes are essential for folate biosynthesis and constitute important antimicrobial drug targets (Bourne, 2014). Knowledge of the role of these nodes for induction of biofilm formation and antibiotic tolerance is important for exercising caution for their use in antimicrobial therapeutics.
Conclusions
A systems biology approach was used to construct a PPIN to study the stress response mechanisms in bacteria using E. coli as a model. This approach allowed us to obtain a systems' overview of the phenomenon and to identify the central pathways and proteins. Notably, the generated network is compositionally different from the E. coli proteome, even though it constitutes a large fraction of it. The comparison with the entire proteome PPIN and CS-PPIN show that the network generated has strong biological significance, and that the results inferred have sound biological meaning.
The SR-PPIN had twenty-four central proteins (sixteen of which have well-documented roles in stress response phenomena). The roles of Adk, FliC, PykA, GlyA, Eda, and AldA need to be further investigated. GO analysis, cluster analysis, and pathway annotation showed that energy and substrate metabolism, and the translational machinery are important features of the SR-PPIN. Analysis of the network pathways showed that TCS, which are important sensory elements, are strongly involved in relaying a stress-associated signal to other pathways. The TCS emerges as the central pathway for coordination of multiple metabolic pathways, flagellar biosynthesis, and ABC transporter pathways (Fig. 3). The results obtained by pathway, GO, and cluster analysis of the SR-PPIN were compared with those listed in several recent authoritative reviews and were found to be similar to those obtained from previous studies.
Central stress responses are also likely to be responsible for the observed cross-protection conferred by varied stressors. Thus, a network was generated from an independent RNA-seq study of cross-protection. Interestingly, the central proteins, pathways, and GO terms from the SR-PPIN coincided with those of the cross-protection network. Our results show that during stress response, a few key proteins are responsible for driving the changes globally across all stress responses in E. coli, and are also the key regulators of cross stress protection. The results with the ontologies for biofilm formation and response to antibiotics indicate possible key triggers in initiating these stress-associated responses and should be further elucidated.
Identification of central proteins pathways and processes of stress response in model organisms can enable and empower us to identify similar mechanisms in pathogenic organisms. Further, drug targets that disrupt the stress response can be exploited to combat antibiotic tolerance and multidrug resistance.
Footnotes
Acknowledgments
This work was supported by the Indian Council for Medical Research (ICMR) research grant No. 64/5/2011-BMS. SJ acknowledges financial support from ICMR.
Author Disclosure Statement
No competing financial interests exist.
Abbreviations Used
References
Supplementary Material
Please find the following supplemental material available below.
For Open Access articles published under a Creative Commons License, all supplemental material carries the same license as the article it is associated with.
For non-Open Access articles published, all supplemental material carries a non-exclusive license, and permission requests for re-use of supplemental material or any part of supplemental material shall be sent directly to the copyright owner as specified in the copyright notice associated with the article.