
Abstract
Abstract
Pancreatic ductal adenocarcinoma (PDAC) is one of the rapidly growing forms of pancreatic cancer with a poor prognosis and less than 5% 5-year survival rate. In this study, we characterized the genetic signatures and signaling pathways related to survival from PDAC, using a parsimony phylogenetic algorithm. We applied the parsimony phylogenetic algorithm to analyze the publicly available whole-genome in silico array analysis of a gene expression data set in 25 early-stage human PDAC specimens. We explain here that the parsimony phylogenetics is an evolutionary analytical method that offers important promise to uncover clonal (driver) and nonclonal (passenger) aberrations in complex diseases. In our analysis, parsimony and statistical analyses did not identify significant correlations between survival times and gene expression values. Thus, the survival rankings did not appear to be significantly different between patients for any specific gene (p > 0.05). Also, we did not find correlation between gene expression data and tumor stage in the present data set. While the present analysis was unable to identify in this relatively small sample of patients a molecular signature associated with pancreatic cancer prognosis, we suggest that future research and analyses with the parsimony phylogenetic algorithm in larger patient samples are worthwhile, given the devastating nature of pancreatic cancer and its early diagnosis, and the need for novel data analytic approaches. The future research practices might want to place greater emphasis on phylogenetics as one of the analytical paradigms, as our findings presented here are on the cusp of this shift, especially in the current era of Big Data and innovation policies advocating for greater data sharing and reanalysis.
Introduction
P
Standard therapy for around 20% of PDAC patients with localized disease is surgery, which is not proper for the remaning 80% of PDAC patients with either locally advanced or metastatic disease. However, around 30% of PDAC patients have a 5-year survival rate with surgery (Jemal et al., 2010). In addition, localized PDAC patients receiving a combination of gemcitabine- and 5-fluorouracil-based cytotoxic chemotherapy agents experience 3 months more surival rate than receiving each drug separately (Matano et al., 2000). Apart from conventional chemotherapy, targeted therapeutic approaches have not been proven to produce robust clinical outcomes in PDAC patients except for erlotinib, which is the first approved targeted therapy that selectively inhibits the EGFR tyrosine kinase (Kang and Saif, 2008; Moore et al., 2007). This is also caused by the fact that asymptomatic and/or subclinical disease states, together with the wide variety of clinical subtypes, are characterized by inter- and intraindividual genotypic and phenotypic heterogeneity that commonly delays an accurate clinical diagnosis (Biankin et al., 2012; Cowley et al., 2013; Jones et al., 2008).
Advanced-stage genomic and gene expression analysis technologies have been applied to better understand the PDAC tumorigenesis and identify the targetable biomarker signatures (Tsang et al., 2016). The heterogeneity of high-throughput data revealed by those improved genomic technologies makes mining and interpretation of PDAC difficult. Alterations in p16/CDKNA2, K-ras, DPC4/Smad4, and TP53 were previously shown to characterize 95%, 82%, 55%, and 50–70% different stages of PDAC, respectively (Hahn et al., 1996; Moore et al., 2001; Redston et al., 1994; Schutte et al., 1997). Pathways of these altered genes included K-ras, TGF-beta, WNT/Notch, Hedgehog, and DNA repair pathways (Jones et al., 2008).
In this study, we used a systems biology approach called “parsimony phylogenetics,” which is dedicated to the analysis of “molecular heterogeneity” in various diseases. The poor prognosis and/or delayed diagnosis have been assigned primarily to the genomic diversity and/or heterogeneity of PDAC, which hinder the discovery of primary biomarker targets. Parsimony phylogenetics is an evolutionary analytical method that has been applied to mass spectrometry data of cancer (Abu-Asab et al., 2006, 2013), gene expression of various diseases (Abu-Asab et al., 2008a, 2011; Azzone, 1996; Sarnat and Netsky, 1984), vaccine analysis (Abu-Asab et al., 2010), and systematics biology of taxa (Wiley and Lieberman, 2011). Utilization of parsimony phylogenetics uncovers clonal (driver) and nonclonal (nonexpanded or passenger) aberrations (Abu-Asab et al., 2013), which are needed for the detection of biomarkers. In this study, to identify PDAC survival-associated genetic signatures and signaling pathways, we applied this analytical paradigm of systems biology to whole-genome in silico array analysis of gene expression in 25 early-stage human PDAC specimens.
Subjects and Methods
Study population and data set
Gene expression data set GSE32688 was downloaded from Gene Expression Omnibus (www.ncbi.nlm.nih.gov/geo/query/acc.cgi?acc=GSE32688), which included 25 early-stage human PDAC samples (Donahue et al., 2012). At the time of study, 16 patients were reported to have recurrent disease with a median DFS (disease-free survival) of 13.3 months, and 10 of them had died of disease with a median DSS (disease-specific survival) of 20.6 months. Due to the number of deaths and relatively short follow-up time (median 12.4 months for survivors), Donahue et al. (2012) made the survival analysis according to DFS as the outcome measure. Since the group aimed to clarify genomic alterations and expression changes in neoplastic ductal epithelial cells, they only included primary tumor samples. They first performed initial unsupervised clustering of microarrays; compared mRNA expression with normal tissues with low tumor cell content (<30%); and then decided to choose the samples according to tumor cell content, which is above 30% (median 60%, ranging from 35% to 90%).
Parsimony phylogenetic analysis
Our phylogenetic analysis encompassed two steps: polarity assessment of gene expression values followed by processing with parsimony program. Gene expression data values were polarized using the normal specimens of the same data set and coded into derived (abnormal) and ancestral (normal) states using Omicstract program (our inhouse software that is freely available from http://omicstract.phylomics.com/) (Salazar et al., 2015). Polarity assessment was done by comparing the values of the cancer specimens against the range of the control healthy biopsies for all genes. Then, hierarchical classification of specimens onto a cladogram through parsimony phylogenetic program of the polarized data (using MIX of PHYLIP package [http://evolution.genetics.washington.edu/phylip.html]) was performed (Abu-Asab et al., 2008b).
Statistical analyses
The Wilcoxon–Mann–Whitney U test was used for two-group comparison. False discovery rate adjusted p values were calculated. Cutoff of 0.25 was used for statistical significance.
Results
Parsimony phylogenetic analysis
The parsimony program, MIX, produced only one most parsimonious cladogram (Fig. 1). The cladogram classified the 25 patients into 11 clades (red), in which clades 1, 2, 5, 6, 7, 9, 10, and 11 fell into subclades each defined by a number of synapomorphies (a shared derived gene expression value compared to normal specimens in the phylogenetic terminology). In the cladogram, we matched times to death (ranking) together with their stages of tumor for every patient. In contrast to Donahue et al., parsimony phylogenetics showed lack of correlation between these two parameters for all genes.
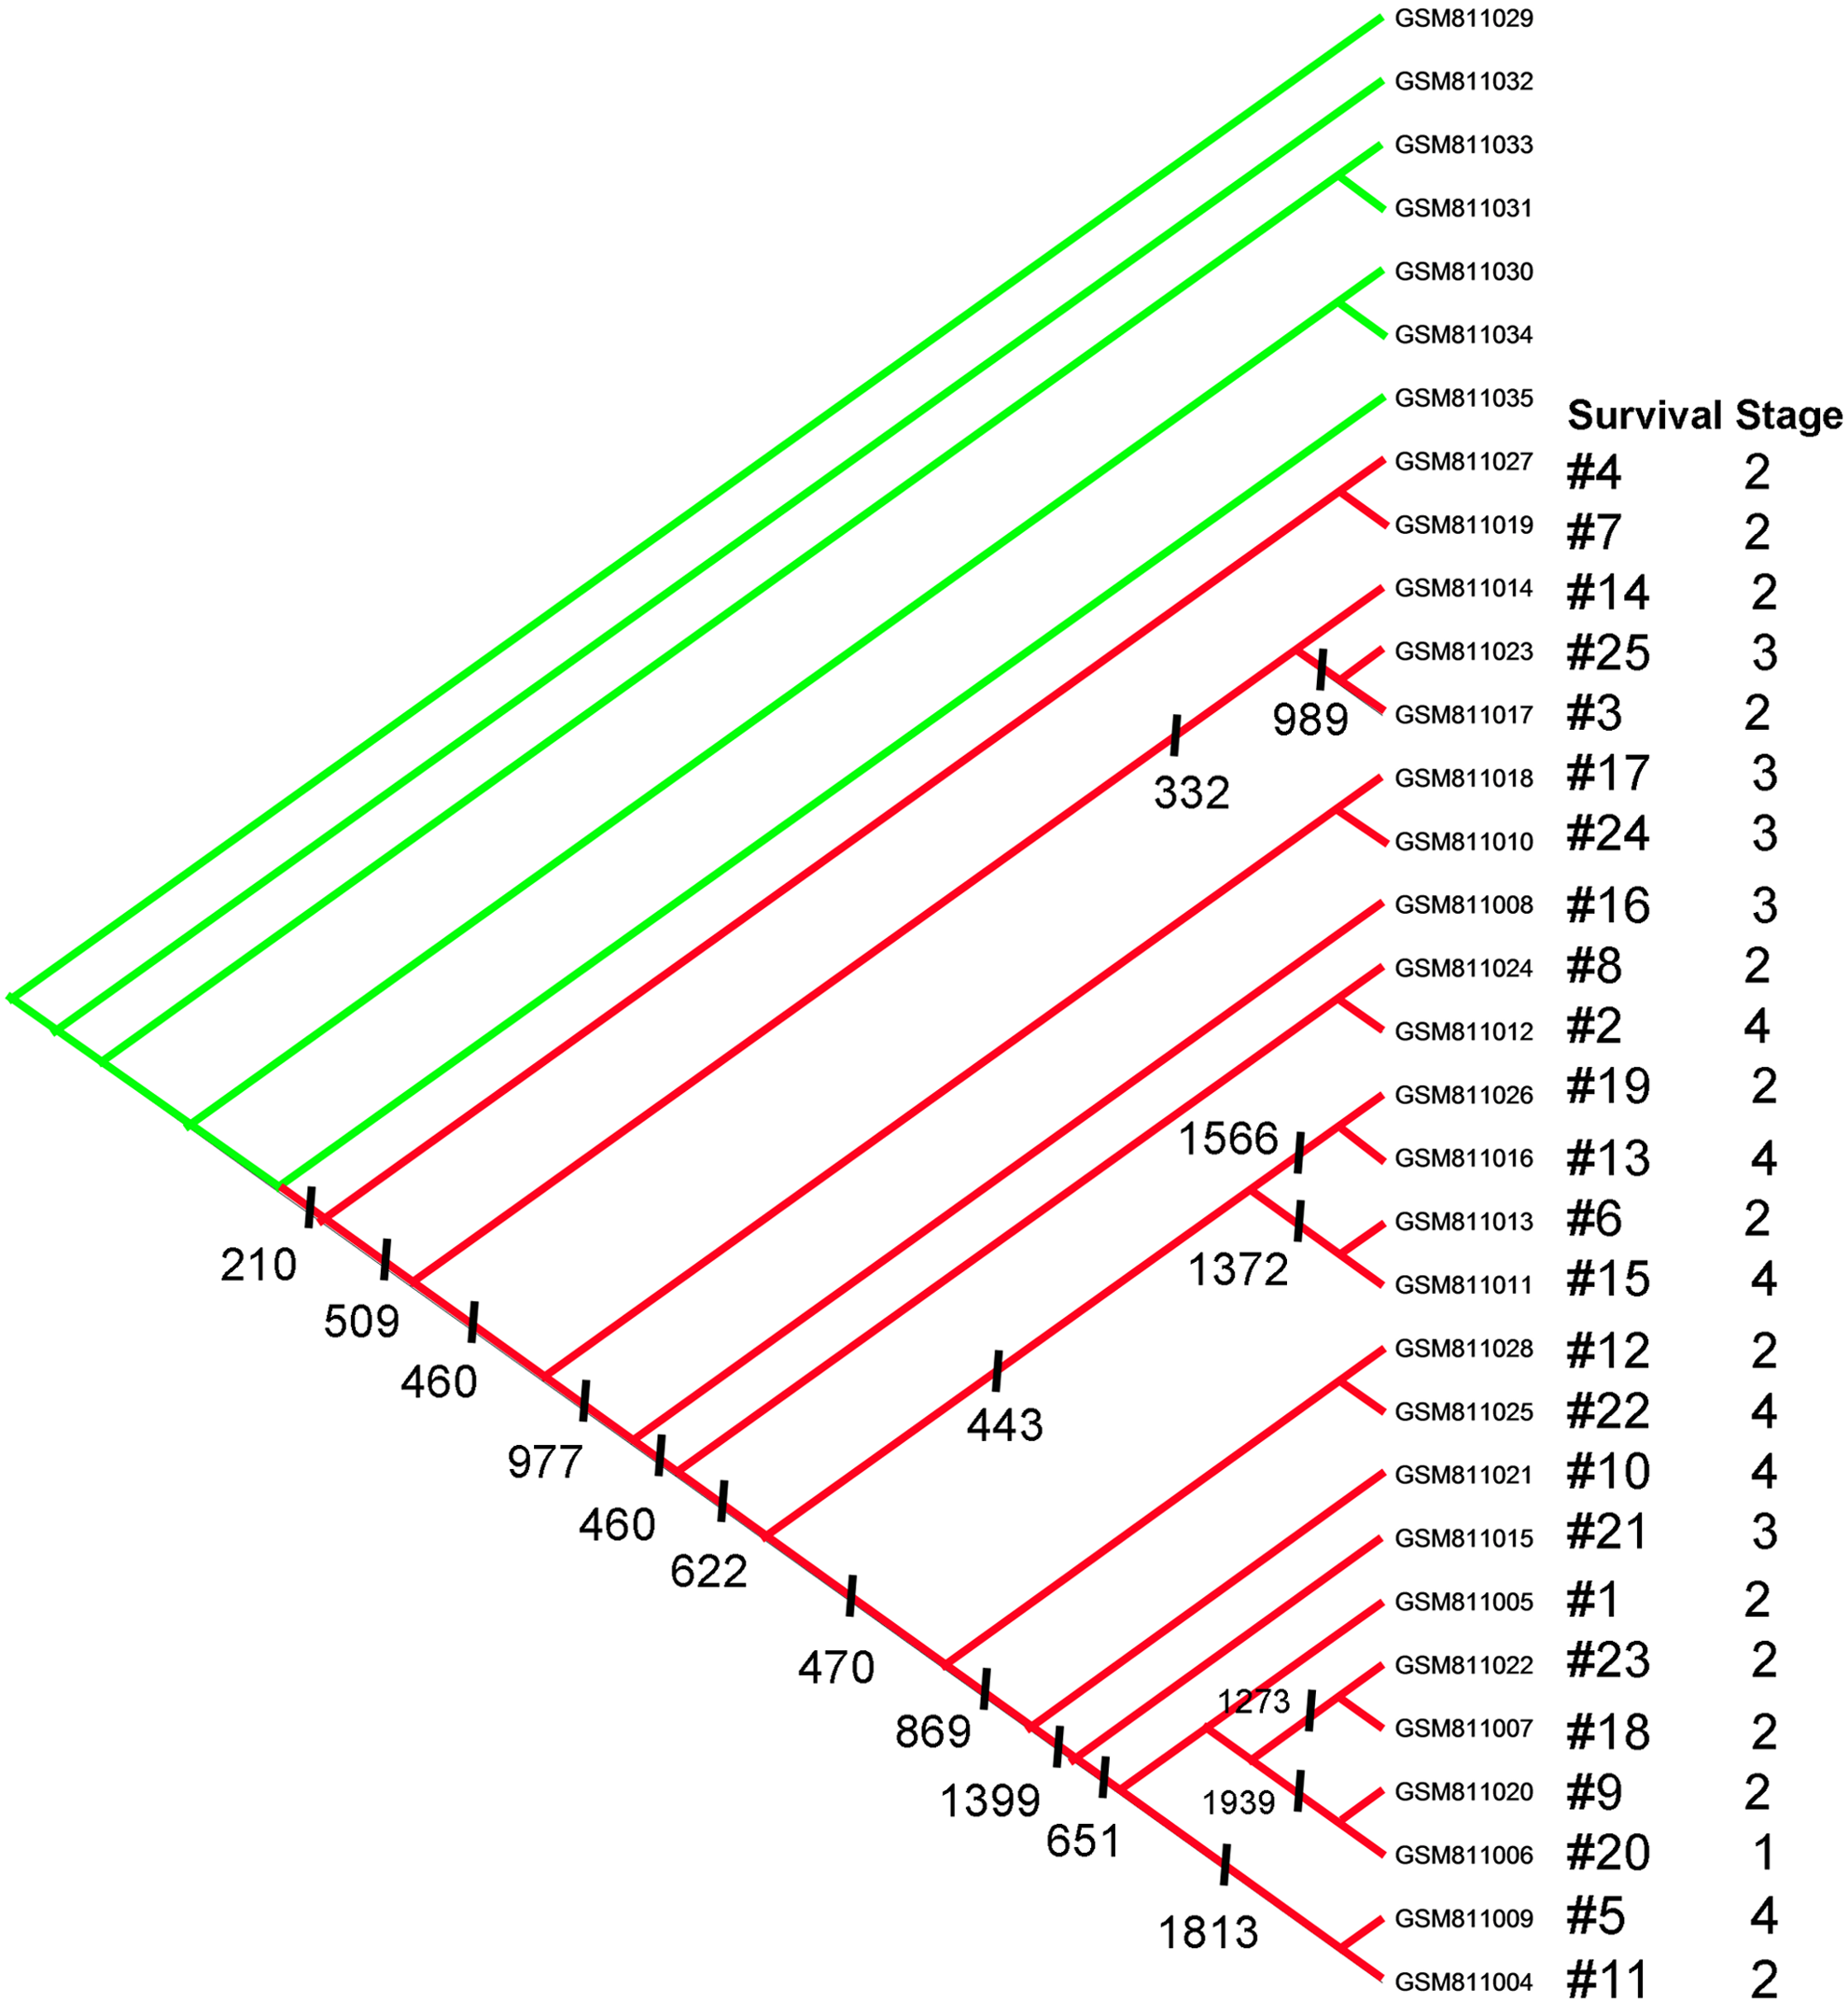
The cladogram classified the specimens of the 25 PDAC patients into 11 clades, each defined by a number of synapomorphies (shared derived gene expression aberration compared to normal specimens) denoted on the cladogram by a vertical bar and a number. On the right side of the cladogram, times to death (survival ranking) were matched with the stages of tumor for every patient. Green colored nodes are the healthy specimens. PDAC, pancreatic ductal adenocarcinoma.
Subsequently, shared genes with abnormal gene expression value (termed synapomorphies in phylogenetic vocabulary) for each clade were identified from the nodes of the cladogram. The number of synapomorphies for each clade is denoted below the clades' nodes with a vertical bar and the number of synapomorphies (Fig. 1).
We extracted gene list of the nodes. Genes listed are the genes that showed significant changes (there may be exceptions) (assigned “1”s by polarity assessment). For example, as seen on the cladogram (Fig. 1), there are 210 genes listed at node 7→17, which means that these genes had significant changes in the 25 patients of the clade. At node 22→17, 509 genes changed significantly in 23 of the 25 patients except GSM811027 and GSM811019.
Statistical analysis
The Wilcoxon–Mann–Whitney U test was performed for each gene to find out if their expressions were correlated with survival times (ranking No. 1–25) of the patients. There was no statistically significant correlation between survival times and gene expression values of any specific gene, that is, the survival rankings are not significantly different between patients for any specific gene (p > 0.05).
Discussion
Although a significant amount of high-throughput data have been generated from whole-exom and whole-genome sequencing as well as microarrays, there are still incongruencies in the analyses and interpretations of such data. These difficulties can be attributed to the remarkable genomic heterogeneity of PDAC combined with a usually small size of patient cohorts, which have restricted the effective and efficient mining of the data. In particular, lack of targeted molecular agents for the significantly altered genes in PDAC call into question the effectiveness of some of the applied methods of data analysis, and indicate the importance of using approaches that are suitable for dealing with patient heterogeneity and the subtyping of patient population (Boeck et al., 2013; Kindler et al., 2011; Moore et al., 2007; Van Cutsem et al., 2004, 2009). Evolution-based biomedical constructs, including parsimony phylogenetics, have been shown to be a suitable tool for dealing with heterogeneous and high-dimensional data such as gene expression microarray (Abu-Asab et al., 2008b, 2011; Abu-Asab et al., 2013; Sarnat and Netsky, 1984; Wiley, 1981).
Important contributions of evolution compatible phylogenetic studies are available in the biology literature (Felsenstein, 2004; Hennig, 1966). A parsimony phylogenetic program classifies the specimens onto one or more most parsimonious cladogram (Azzone, 1996). An analysis result of only one most parsimonious cladogram is a positive indicator that the data set is free of experimental artifacts and batch problems; such a result was obtained in our parsimony analysis (Fig. 1). This systems biology strategy when applied to PDAC gene expression data allows the stratification of PDAC patients and the identification of subtypes despite the considerable heterogeneity among the specimens (Abu-Asab et al., 2006, 2008b, 2010, 2011, 2013). The classification strategy is based on grouping specimens into clades sharing gene expression aberrations—the synapomorphies, thus uncovering clonal (driver) and nonclonal (nonexpanded or passenger) aberrations (Abu-Asab et al., 2013; Desper et al., 2004); the former are the potential biomarkers. Accordingly, and after identifying the shared aberration of every patient clade, we found no correlation between the gene expression data and survival in PDAC.
The remarkable result shows no correlation between stages and survival times. Stage 4 that ranked 2 (No. 11012) and stage 4 that ranked 22 (No. 11025) together with stage 3 that ranked 25 (No. 11023) and stage 2 that ranked 1 (No. 11005) were absolutely showing the involvement of different genes and pathways or same genes but different pathway combinations. Those results did not confirm the conclusions of the study by Donahue et al. (2012), who identified worse prognosis associated with expression of EGFR, a potential activator of both PI3K/AKT and SRC signaling, while that of CBL, a ubiquitin ligase able to negatively impact EGFR or SRC expression, correlated with improved survival, which is contrary to the study by Ueno et al. (2009) that examined EGFR expressions and mutations in advanced pancreatic cancer and concluded that they were not correlated with survival. Later on, Boeck et al. (2013) confirmed Ueno's results in some aspect analyzing tissue biomarkers in pancreatic cancer patients treated with the anti-EGFR agent erlotinib, and showed that K-ras wild-type status was associated with improved overall survival, while no significant correlation was found for EGFR-immunohistochemical analysis, EGFR-FISH, PTEN-immunohistochemical analysis, intron 1 or exon 13 R497K polymorphism.
Our results support the need for a systems approach with high concordance fidelity in the analysis of high-throughput data of PDAC especially when various published studies differed on the significant genes that were correlated with survival. Alterations in p16/CDKNA2, K-ras, DPC4/SMAD4, and TP53 were previously shown to characterize 95%, 82%, 55%, and 50–70% of the four stages of PDAC, respectively (Hahn et al., 1996; Moore et al., 2001; Redston et al., 1994; Schutte et al., 1997).
Investigations regarding the prognostic and survival gene expression patterns have been increasingly reported owing to survival variations among clinical stages, selection of the derivation patient set, and large genomic heterogeneity within PDAC tumors (Donahue et al., 2012; Jones et al., 2008; Kim et al., 2007).
Jones et al. (2008) identified significantly altered 69 genomic changes linked to 12 basic signaling pathways at low frequencies and high prevalence in global genomic analyses of PDAC. Genes with high prevalance were detected as K-ras, TP53, and SMAD4. However, only SMAD4-associated PDAC had a better survival outcome (Blackford et al., 2009; Jones et al., 2008). In addition, SMAD3 regardless of SMAD4 status was found to be a potential biomarker of poor prognosis involving shorter times to recurrence and shorter survival times after surgery (Yamazaki et al., 2014).
Recently, Kadera et al. (2014) involving the Donahue TR study group proved that SMAD4 protein loss was significantly correlated with survival by multivariate Cox proportional hazard modeling (Kadera et al., 2014). Stratford et al. (2010) identified SIGLEC11, KLF6, NFKBIZ, ATP4A, GSG1, and SIGLEC-11 genes (a six-gene signature) based on high- and low-risk patient groups (n = 67) and correlated their results to both metastatic disease and shorter survival in primary tumors (Stratford et al., 2010). Thereupon, Newhook et al. (2014) reported a more comprehensive study with a prognostic 13-gene expression signature based on overall survival for patients with stage I to IV disease, which is inconsistent to Stratford's 6-gene prognostic signature candidate genes. The difference between the two reports was documented as the signature was derived from tumor stage at presentation, which is different from the later study that derived from patient survival. Identified genes, including CCDC88C, CD200R1, CUL3, CDH5, TGFA, ELAVL1, MDM2, MS4A3, FAM80B, LOC149134, PLCG1, PRKCSH, and ULBP3, involved in MAPK, VEGF, Mtor, and ERBB signaling pathways. These findings were different from another study that identified higher expression of ITGA5, SEMA3A, KIF4A, IL20RB, SLC20A1, CDC45, PXN, SSX3, and TMEM26 genes associated with shorter survival, and B3GNT1, NOSTRIN, and CADPS lower expression associated with poor outcome (Haider et al., 2014).
Gong et al. (2014) analyzed the high-dimensional microarray data of pancreatic cancer patients with localized and resected PDAC using doubly regularized Cox regression model, and identified and verified the following pathways and genes to be directly correlated to pancreatic cancer survival: DENND4A, KLF13, zinc finger protein family genes (ZNF229, ZNF233, ZNF395, and ZNF432), immune phagocytosis pathway (CYBA), SLC family (SLC22A8, SLC8A3, SLC24A6), TRP (Ca2+) ion transport pathway (TRPV5, TRPM6), KCNK (K+) ion transport pathway (KCNK3, KCNK18), and TGFb core pathway (spermatogenesis signaling set PCYT1B gene).
The discordance of results persists in more recent studies. Donahue et al. (2012) showed several additional prognoses-associated genes linked to both SRC signaling and the PI3K/AKT pathways, and concluded that pathways of high survival included ERBB signaling, apoptosis, purine metabolism, focal adhesion, and insulin signaling (several of which are linked by EGFR) in comparison with the previous data that underscored ERBB, focal adhesion, insulin signaling, and MAPK pathways (Donahue et al., 2012; Tobita et al., 2003; Ueda et al., 2004). Later on, they also highlighted the critical PI3K pathway activation for the onset and progression in mice with K-ras activation and Pten deletion (Hill et al., 2010). Furthermore, they reported that rather than EGFR itself, one should consider EGFR downstream signaling networks (PI3K–AKT–PTEN and RAS–MAPK–MEK–ERK cascade) to identify promising prognostic and/or predictive biomarkers.
Singh et al. (2009) reported that human PDAC cells resistant to K-ras inhibition were strongly correlated with the molecular heterogeneity in PDAC. This in vitro finding highlights that K-ras inhibition cannot be clinically targeted in all the PDAC patients due to its significant variation between K-ras-driven tumor types, which is consistent with the latest K-ras studies. While some studies concluded the absence of correlation between K-ras and overall survival (Da Cunha Santos et al., 2010), others declared K-ras as a prognostic biomarker in pancreatic cancer (Chen et al., 2010; Lee et al., 2007; Ogura et al., 2013), which is also in contrast to another retrospective study suggesting K-ras as a predictive marker for erlotinib efficacy rather than a prognostic factor (Kim et al., 2011). Although K-ras has been one of the triggers in PDAC, drugs that target K-ras have not been effective to date. Therefore, further research is urgently needed to find out the driving molecular mechanisms in PDAC to design new therapeutic targets. Current work is still on going in the field to understand mechanisms of resistance to K-ras inhibitors in K-ras-driven signaling networks of cancers. Zhang et al. (2014) recently showed, in PDAC cell culture and in mice, that Yap which functions as the transcriptional promotion of the gene expression in MAPK pathway is required for proliferation of mutant K-ras or K-ras:Trp53, and progressively forms invasive PDAC.
Our current analysis is the first to infer PDAC patient survival-associated genetic signatures using a parsimony phylogenetic algorithm; included an evolutionary approach to the development of a robust classification model and the mining of clonal genes in PDAC and subtypes. We did not observe any phylogenetically significant association between any gene expression and the survival of PDAC patients, and between gene expression and tumor staging. Meanwhile, statistical analyses also did not support any correlation between gene expression and survival.
Conclusions
While we were unable to identify in this relatively small sample of patients a molecular signature associated with pancreatic cancer prognosis, we suggest that future research and analyses with the parsimony phylogenetic algorithm in larger and independent patient samples are worthwhile, given the devastating nature of pancreatic cancer and lack of robust diagnostics for its early diagnosis and prognostication. Discovery of early events of tumorigenesis and survival-associated genetic signatures will help to better understand tumor initiation, early detection, and design of effective treatments at all phases of tumor progression.
Footnotes
Acknowledgment
S.N. was funded by a grant from the Scientific and Technological Research Council of Turkey.
Author Disclosure Statement
The authors declare that no conflicting financial interests exist.