
Abstract
Abstract
Neurodegenerative diseases such as Alzheimer's disease (AD), Parkinson's disease (PD), and amyotrophic lateral sclerosis (ALS) lack robust diagnostics and prognostic biomarkers. Metabolomics is a postgenomics field that offers fresh insights for biomarkers of common complex as well as rare diseases. Using data on metabolite-disease associations published in the previous decade (2006–2016) in PubMed, ScienceDirect, Scopus, and Web of Science, we identified 101 metabolites as putative biomarkers for these three neurodegenerative diseases. Notably, uric acid, choline, creatine, L-glutamine, alanine, creatinine, and N-acetyl-L-aspartate were the shared metabolite signatures among the three diseases. The disease-metabolite-pathway associations pointed out the importance of membrane transport (through ATP binding cassette transporters), particularly of arginine and proline amino acids in all three neurodegenerative diseases. When disease-specific and common metabolic pathways were queried by using the pathway enrichment analyses, we found that alanine, aspartate, glutamate, and purine metabolism might act as alternative pathways to overcome inadequate glucose supply and energy crisis in neurodegeneration. These observations underscore the importance of metabolite-based biomarker research in deciphering the elusive pathophysiology of neurodegenerative diseases. Future research investments in metabolomics of complex diseases might provide new insights on AD, PD, and ALS that continue to place a significant burden on global health.
Introduction
N
AD, being the most prevalent neurodegenerative disease, is the best known source of dementia, especially the adult-onset dementia (Ferri et al., 2006; Paglia et al., 2016), and it may contribute to 60–70% of cases (WHO, 2016). It is estimated that more than 80 million people will be suffering from this disease until 2040 (Cornutiu, 2015). AD is a complex and progressive disorder. The formation of intraneuronal neurofibrillary tangles and extracellular amyloid plaques are the two histopathological signatures of the AD (Bloom, 2014; Multhaup et al., 2015; Paglia et al., 2016).
The second most common neurodegenerative disorder is PD (Tahmasian et al., 2015). Hereditary and environmental factors play important roles in the development of PD (Delenclos et al., 2016; Hatano et al., 2016). In addition, aging is an important risk factor for disease development (Rodríguez-Nogales et al., 2016). It was estimated that 2% of the population with PD are older than 65 (Ghio et al., 2016). Hence, the percentage of aged people in the general population is increased gradually, with PD becoming a major global health burden (Delenclos et al., 2016). There are two main clinical findings of PD: (1) a progressive loss of dopaminergic neurons in the substantia nigra (S. Nigra) pars compacta located in the midbrain, and (2) aberrant aggregation and folding of the α-synuclein protein, which creates inclusions (known as Lewy bodies) that cause neuronal dysfunctions in the influenced brain areas (Ghio et al., 2016; Hatano et al., 2016). Apart from tremor, patients may experience bradykinesia, disorders of speech, swallowing, sleep, and cognition (Andalib et al., 2014).
ALS is another neurodegenerative disease lacking robust diagnostics. ALS is characterized by degeneration of upper and lower motor neurons in the brain, brainstem, and spinal cord, usually leading to death in about 2–5 years of onset. ALS pathophysiology is not clearly understood, because multiple mechanisms are associated with the motor neuron death, including mitochondrial dysfunction, oxidative stress, glutamate toxicity, apoptosis, and aggregation of misfolded proteins (Chio et al., 2013; Mitchell et al., 2009). Phenotypic heterogeneity and lack of diagnostic biomarkers pose difficulties in establishing the diagnosis in very early stages. Indeed, the interval time between the appearance of first symptoms and the diagnosis is more than 1 year and often, it is greater (Blasco et al., 2015, 2016).
Collectively, degenerative diseases of the nervous system pose substantial global health burdens on populations worldwide. The prevalence and incidence of these diseases rise dramatically with age; thus, the number of cases is expected to increase for the foreseeable future, as life spans in many countries continue to increase. Although there has been considerable progress with respect to understanding the triggers of neurodegenerative diseases, causal contributions from genetic and environmental factors are, with some exceptions, poorly understood. Here, the importance of early diagnosis comes into prominence. One of the most important techniques used for detection of biomarkers for diagnosis of neurodegenerative diseases is metabolic profiling or the field of metabolomics.
Metabolomics is an emerging specialty of postgenomics inquiry that examines the global changes in metabolites and metabolic networks underpinning common complex disease pathogenesis and/or mechanisms of host–environment interactions with a view to precision medicine. Metabolomics has found recent broad applications in both preclinical and clinical research (Embade et al., 2016; Kim et al., 2011; Lindeque et al., 2015; Lopes et al., 2015). The metabolome, one of the end products of gene-environment interactions immediately upstream to their phenotypic impacts, can help characterize and discriminate pathophysiological signatures of AD (Sapkota et al., 2015), PD (Hatano et al., 2016), and ALS (Blasco et al., 2016). Still, only a limited number of target molecules are associated with neurodegenerative disease pathogenesis or prognosis (Blasco et al., 2010, 2016; Sussmuth et al., 2008; Tumani et al., 2008).
The present research was undertaken by using pathway enrichment analysis to evaluate the proposed metabolic biomarkers of three common neurodegenerative diseases noted earlier, and to discern the similarities and differences of their molecular signatures from a systems perspective, also analyzing the significantly altered metabolic pathways.
Materials and Methods
Data curation
A comprehensive literature search was performed for the hitherto proposed metabolic biomarkers of AD, PD, and ALS through electronic searches including PubMed, ScienceDirect, Scopus, and Web of Science. The studies to be included in the analyses were selected in accordance with the following criteria: (1) The articles must have been published within the previous decade (since 2006); (2) the studies must be published as a review article or an original research paper, including low-throughput experimentation in human blood (serum, plasma), urine, cerebrospinal fluid (CSF), or S. Nigra; and (3) the studies must investigate the association between metabolites and the investigated disease(s).
A literature search with the criteria mentioned earlier resulted in a total of 101 metabolites that were proposed as biomarkers for the three neurodegenerative diseases. In each case, the following set of data were extracted: the name and Kyoto Encyclopedia of Genes and Genomes (KEGG) compound ID of the metabolite, associated disease, the alteration in the expression pattern of the metabolite, the sample type used, the experimental method performed throughout the analysis, and the citation (first author and date) of publication.
Comparative analyses
To find similarities and differences of disease signatures at metabolome level, all possible comparisons were performed and results were represented by Venn diagrams via Jvenn, an interactive Venn diagram viewer (Bardou et al., 2014). In addition, to evaluate any possible correlation between the expression patterns of the metabolites, a heat map was constructed.
Pathway enrichment analyses of metabolites
Statistically significant metabolic pathways associated with proposed metabolic biomarkers were elucidated through metabolites biological role (MBRole), which performs an overrepresentation (enrichment) analysis of categorical annotations (pathways, biological roles, enzyme interactions, diseases, etc.) for a set of compounds of interest (Chagoyen and Pazos, 2011). The KEGG database was used as the annotation source, the KEGG compound ID's of metabolites were used as input, and significantly enriched (p < 0.05) metabolic and signaling pathways were identified. A hypergeometric test was employed to evaluate the significance of the enrichments:
where N is the total number of metabolites, K is the total number of metabolites associated with the pathway, n is the number of metabolites in the set, and k is the number of pathway-associated metabolites in the set. The p values were corrected by using the Benjamini–Hochberg method.
Construction of disease-metabolite-pathway associations
Disease-metabolite and metabolite-pathway associations were constructed through literature survey and pathway enrichment analyses, respectively. These analyses then led to the coupling of diseases with metabolic pathways. In addition, for each disease, linkages between metabolic pathways were constructed by using shared metabolites. Here, we assumed that (1) if two pathways share at least one common metabolite (associated with the inspected disease), they should be linked, and this linkage may be associated with disease; and (2) if the number of common metabolites increases, the significance of the linkage increases as well. With regard to these assumptions, the pathway interaction graph was constructed by using Cytoscape (Shannon et al., 2003) for each disease. The topological analysis of the graphs was performed by using CytoHubba plugin (Smoot et al., 2011), and degree metrics were used to define the significance of nodes in the graph. In visualization, node color and size expressed the p value significance and pathway impact, respectively. Colors with sliding through light to dark gray showed increased statistical significance, whereas larger circle diameters corresponded to higher degree values.
Results
We identified a total of 101 metabolites that were proposed as biomarkers for the three neurodegenerative diseases. These included 58, 54, and 46 metabolites for AD, PD, and ALS, respectively (Table 1).
AD, Alzheimer's disease; ALS, amyotrophic lateral sclerosis; CSF, cerebrospinal fluid; KEGG, Kyoto Encyclopedia of Genes and Genomes; PD, Parkinson's disease; PMV, post-mortem ventricular; S. Nigra, substantia nigra.
The majority of the biomarkers belonged to acids (31%, 32 metabolites), and amino acids and their derivatives (24%, 25 metabolites) categories (Fig. 1). Apart from these, 6 lipids (including sphingolipids and fatty acids), 6 neurotransmitters (such as dopamine and norephinephrine), 6 alkoloids (including caffeine, betaine, and xanthine derivatives), 6 alcohols (such as glycerol, inositol, and sorbitol), and 20 other metabolites, including amines, vitamins, carbohydrates, ketones, and cholesterols, were proposed as metabolic biomarkers for three neurodegenerative diseases.
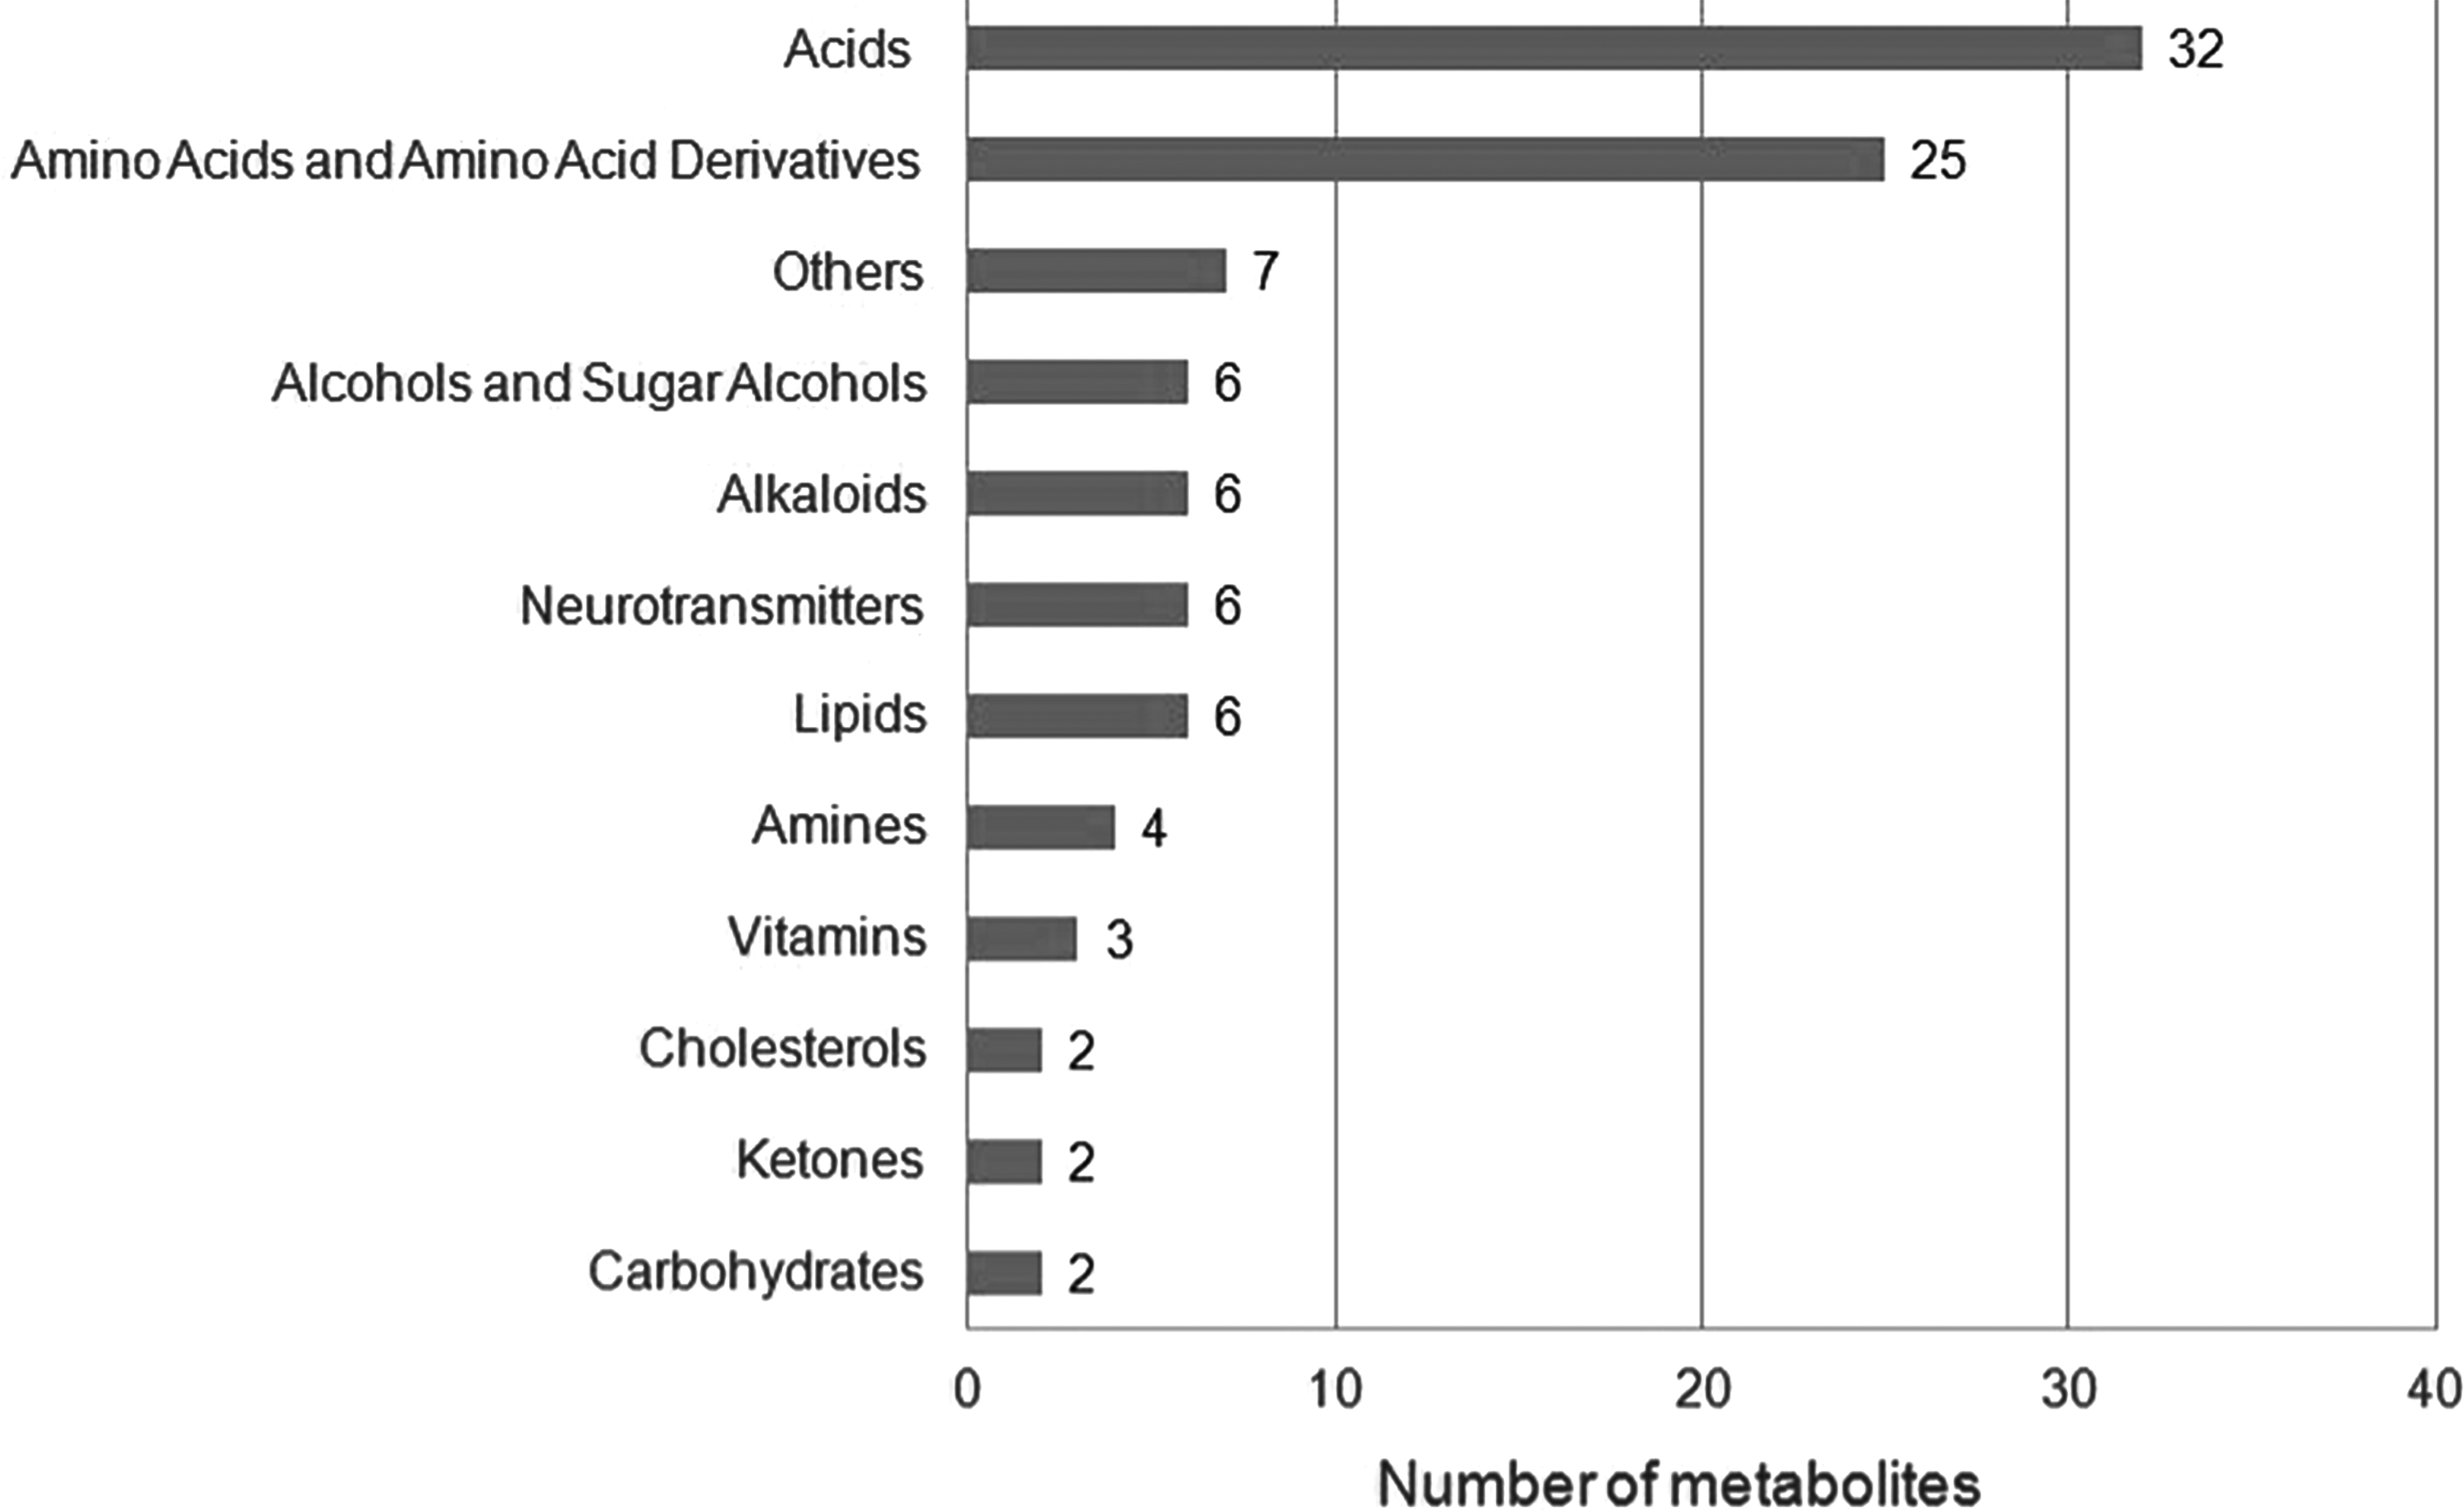
Distribution of metabolic biomarkers in biochemical categories.
These metabolites were detected in six different fluids: plasma, serum, CSF, post mortem ventricular (PMV)-CSF, urine, and S. Nigra. Different detection techniques (mostly, gas or liquid chromatography coupled with mass spectrometry) were employed in analyses (Table 1).
Six acids (urate, lactate, oxaloacetate, pentothenate, 2-hydroxybutyrate, and 3-phenylpropionate), five alkaloids (caffeine, paraxanthine, theobromine, theophylline, and betaine), two lipids (1-palmitoleoylglycerophosphocholine and stearoyl sphingomyelin), homocysteine, amine, mannose, and riluzole were determined in plasma of patients having ALS disease (Lawton et al., 2014; Zoccolella et al., 2008). Among those, amine and lactate, as well as the amino acids, phenylalanine and tyrosine, glucose, acetone, and inositol were determined in CSF of ALS patients (Blasco et al., 2015; Gray et al., 2015; Toczylowska et al., 2013). Besides CSF and plasma, lactate was determined in serum of patients having ALS disease (Botosoa et al., 2012; Lawton et al., 2014). Ketone, acetone, formate, beta-hydroxybutyrate, and N-acetyl derivatives were also determined in serum of ALS patients (Kumar et al., 2010).
As for AD, the lipids, sphinganine-1-phosphate and lysophosphatidylcholine (2-lysolecitine), together with pipecolic acid and adenosine were determined in serum of patients (González-Domínguez et al., 2015; Liang et al., 2016; Voyle et al., 2016).
Three acids (4-hydroxyphenyllactic acid [4-HPLA], 2-hydroxyphenylacetic acid [2-HPA], vanillylmandelic acid [VMA]), two amino acids (cysteine and beta-alanine), xanthine, and uridine were determined in CSF of AD patients (Kaddurah-Daouk et al., 2013; Trushina and Mielke, 2014). Besides CSF, two amino acids, cysteine and beta-alanine, were also found in plasma of AD patients (Trushina and Mielke, 2014). The neurotransmitters, norephinephrine (noradrenaline) and 3-methoxytyramine, and the amino acid, 5-hydroxytryptophan, were determined in PMV-CSF (Trushina and Mielke, 2014). Anandamide and desmosterol were found in plasma, whereas 5-L-glutamylglycine (5-L-glutamyl-L-cysteinylglycine) was found in urine of AD patients (Cui et al., 2014; Sato et al., 2012; Voyle et al., 2016).
Eight acid salts (suberate, glutarate, malate, succinate, gluconate, methylmalonate, glycolate, and citrate), four alcohols (sorbitol, glycerol, propylene glycol, and galacticol), three amines (methylamine, trimethylamine, and ethanolamine), there amino acids (proline, cysteine, and glutamic acid), the threonate vitamin, lipid hydroperoxides (LOOH), malondialdehyde (MDA), superoxide dismutase (SOD), and 2-oxoisocaproate were detected in plasma of PD patients (Ahmed et al., 2009). The amino acids, isoleucine, arginine, and asparagine, as well as fatty acids were found in serum (Ahmed et al., 2009; González-Domínguez et al., 2014a, 2014b). In addition, asparagine was also determined in CSF of PD patients together with the 3-hydroxyisovaleric acid (Ahmed et al., 2009; González-Domínguez et al., 2014a; Trupp et al., 2014; Trushina and Mielke, 2014). Urinary biopyrrin was detected in urine (Luan et al., 2015); whereas two neurotransmitters, dopamine and γ-aminobutyric acid, were found in S. Nigra of PD patients as well as glutathione, homovanillic acid, and myoinositol (Gröger et al., 2014).
When the expression patterns (i.e., up- or downregulation) of metabolites were examined, we observed that the majority of the ALS biomarkers (riluzole, 1-palmitoleoylglycerophosphocholine, phenylalanine, glucose, tyrosine, ketone, oxaloacetate, mannose, 2-hydroxybutyrate, pentothenate, homocysteine, formate, β-hydroxybutyrate, inositol, stearoyl sphingomyelin, sphinganine-1-phosphate, lactate, and acetone) were over-expressed in the diseased state; whereas N-acetyl derivatives, 3-phenylpropionate, amine, betaine, and urate levels were decreased. In addition, low levels of alkaloids (caffeine, paraxanthine, theobromine, and theophylline), and hippurate were observed in ALS patients (Blasco et al., 2015; Botosoa et al., 2012; Gray et al., 2015; Kumar et al., 2010; Lawton et al., 2012, 2014; Toczylowska et al., 2013; Zoccolella et al., 2008).
Among the AD biomarkers, three acids (4-HPLA, 2-HPA, and VMA), two amino acid derivatives (5-L-glutamylglycine and 5-hydroxytryptophan), xanthine, and adenosine were over-expressed in the diseased state; whereas three neurotransmitters (anandamide, norepinephrine [NE], and 3-methoxytyramine), two amino acids (cysteine and beta-alanine), pipecolic acid, desmosterol, uridine, and lysophosphatidyl choline levels were decreased (Cui et al., 2014; González-Domínguez et al., 2015; Kaddurah-Daouk et al., 2013; Liang et al., 2016; Sato et al., 2012; Trushina and Mielke, 2014; Voyle et al., 2016).
Increases in levels of lipid hydroperoxides, and saturated or polysaturated fatty acids together with isoleucine, proline, γ-aminobutyric acid, homovanillic acid, MDA, SOD, 2-oxoisocaproate, and urinary biopyrrin were observed in PD patients. However, the amino acids (arginine, glutathione, cysteine, and glutamic acid), amines (methylamine, trimethylamine, and ethanolamine), alcohols (galacticol and glycerol), acid salts (suberate, glutarate, gluconate, malate, glycolate, succinate, citrate, and methylmalonate), 3-hydroxyisovaleric acid, threonate, and dopamine levels were decreased in PD. Moreover, myoinositol was decreased in S. Nigra, but it increased in blood plasma. Asparagine was increased in CSF and blood plasma, but it decreased in serum in PD patients. Elevated sorbitol and propylene glycol levels were also observed in PD patients (Ahmed et al., 2009; de Farias et al., 2016; González-Domínguez et al., 2014a; Gröger et al., 2014; Luan et al., 2015; Marklund and Marklund, 1974; Trupp et al., 2014; Wang et al., 2014).
To discern the similarities and differences of disease signatures at metabolome level, all possible comparisons were performed and results were represented by a Venn diagram (Fig. 2). In addition, a heat map (Fig. 3) was constructed to evaluate any possible correlation between the expression patterns of the metabolites.
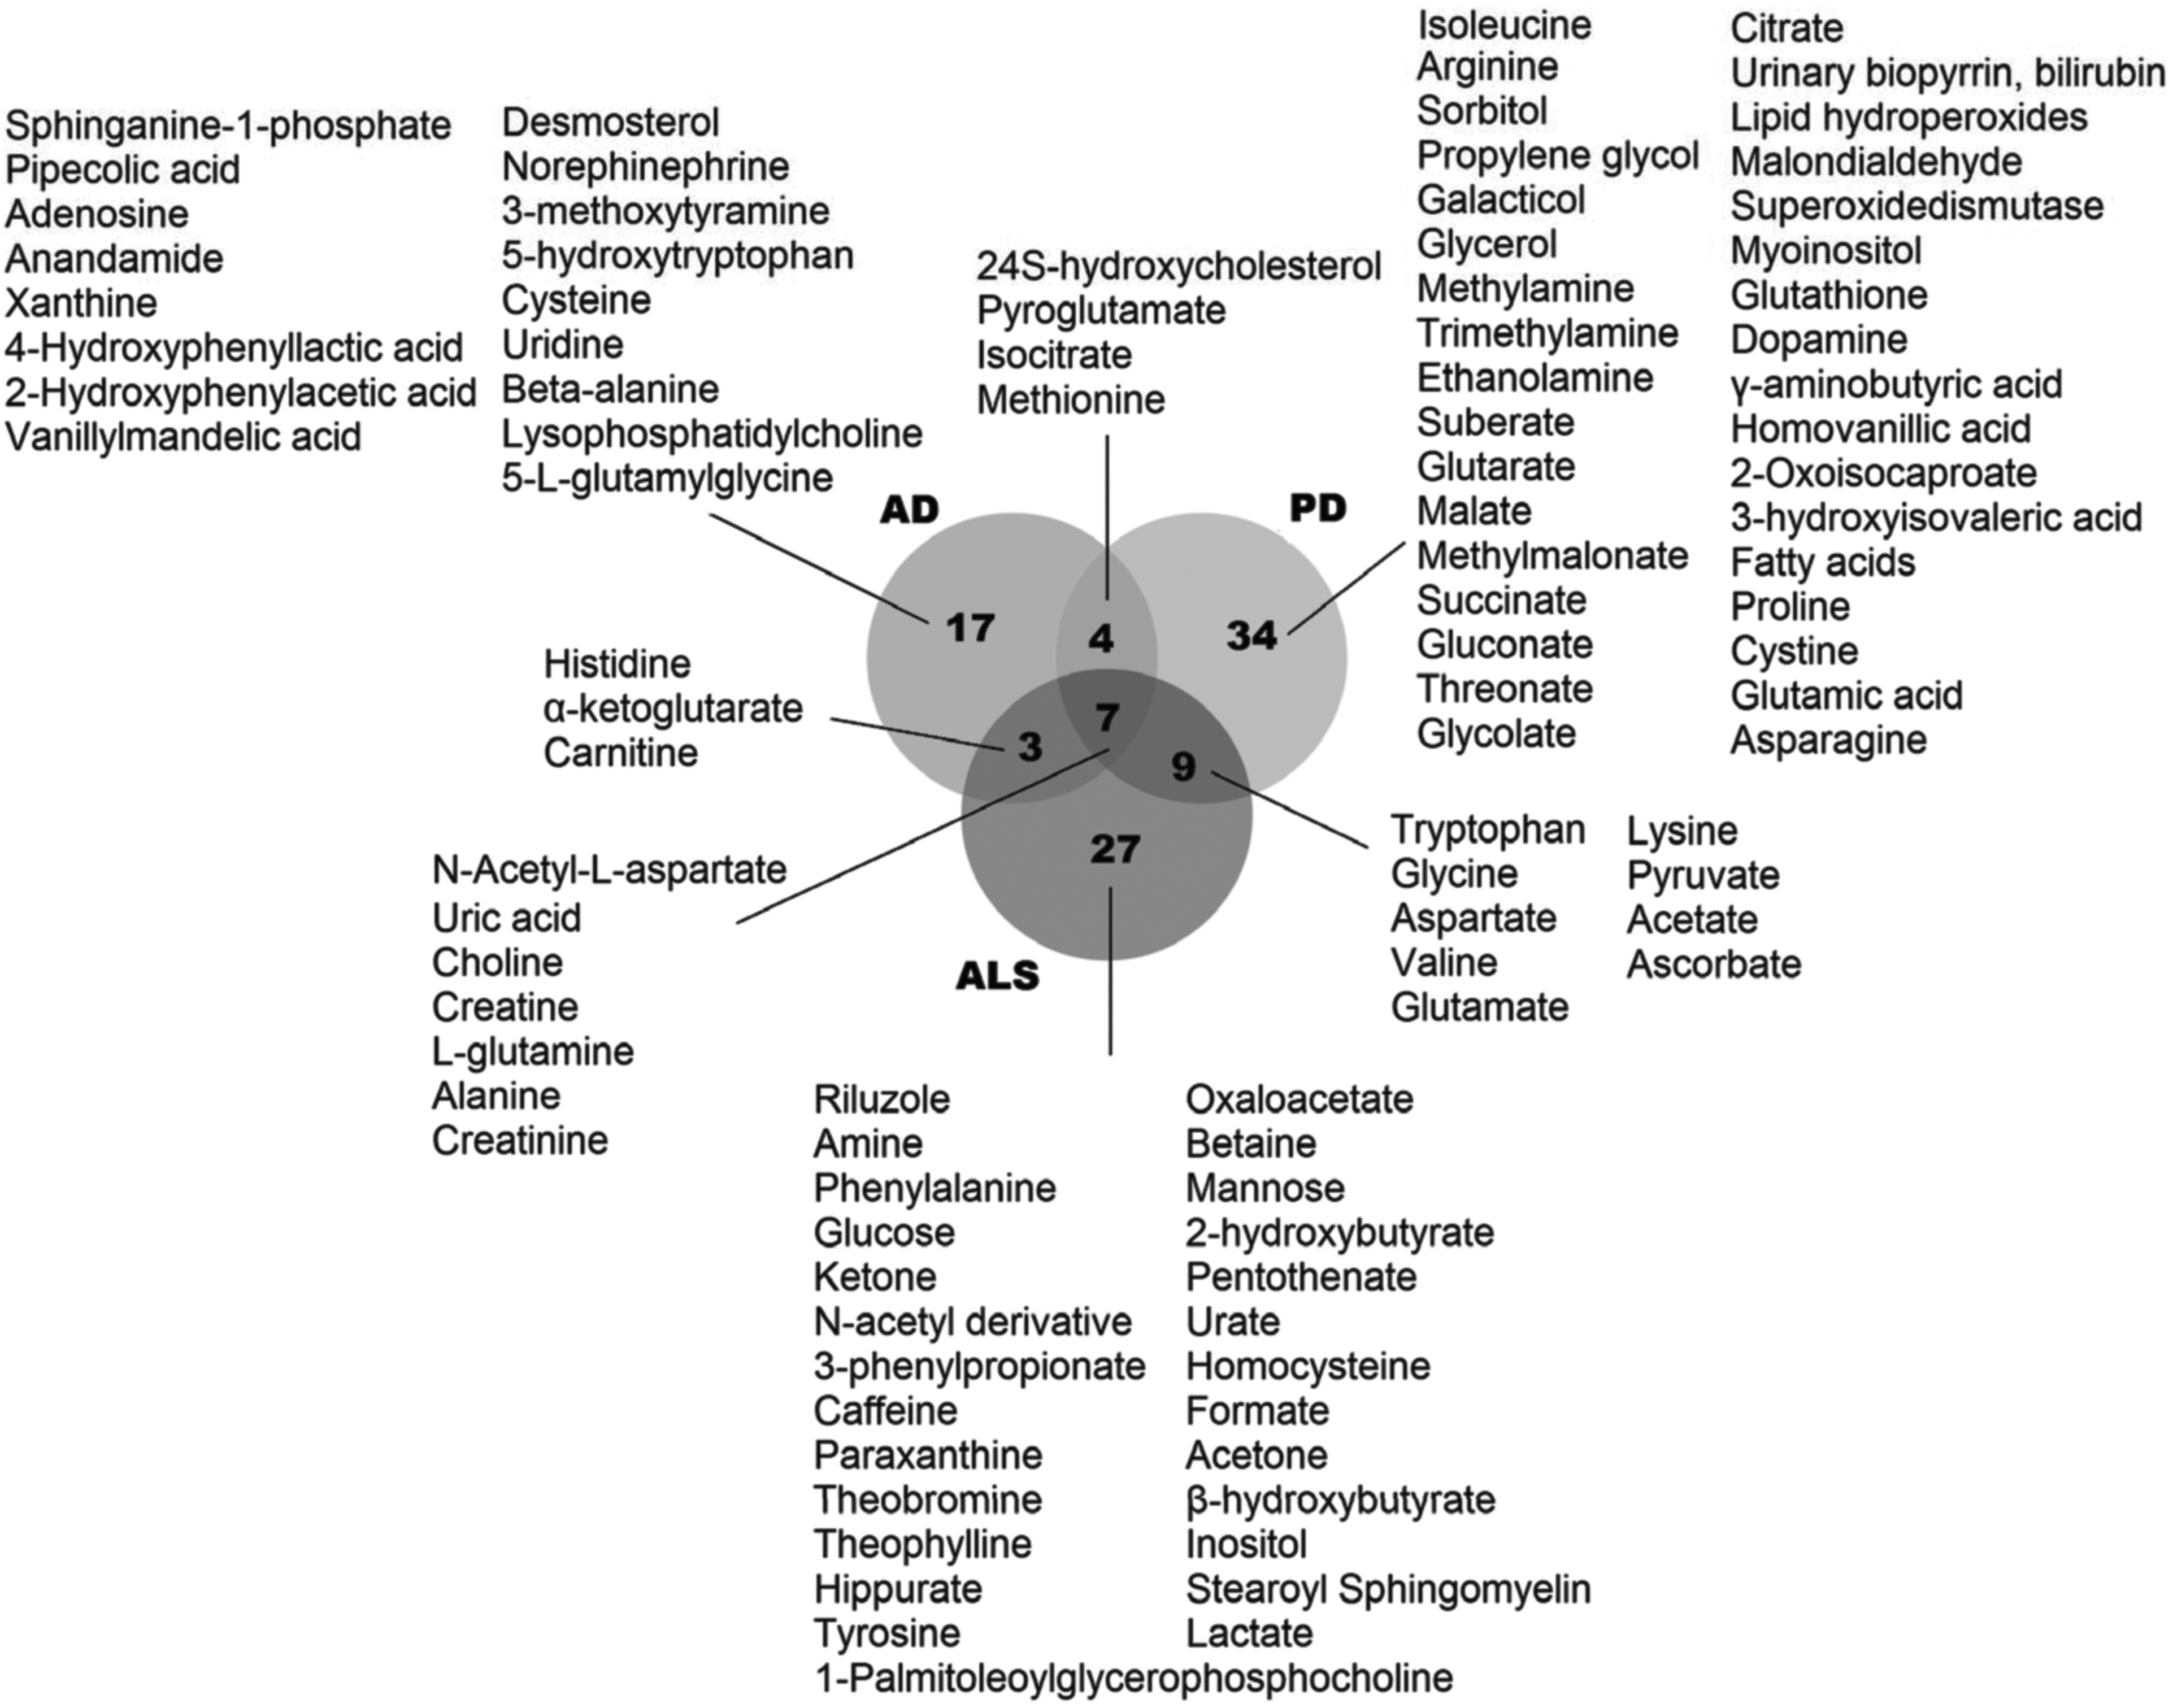
Venn diagram representing the metabolic signature similarities and differences among the three neurodegenerative diseases examined in the present study. AD, Alzheimer's disease; ALS, amyotrophic lateral sclerosis; PD, Parkinson's disease.
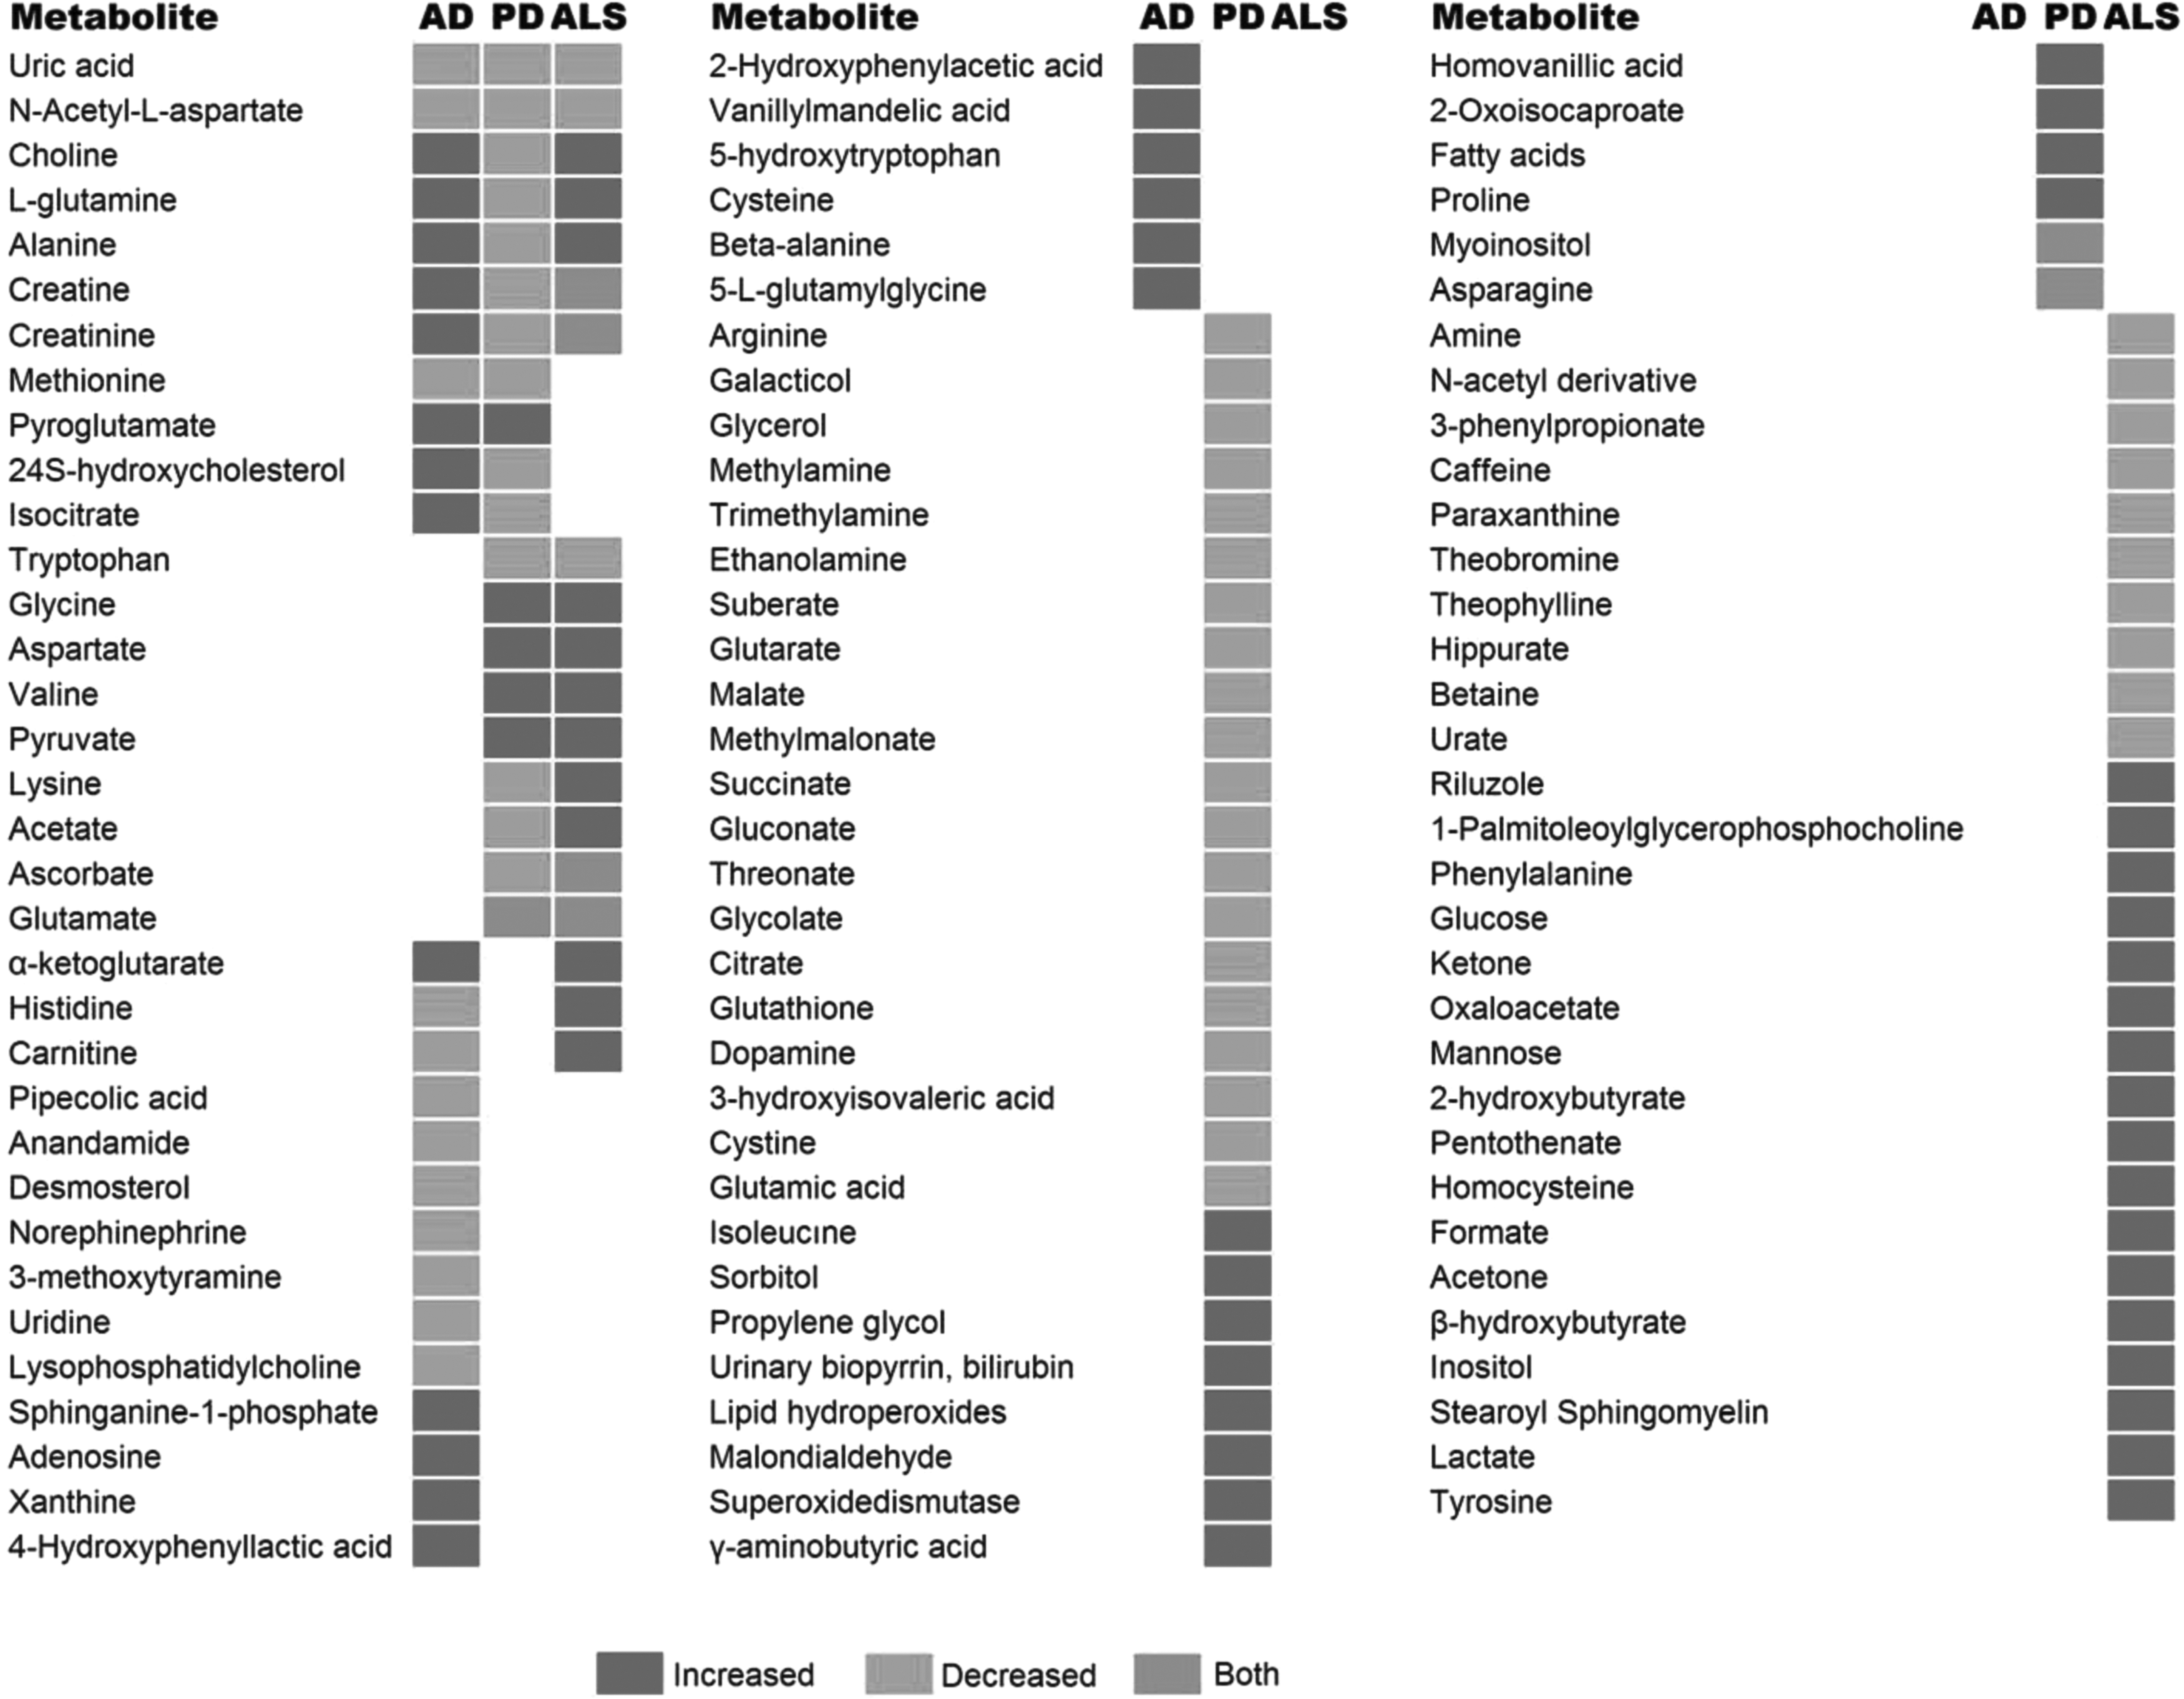
A heat map analysis displaying the correlations according to the direction of change (increased, decreased, or both) in the regulation of the putative metabolite biomarkers of the three neurodegenerative diseases examined in the present study.
The comparative analyses of metabolic biomarkers indicated that there were seven mutual metabolites (uric acid, choline, creatine, L-glutamine, alanine, creatinine, and N-acetyl-L-aspartate) among three neurodegenerative diseases. Among these metabolites, uric acid and N-acetyl-L-aspartate levels were decreased in all diseases (Fig. 3). The choline, L-glutamine, and alanine levels were increased in AD and ALS, but they were decreased in PD. The creatine and creatinine levels were also increased in AD and decreased in PD, but their expression patterns in ALS were not stable and fluid dependent (Abraham and Drory, 2014; Ahmed et al., 2009; Blasco et al., 2015; Botosoa et al., 2012; Cui et al., 2014; González-Domínguez et al., 2014a; Gröger et al., 2014; Jukarainen et al., 2008; Kantarci et al., 2000; Kim et al., 2006; Kumar et al., 2010; Lawton et al., 2012; Toczylowska et al., 2013; Trupp et al., 2014; Trushina and Mielke, 2014; Wuolikainen et al., 2011).
In addition, 24S-hydroxycholesterol, pyroglutamate, isocitrate, and methionine were the mutual metabolites for both AD and PD (Fig. 2). Methionine levels were decreased in both diseases, and pyroglutamate levels were increased. On the other hand, 24S-hydroxycholesterol and isocitrate levels were increased in AD, but they were decreased in PD.
Three metabolites (histidine, α-ketoglutarate, and carnitine) were determined as mutual biomarkers of AD and ALS. α-ketoglutarate levels were increased in both diseases. However, elevated levels of histidine and carnitine were observed in ALS; whereas the expressions of these metabolites were decreased in AD.
Nine metabolites were indicated as mutual biomarkers of PD and ALS. Among those, glycine, aspartate, valine, and pyruvate levels were increased, and tryptophan levels were decreased in both diseases. On the other hand, lysine and acetate levels were elevated in ALS, but they were decreased in PD (Fig. 3). The levels of ascorbate and glutamate were dependent on the fluid. For instance, glutamate levels were decreased in the CSF of PD patients and the plasma of ALS patients; however, elevated glutamate levels were observed in the plasma of PD and the CLS of ALS patients.
Besides the mutual metabolites, the majority (78 of 101) of the biomarkers were disease specific (Figs. 2 and 3): 17, 34, and 27 metabolites came into prominence in only AD, PD, and ALS, respectively. The biological roles of these metabolites were determined via metabolic pathway enrichment analyses (Table 2). Five pathways were significantly enriched for all diseases: three amino acid pathways (arginine and proline metabolism; alanine, aspartate, and glutamate metabolism; and glycine, serine, and threonine metabolism), ATP binding cassette (ABC) transporters, and purine nucleotide metabolism.
ABC, ATP binding cassette; TCA, tricarboxylic acid.
When disease-specific metabolic pathways were analyzed, several amino acid pathways were significantly enriched in all diseases: in AD, tyrosine and phenylalanine; in PD, beta-alanine; and in ALS, phenylalanine. Moreover, pyrimidine nucleotide metabolism, the neuroactive ligand-receptor interaction pathway, and the vascular smooth muscle contraction process were significantly enriched in AD. On the other hand, seven pathways of carbohydrate metabolism (citrate cycle, pyruvate metabolism, ascorbate and aldarate metabolism, galactose metabolism, glyoxylate and dicarboxylate metabolism, propanoate metabolism, and butanoate metabolism) and two pathways from lipid metabolism (glycerolipid metabolism and fatty acid degradation) came into prominence in PD. Similar to PD-specific pathways, ALS were also enriched with pathways of carbohydrate metabolism (glycolysis/gluconeogenesis, galactose metabolism, pyruvate metabolism, propanoate metabolism, glyoxylate and dicarboxylate metabolism) and lipid metabolism (synthesis and degradation of ketone bodies). However, caffeine metabolism and nitrogen metabolism pathways were specific to ALS (Table 2).
Ranking the disease-metabolite-pathway associations according to their statistical significance pointed out the importance of membrane transport (through ABC transporters), and arginine and proline amino acids in all diseases (Fig. 4). Neuroactive ligand-receptor interaction and tyrosine metabolism came into prominence in AD. Glutamate metabolism, citrate cycle (tricarboxylic acid [TCA] cycle), glycoxylate and dicarboxylate metabolism, and butanoate metabolism were significantly enriched in PD; whereas pyruvate metabolism, alanine, aspartate and glutamate metabolism, glycosis/glucogenesis, and glycoxylate and dicarboxylate metabolism were distinguished in the case of ALS.

A schematic representation of the disease-metabolite-pathway associations according to their significance for the three neurodegenerative diseases examined in the present study. Node color: the p value significance (sliding through light to dark gray showed increased statistical significance), circle diameter: pathway impact (larger circle diameters correspond to higher degree values).
We also analyzed the metabolites within the human serum metabolomics network (Yazdani et al., 2016b) and identified causal network parameters (in and out degrees) to determine the effects of metabolites within the networks (Yazdani et al., 2016a). Interestingly, common metabolites between PD and ALS (tryptophan, glycine, valine, and lysine) had higher influence in the metabolomics network in comparison with common metabolites between AD and PD or AD and ALS (Table 3). However, neither high influential metabolites (active metabolites) nor metabolites in modules in the metabolomics causal network were among the common metabolites between these diseases.
Discussion
Metabolomics offers the promise to identify at a systems scale the molecular signatures of cellular processes, molecular interactions, and metabolic pathways that are attendant to complex diseases such as neurodegenerative disorders with multi-factorial underpinnings. In the present study, we have undertaken research to evaluate the hitherto proposed metabolic biomarkers of three common neurodegenerative diseases (AD, PD, and ALS) by using pathway enrichment analyses and as seen through a lens of systems approach. We analyzed not only metabolites but also the significantly altered metabolic pathways.
The comparative analyses of metabolic biomarkers pointed out to the presence of seven mutual metabolites (uric acid, choline, creatine, L-glutamine, alanine, creatinine, and N-acetyl-L-aspartate) among three neurodegenerative diseases, whereas the majority (78 of 101) of the biomarkers was disease specific. Among the mutual metabolites, uric acid and N-acetyl-L-aspartate levels were decreased in all diseases: Choline, L-glutamine, and alanine levels were increased in AD and ALS but they were decreased in PD. Creatine and creatinine levels were increased in AD and were decreased in PD, but their expression levels in ALS were not stable and sample fluid dependent (Fig. 3). The disease-specific trends in expression profiles of these metabolites best suggested them as a set of biomarkers (i.e., systems biomarkers instead of single biomarkers).
The in-depth analyses of biomarkers indicated the importance of amino acids and derivatives in the diagnosis and treatment of the three neurodegenerative diseases. Twenty-five amino acids and their derivatives were identified as biomarkers for these three diseases. Among them, alanine, L-glutamine, and N-acetyl-L-aspartate were common to all three diseases. N-acetyl-L-aspartate levels were decreased in all diseases, whereas alanine and L-glutamine levels were increased in AD and ALS in contrast to PD. In addition, pathway enrichment analysis results indicated the dominance of three amino acid pathways in all diseases: arginine and proline metabolism; aspartate and glutamate metabolism; and glycine, serine, and threonine metabolism. Moreover, phenyalanine metabolism was significantly altered in AD and ALS.
The potential of proline-rich polypeptides as therapeutic agents in neurodegenerative diseases was previously reported (Gladkevich et al., 2007). Nitric oxide, synthesized from L-arginine, affects brain functions by generating nitroxidative stress, and its elevation may play a causative role in the development of neurodegenerative diseases, including AD and PD (Virarkar et al., 2013). Many neurodegenerative diseases were associated with neurotransmitter levels, and glutamate is the most prevalent neurotransmitter in the brain. Glutamate concentration was raised in ALS patients, and glutamate inhibitors (for example, riluzole) were presented as an alternative cure for ALS patients (Sako et al., 2016). In addition, aberrant glutamate signaling in the basal ganglia may be involved in PD development (Gasparini et al., 2013). Glycine behaves as a neurotransmitter (López-Corcuera et al., 2001), and phenylalanine have a significant role in neurotransmitter regulation (Humphries et al., 2008). Therefore, as neurotransmitters, or neurotransmitter regulators, the role of amino acids (glutamate, glycine, and phenylalanine in particular) in neurodegenerative diseases is evident.
According to metabolic pathway enrichment analyses, ABC transporters were significantly enriched in all diseases. Forty-nine different genes encoding ABC transporters were identified in the human genome, and they were classified into seven sub-groups (named ABCA to ABCG). ABC transporters mediate the export of numerous substances (peptides, drugs or drug conjugates, and hydrophobic molecules) through the blood–brain barrier, and they are expressed in each cell type in the brain (Pahnke et al., 2014; Schumacher et al., 2012). The relationship between ABC transporters and neurodegenerative diseases was commonly based on the function of ABC transporters or impairment of their function in the blood–brain barrier. The aberrant ABC transporter expression has been reported in several neurodegenerative diseases, including AD, PD, and ALS. ABC transporters play an essential role in AD disease initiation and development by facilitating Aβ exports from the brain barriers, which can cause inadequate Aβ export (Pahnke et al., 2014). In addition, the expression of ABC transporters (and thereby their function) was increased at the blood–brain and blood–spinal cord barriers in ALS patients (Jablonski et al., 2015).
The links between diseases and altered metabolism are supported by many observations. For example, metabolic changes can affect disease progression, response to therapy, and patients' clinical outcome. Pathways that have essential roles in disease progression of ALS and PD generally belong to carbohydrate metabolism. Pathway enrichment analyses in the present study indicated that glycoxylate and dicarboxylate metabolism, galactose metabolism, citrate cycle (TCA cycle), glycolysis/gluconeogenesis, and pyruvate metabolism were the most influenced metabolic pathways in regards to disease pathogenesis. These pathways share mutual hub metabolites, like pyruvate and oxaloacetate, which are the main compounds for TCA cycle, gluconeogenesis, and glycoxylate and dicarboxylate metabolism (Garrett and Grisham, 2002). Pyruvate and pyruvate-oxaloacetate have neuroprotective effects on neuro-metabolism via increasing the brain-to-blood glutamate efflux (Carvalho et al., 2011; Zilberter et al., 2015; Zlotnik et al., 2007).
Since accumulation of glutamate can cause neuro-excitotoxic effects, its accumulation was repressed via scavenging of it by pyruvate and oxaloacetate (Castillo et al., 2016; Danbolt et al., 2001; Zlotnik et al., 2012). The weight of the evidence suggests that particularly carbohydrate and energy metabolism are the main components of PD, AD, and ALS development. Fluctuations in carbohydrate metabolism may also lead to an imbalance of glucose tolerance and insulin resistance. Indeed, the metabolic homeostasis of leptin, ghrelin, insulin, and IGF-1 provides a neuroprotective and neurotrophic effect in AD and PD (Procaccini et al., 2016).
The levels of these compounds were directly associated with carbohydrate and energy metabolisms in our analyses. Insulin resistance impairs carbohydrate metabolism and mitochondrial function, which results in elevated oxidative stress and partial cognitive functions during the progression of AD (Abolhassani et al., 2016). Therefore, it can be hypothesized that metabolic dysregulation and neurodegeneration have a strong relationship in the pathophysiology of neurodegenerative diseases.
When AD-specific pathways were considered, tyrosine metabolism and neuroactive ligand-receptor interactions were significantly altered in AD in the present study. The metabolites 3-methoxythramine (3-MT), VMA, 4-HPLA, and 2-HPA were components of the tyrosine metabolism. Sphinganine-1-phosphate, anandamide, beta-alanine, adenosine, and NE were enriched with neuroactive ligand-receptor interactions.
The levels of 3-MT, which is a catabolic intermediate of dopamine, were decreased 92% in the striatum of PD patients (Loeffler, 1995). VMA (also known as 3-Methoxy-4-hydroxy-mandelic acid) is one of the end products of the catabolism of catecholamines (epinephrine, NE, and dopamine). VMA levels in CSF were found to be dramatically increased in AD, whereas NE levels were significantly decreased. Kaddurah-Daouk et al. (2013) emphasized the correlations between VMA and amyloid-β (Ab42); between VMA, 4-HPLA, 2-HPA, and total tau; and between VMA, 4-HPLA, and phosphorylated tau. 2-HPA is involved in 4-hydroxyphenylpyruvate dioxygenase activity, which is a key enzyme in the degradation of tyrosine.
The hydroxyphenylacetate group was used as a urinary biomarker for diagnosis of neuropsychiatric disorders such as major depressive disorder (Zheng et al., 2013). 4-HPLA, which was increased in AD, is a tyrosine metabolite formed by gut microbes, such as lactobacilli (Mu et al., 2010). 4-HPLA was significantly reduced in Huntington disease (HD) in comparison to both normal control and premanifest HD subjects (Rosas et al., 2015). Hence, its reduction in AD might further indicate an AD/gut interaction like in HD.
Sphinganine 1-phosphate, which is an intermediate of glycosphingolipid and sphingolipid metabolisms, is one of the key components for the neuroactive ligand-receptor interactions. Sphingolipid metabolism was effective in neural cells (van Echten-Deckert and Herget, 2006). Studies have shown alterations in phospholipid metabolite levels in AD, and fluctuations in phospholipid metabolite levels were correlated with neuro-pathology that was indicative of the disease and cognitive decline (Cuénod, 1995; Klunk, 1996; Pettegrew, 1987). They may be elevated due to loss of spingosine-1-phosphate, which is a protective factor (Couttas, 2014) that is employed in neuroactive ligand-receptor interaction pathways. Levels of ceramide, the pivotal molecule of sphingolipid metabolism with sphingosine-1-phosphate in neural signaling and function (Colombaioni and Garcia-Gil, 2004), were also reduced.
Anandamide, beta-alanine, and adenosine were other components of the neuroactive ligand-receptor interaction pathway, which were significantly altered in neurodegenerative diseases. Ab42-dependent brain anandamide (AEA) mobilization contributes to cognitive dysfunction in AD (Jung, 2012). It was suggested that there is a relationship between AEA and Notch signaling, which is essential for neural cell maintenance in the adult brain, and prolonged formation and development of nerve tissues throughout life. AEA might offer neuroprotection of neurodegeneration. Enhancement of AEA might enhance Notch signaling and could provide a therapy to ease symptoms and hold off progression of neurodegeneration (Khaspekov, 2004; Ramírez, 2005; Tanveer, 2012).
Evaluation of AD-specific pathways of neuroactive ligand-receptor interaction and tyrosine metabolism together suggested that depletion of NE, 3-methoxytyramine, and metabolites within the purine pathway were associated with neurofibrillary tangle formation and/or Aβ deposition (Trushina and Mielke, 2014). If we sum up all, these results indicated the perturbations of tyrosine metabolism, neuroactive ligand-receptor interactions, and phospholipids metabolism in AD, which may be important for clinical diagnosis and treatment. They could be helpful for an understanding of metabolic pathogenesis of AD.
In the present study, according to an enrichment analysis of common metabolites, lipid metabolism was also responsible for PD. Two pathways from lipid metabolism (glycerolipid metabolism and fatty acid degradation) came into prominence in PD. Lipid metabolism was affected from levels of glycerol, propylene glycol, and fatty acid compounds in PD. Glycerol levels were decreased (Ahmed et al., 2009); however, propylene glycol and fatty acid levels were increased in PD (González-Domínguez et al., 2014b). These findings were supported by the previous studies that reported elevated levels of polyunsaturated fatty acids in the brain (Dias et al., 2013; Liu et al., 2008). Highly unsaturated fatty acids can cause lipid peroxidation and promote generation of toxic products under oxidative stress circumstances, which results in neural damage and promotes PD improvement.
According to pathway enrichment analysis, sorbitol, glycerol, myoinositol, and galacticol were also members of the galactose metabolism, which may be considered the alternative way to overcome mitochondrial dysfunction and to create energy. Moreover, the elevated levels of fatty acids in serum of PD (González-Domínguez et al., 2014b) may also be considered as the usage of fatty acids as an alternative carbon source to increase energy demand (Prins, 2008).
Similar to PD-specific pathways, ALS was also enriched with pathways from lipid metabolism (synthesis and degradation of ketone bodies). However, caffeine metabolism and nitrogen metabolism pathways were specific to ALS.
Ketone bodies (acetoacetate, beta-hydroxybutyrate, and acetone) are produced when fatty acid is broken down in excess (Fukao et al., 2004; Sass, 2012). Acetoacetate and beta-hydroxybutyrate are synthesized from acetyl-CoA, mainly in the mitochondria of liver cells when carbohydrates are so scarce that energy must be obtained from breaking down of fatty acids; acetone is formed by spontaneous decarboxylation of acetoacetate (Fukao et al., 2004; Sass, 2012). Ketone body synthesis in the liver is effectively irreversible, because the enzyme that catalyzes the conversion of acetoacetate to acetoacetyl-CoA is not present in liver cells (Fukao et al., 2004; Sass, 2012). During prolonged starvation, ketone bodies can provide up to two-thirds of the brain's energy requirements (Sass, 2012). When the expression patterns of metabolites were examined, we observed that the majority of the ALS biomarkers (acetone, beta-hydroxybutyrate) were over-expressed in the diseased state (Kumar et al., 2010).
Formate, which was significantly increased in ALS disease, is a byproduct in the production of acetate. It provides both metabolic acidosis and damaged mitochondrial electron transport and energy production by inhibiting cytochrome oxidase activity, the terminal electron acceptor of the electron transport chain (Kumar et al., 2010; Nicholls et al., 1975). Since cytochrome oxidase inhibition by formate leads to partial depletion of ATP or reducing energy concentration, cell functions cannot be maintained and cell death occurs (Kumar et al., 2010). In addition to this, the increased production of cytotoxic reactive oxygen species (ROS) derived from inhibition of cytochrome oxidase by formate may also cause cell death (Kumar et al., 2010). ROS, which leads to the disruption in mitochondrial electron transport and energy production, also increases levels of formate (Kumar et al., 2010).
Caffeine was determined in plasma of patients having ALS disease (Lawton et al., 2012). Caffeine affects multiple mechanisms in the brain such as adenosine, ryanodine, and γ-aminobutyric acid receptors and cyclic nucleotide phosphodiesterase isoenzymes. Caffeine also stimulates the activity of the central nervous system, and it is associated with changes in the rates of cerebral energy metabolism (Luong and Nguyen, 2015). Several studies suggested that caffeine has significant effects on ALS through non-genomic factors, including glutamate, Na+-K+-ATPase, the mammalian family of mitogen-activated protein kinases, prostaglandins and cyclooxygenase-2, and reactive oxygen species (Luong and Nguyen, 2015). On the other hand, a further investigation of the effect of caffeine in neurodegenerative diseases is needed.
A further understanding about metabolic programming is definitely necessary for efficient therapy progression. In as much as, any pathophysiological mechanism lead by disease will predictably cause associated changes in the concentrations of particular metabolites; therefore, nowadays, exploration of metabolites to evaluate disease(s) detection, monitoring, and treatment is obviously a very promising and effective direction. Furthermore, the metabolic biomarkers will lead to develop new strategies that enable more precise diagnosis of three neurodegenerative diseases, and should be regarded as subjects of drug repositioning studies, which employ known drugs and compounds to treat new indications.
Conclusions
The current analysis identified 101 metabolites as potential biomarkers of AD, PD and ALS. The comparative analyses indicated the mutual and disease-specific metabolites, as well as metabolic pathways. In the light of these data, we defined a set of biomarkers (uric acid, choline, creatine, L-glutamine, alanine, creatinine, and N-acetyl-L-aspartate) as putative systems biomarkers, which may inform the future strategies for diagnostic or prognostic biomarkers. The importance of amino acids, ABC transporters, neuroactive ligand-receptor interactions, and caffeine metabolism as well as the carbohydrate, lipid, and energy metabolism were notable as an outcome of the present study. For these neurodegenerative diseases, to overcome inadequate glucose supply and energy crisis in neurodegeneration, alanine, aspartate and glutamate metabolism, and purine metabolism appear to be alternative pathways. Further analysis of metabolites and enzymes of the proposed pathways could be helpful for an understanding of metabolic pathogenesis and therapy of AD, PD, and ALS diseases.
These new observations collectively underscore the importance of metabolite-based biomarker research in deciphering the elusive pathophysiology of neurodegenerative diseases. Future research investments in post-genomics fields as metabolomics would provide new insights on AD, PD, and ALS that continue to place a significant burden on global health.
Footnotes
Acknowledgments
The authors thank the anonymous reviewers and the editor for their comments to improve this article. No funding was received in support of this research.
Author Disclosure Statement
The authors declare that no conflicting financial interests exist.