
Abstract
Abstract
Diabetes mellitus type 1 (DM1) is a major public health problem that continues to burden the healthcare systems worldwide, costing exponentially more as the epidemic grows. Innovative strategies and omics system diagnostics for earlier diagnosis or prognostication of DM1 are essential to prevent secondary complications and alleviate the associated economic burden. In a preclinical study design that involved streptozotocin (STZ)-induced DM1, insulin-treated STZ-induced DM1, and control rats, we characterized the insulin-dependent and -independent changes in protein profiles in liver samples. Digested proteins were subjected to LC-MSE for proteomic data. Progenesis QI data processing and analysis of variance were utilized for statistical analyses. We found 305 proteins with significantly altered abundance among the control, DM1, and insulin-treated DM1 groups (p < 0.05). These differentially regulated proteins were related to enzymes that function in key metabolic pathways and stress responses. For example, gluconeogenesis appeared to return to control levels in the DM1 group after insulin treatment, with the restoration of gluconeogenesis regulatory enzyme, FBP1. Insulin administration to DM1 rats also restored the blood glucose levels and enzymes of general stress and antioxidant response systems. These observations are crucial for insights on DM1 pathophysiology and new molecular targets for future clinical biomarkers, drug discovery, and development. Additionally, we underscore that proteomics offers much potential in preclinical biomarker discovery for diabetes as well as common complex diseases such as cancer, dementia, and infectious disorders.
Introduction
D
The occurrence of metabolic abnormalities in DM1 results from the imbalance of insulin and glucagon, a peptide hormone produced by pancreatic α-cells, which opposes the effects of insulin-stimulating hepatic glycogenolysis and gluconeogenesis and reduces peripheral glucose utilization. Thus, hepatic glucose production is increased, glycogen production is decreased, and peripheral uptake of glucose is decreased, resulting in severe hyperglycemia. In addition, lipolysis increases in adipose tissue with a subsequent increase in plasma free fatty acids (FFAs) that serve as substrates for the synthesis of ketone bodies causing ketoacidosis.
The increase in plasma FFAs promotes the synthesis of triglycerides, causing an increase in very low-density lipoproteins and hypertriglyceridemia. Furthermore, insulin deficiency impairs proteolysis and peripheral amino acid uptake, resulting in an increase in plasma alanine and glutamine. Alanine and glutamine are used as substrates for hepatic and renal gluconeogenesis, respectively.
The liver is an essential organ in the human body responsible for a multitude of functions. Some of these functions include bile formation and excretion, vitamin and mineral storage, control of plasma glucose levels, protein synthesis, formation of ketone bodies, participation in lipoprotein and cholesterol metabolism, hormone processing, and xenobiotic breakdown and excretion (Baig et al., 2001). In DM1, the liver can develop structural and/or functional abnormalities that may disrupt any of these processes, particularly regulation of carbohydrate and lipid metabolism (Bechmann et al., 2011).
The use of biomarkers in biological and medical fields is becoming a widely accepted approach in research on, and diagnosis of, complex diseases such as diabetes (Chikowore et al., 2015; Pepaj et al., 2015; Song et al., 2015). To this end, protein expression is tightly regulated to ensure optimal cellular function and the changes in their levels have direct impact on both metabolic and physiological pathways. On the other hand, these changes may reflect various disease states or functional abnormalities.
Utilizing proteins or peptides as biomarkers has been applied in the diagnosis of many specific diseases, understanding of disease pathogenesis, and monitoring the progress of therapeutic interventions (Karthik et al., 2012). Many studies have been successfully conducted to identify potential biomarkers by comparing protein patterns present in healthy samples with affected or diseased samples (Vlahou and Fountoulakis, 2005). Therefore, the discovery of new DM1 biomarkers may help in early and reliable diagnosis before secondary complications arise and reduce the severity of the disease outcome.
Many proteomic studies of DM1 have been reported in the literature, including examination of various tissues (Baseler et al., 2011; Soggiu et al., 2012) and plasma (Balderas et al., 2013; Chen et al., 2012) from drug-induced (Baseler et al., 2013; Leite et al., 2014) and/or genetic models (Bugger et al., 2009; Johnson et al., 2009). The majority of these studies focus on proteomics in the diabetic state without treatment.
The major findings were that in plasma of DM1 patients, hemopexin is upregulated and can be modulated by glucose through a reactive oxygen species (ROS)-dependent mechanism (Chen et al., 2012); in the heart of DM1 rat model, the mitochondrial heat shock protein (Hsp) 70 was downregulated, contributing to protein import dysfunction and this process implicating in the pathogenesis of the diabetic heart (Baseler et al., 2011); and in investigations of proteome in DM1, Akita mice showed tissue-specific remodeling, causing mitochondrial dysfunction in the heart and preservation of mitochondrial function in the kidney, brain, and liver (Bugger et al., 2009).
In the present study focusing on the hepatic proteome, streptozotocin (STZ) was used to induce DM1 in a rat model. This is a common model used to induce DM1 and hyperglycemia that result in metabolic imbalance, including dysregulation of energy and glucose metabolism, oxidative stress, and cell death (Szkudelski, 2001). Although STZ-induced proteomic studies have been published, the subset of proteins dysregulated due to STZ treatment rather than DM1 conditions has not been well defined. Therefore, the liver proteome of STZ-induced DM1 rats with and without insulin treatment was analyzed and compared, generating sets of proteins and pathways that were either dependent or independent of insulin treatment.
Materials and Methods
Experimental animals and procedures
The experimental procedures were approved by the Ethics Committee on the Use of Animals (Protocol: CEUA-436/2012) of the Institute of Biosciences/São Paulo State University (UNESP)—Botucatu, which were in accordance with the ethical principles in animal research provided by the Brazilian College of Animal Experimentation.
Fifteen Wistar male rats (Rattus norvegicus) (45 days old) with an average initial weight of 250 g were used. Animals were kept in individual plastic cages at a controlled temperature (25°C ± 2°C) and photoperiod (12-h dark:12-h light cycles), receiving water and commercial diet (Purina® Labina, Campinas-SP) ad libitum throughout the experimental period.
The animals were randomly assigned into three experimental groups: control (C), diabetic (DM1), and diabetic treated with insulin (DM1+I). The control group (n = 5) received water and food without any additional treatment. In the diabetic group, DM1 was induced by intraperitoneal administration of STZ in a single dose. The STZ was diluted with sodium citrate buffer (100 mM, pH 4.5) and the animals received 1 mL (60 mg kg−1 body weight) of the prepared solution. After 48 h, blood samples were collected from the punctured tail and blood glucose was determined by a glucometer.
The animals with glucose concentrations above 220 mg dL−1 were considered diabetic and used in the experiment (n = 5). For the diabetic insulin-treated group, diabetes was induced by STZ as described above and the animals with blood glucose concentrations above 220 mg dL−1 (n = 5) were used for additional insulin treatment. Insulin (Humulin N100UI Neutral Protamine Hagedorn; Lilly®) was administered subcutaneously at an initial dose of 3 U/animal; following insulin daily doses depended on the blood glucose levels measured just before insulin administration and were adjusted to maintain glucose levels within the normal range (110 mg dL−1).
At the end of the 30-day experimental period, the animals in all three groups were anesthetized (10% ketamine hydrochloride at 0.1 mL/100 g of body weight, i.p.), sacrificed by decapitation, and the liver was collected, flash-frozen, and lyophilized.
Protein extraction
The samples were reconstituted in lysis buffer (25 mM Tris buffer pH 8.0, 8 M urea) and homogenized in a Bullet Blender 24 (Next Advance). For every 100 mg of liver tissue, 200 μL of lysis buffer was added along with ∼50 μL of ZrO grinding balls (Next Advance). The samples were vortexed until completely homogenized (∼3 × 2 min, placed on ice for 30 sec between each vortex cycle). Beads were then allowed to settle on ice for 2 min, crude extracts placed into new tubes, and centrifuged for 5 min at 15,000 g. Protein concentrations in supernatant were determined by BCA assay using samples diluted 1:10 and 1:100 in water.
Protein delipidation
For each sample, volume corresponding to 100 μg of proteins was transferred to the new tube, mixed with cold acetone (three times the volume of sample), and incubated at −20°C for 30 min. Samples were centrifuged for 2 min at 15,000 g to pellet the precipitated proteins and supernatants were discarded. Pellets were washed twice with cold acetone, dried in speed vac (∼15 min), and stored at −80°C.
Protein digestion
Delipidated pellets (100 μg proteins) were fully solubilized in 20 μL denaturation buffer (25 mM ammonium bicarbonate, pH8.0; 10 mM tris[2-carboxyethyl] phosphine [TCEP]; 5% sodium deoxycholate [SDC]) and incubated for 10 min at 60°C. Thiol alkylation was achieved by adding 5 μL alkylation buffer (100 mM iodoacetamide in water, freshly prepared) and incubating the samples for 60 min at room temperature in the dark. Following alkylation, samples were diluted with 175 μL dilution buffer (25 mM ammonium bicarbonate, pH8.0) and 2 μL trypsin solution (1 μg/μL) was added. Samples were incubated overnight at 37°C. To stop the reaction and remove SDC, 10 μL of 10% TFA was added, mixture incubated for 30 min at room temperature, and centrifuged at 15,000 g (SDC precipitates at low pH). Supernatants were transferred into new tubes and directly used for Liquid cromatography-mass spectrometry (LC-MS) analysis.
LC-MSE analyses
All analyses were carried out using a Waters nanoAcquity UPLC System coupled to a Waters Synapt G2 TOF mass spectrometer. The mobile phases comprised Solvent A (0.1% formic acid in H2O) and Solvent B (0.1% formic acid in ACN). Injection volume was 2 μL. Following injection, the peptides were concentrated on Trap C-18 enrichment column (0.3 × 1 mm, Waters) and washed at 10 μL/min with Solvent A for 3 min. The enrichment column was then switched into the nanoflow path (500 nL/min) and further separated on C-18 reversed-phase nanocolumn (0.075 × 250 mm; Waters) coupled with the nanoelectrospray ionization source of Synapt G2 mass spectrometer.
Separation of peptides was achieved at the following gradient: T = 0 min: 5% B; T = 95 min: 50% B; T = 96 min: 85% B; T = 97 min: 85% B; T = 98 min: 5% B; T = 99 min: 5% B; T = 100 min: 85% B; T = 101 min: 85% B; T = 102 min: 5% B; and T = 120 min: 5% B (column reequilibration). MS data were collected in positive, data-independent acquisition (MSE) mode under following conditions: a capillary voltage of 2900 V; the source temperature was set at 70°C; cone gas flow was maintained at 6 L/min; and acquisition range was 50–2000 m/z. MSE data were collected with alternating low (4 eV) and elevated (ramp from 17 to 42 eV) energy over a 100–1500 m/z range. Spectra and statistical analysis was carried out using Progenesis software (Waters) and searched against NCBI database.
LC-MSE data processing and statistical analysis
LC-MSE raw data were processed and analyzed by the Progenesis QI software package for protein identification and quantitation. All runs were aligned to the most suitable reference, as determined by Progenesis QI. For peak picking, a chromatographic peak width of 0.2 min and the most sensitive setting in the automatic sensitivity method were used. Data normalization was done using total ion intensities referring to the automatically selected least different run. Data quality was assessed by Q metrics, including sample preparation, instrument, and experiment matrix.
Data were searched against the NCBI database with peptide tolerance and fragment tolerance set to auto. Search parameters also included up to two missed cleavages, fixed modification of carbamidomethyl, and variable modifications of methionine oxidation. For ion matching, the requirements were set at least two fragments per peptide with five fragments per protein and one peptide per protein. Progenesis QI software was then used to generate normalized protein abundance counts. Statistical analysis (a repeated measures analysis of variance [ANOVA]) was performed using Progenesis QI. All conflicts identified in data processing, quantification, and protein ID were resolved by manual inspection.
Pathway enrichment analysis
The list of proteins identified as significantly changed (p < 0.05) was submitted to the batch retrieval service (Retrieve/ID mapping) at The Universal Protein Resource (UniProt), and the UniProt protein IDs were converted to gene symbols that were further analyzed by Reactome Functional Interaction (FI) (Bauer-Mehren, 2013) using the Cytoscape plugin (Wu et al., 2010). The Reactome allows analysis of proteomic dataset by comparison of the experimentally obtained data with published knowledge database identifying related reactions, pathways, and biological processes. Pathways with a false discovery rate (FDR) <0.05 were considered to be significantly enriched and implied a potential impact of identified proteins on the metabolic pathways and cellular function.
Results
Comparative analysis
Proteomic data were processed and analyzed using the Progenesis QI software package. Principal component analysis revealed clear separation of all three groups (Fig. 1) and a repeated measures ANOVA identified 305 proteins significantly different in abundance (p < 0.05) between the control (C), diabetic (DM1), and insulin-treated diabetic (DM1+I) groups (Table 1 summarizes the significantly changed proteins with fold change >1.5; full list of the proteins is shown in Supplementary Table S1).
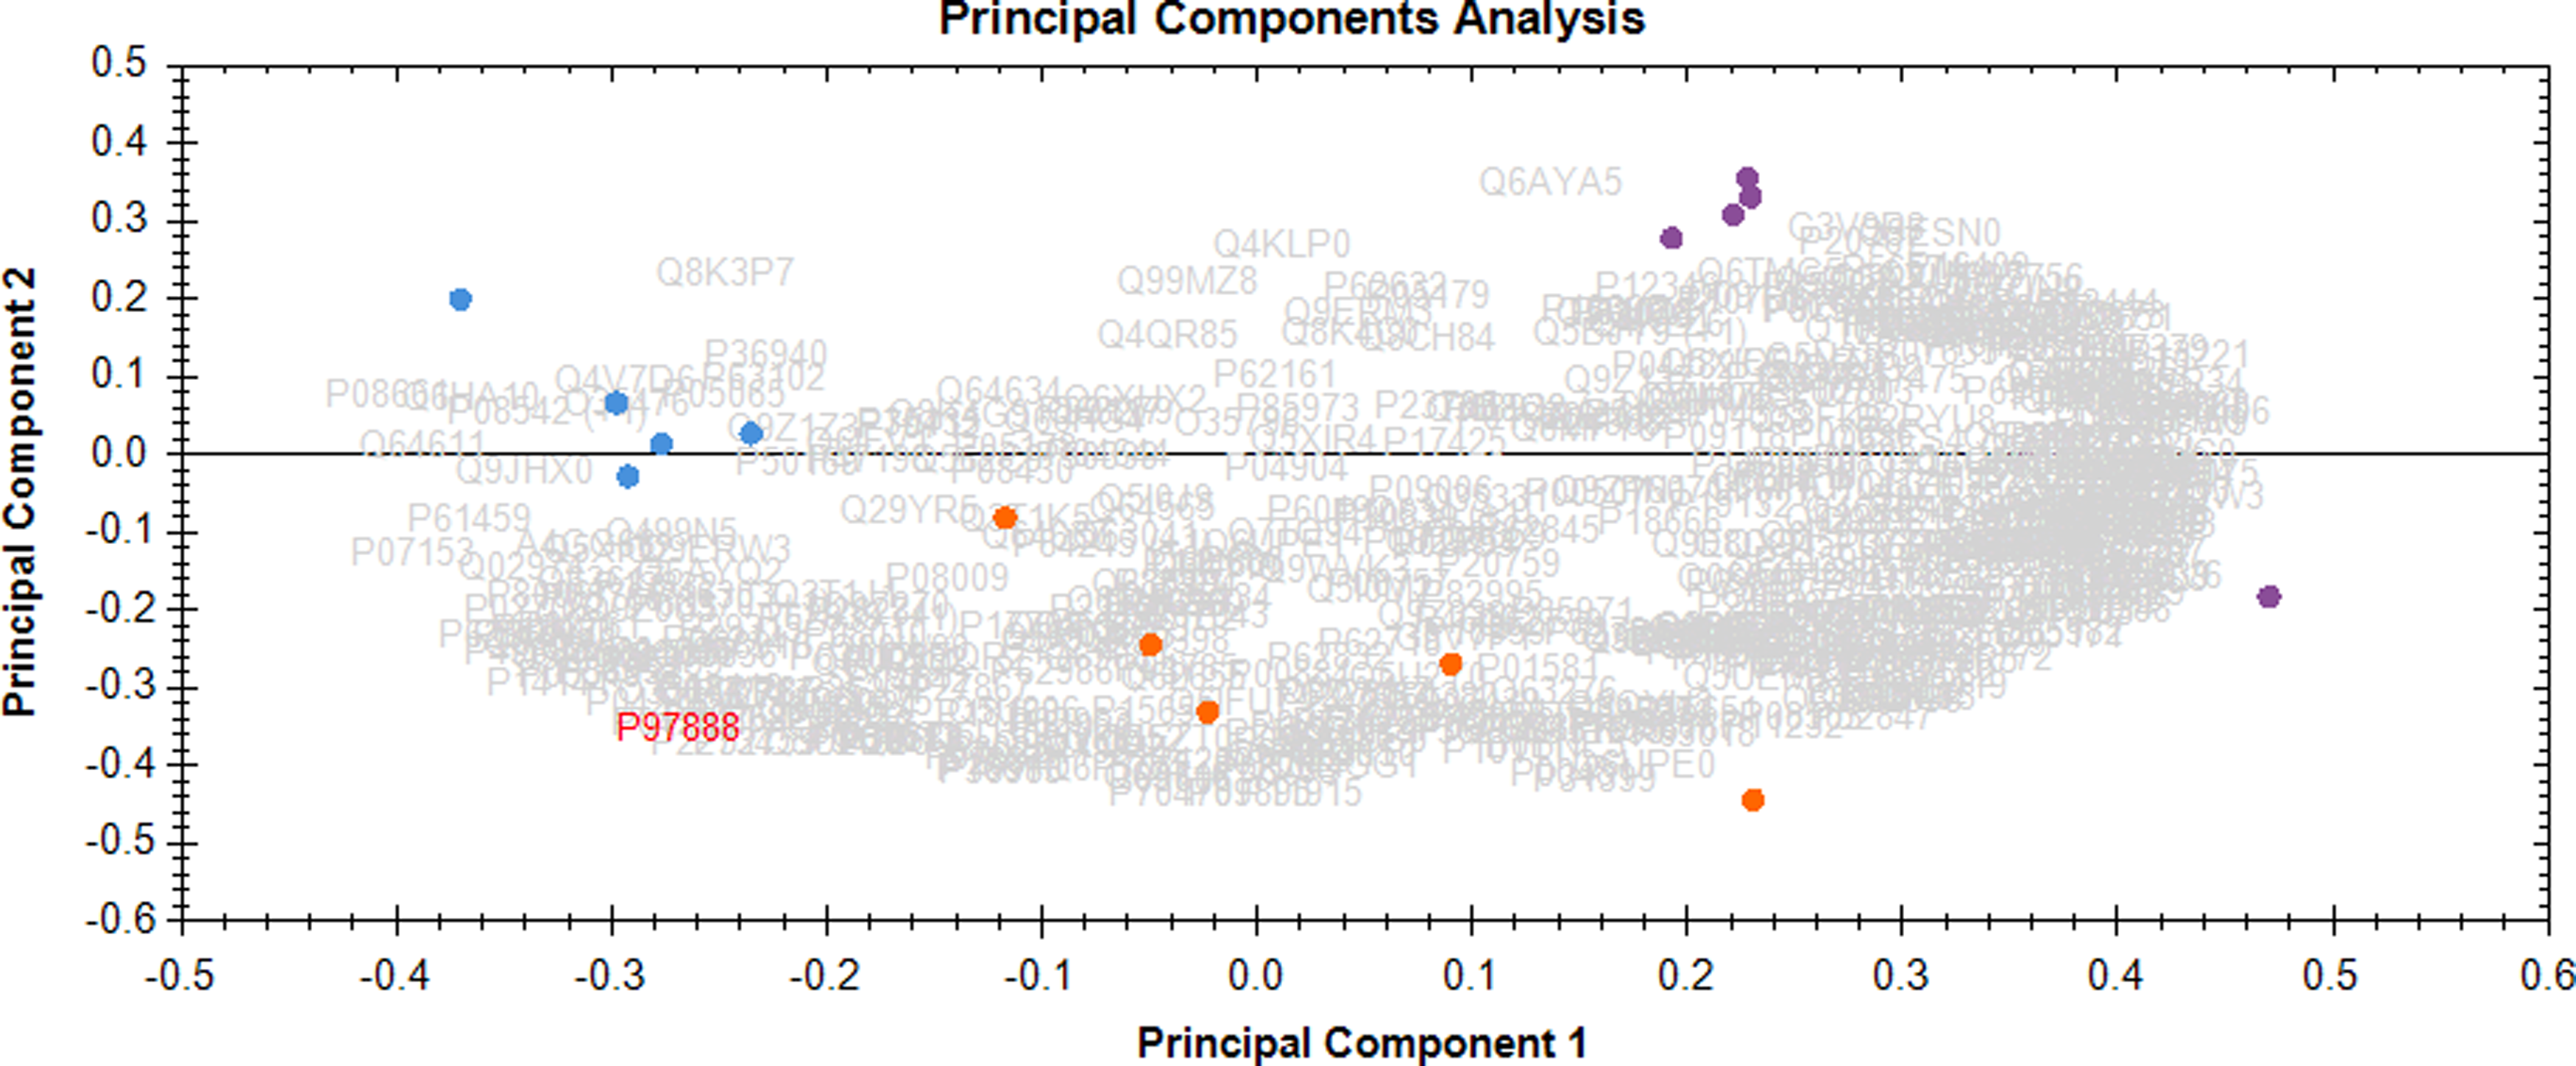
Hepatic proteome overlap of rats in the control (C), diabetic (DM1), and diabetic treated with insulin (DM1+I) groups. C = blue; DM1 = purple; DM1+I = orange.
ANOVA, analysis of variance; C, control group; DM1, diabetic group; DM1+I, diabetic treated with insulin; TCA, tricarboxylic acid.
Significantly changed proteins were further categorized as (1) insulin dependent—proteins changed in the diabetic group by >+/−20%, comparing with the normalized abundance of the control group, and their levels were completely or partially restored by insulin treatment (returning to <20% difference); and (2) insulin independent—proteins changed in the diabetic group by >+/−20%, comparing with the normalized abundance of the control group, and maintained the same levels or trends in the diabetic group treated with insulin.
Of these 305 significantly changed proteins, 147 were classified as insulin dependent and 152 were classified as insulin independent. Interestingly, six identified proteins did not show difference between control and diabetic group; however, significant changes were detected in the insulin-treated group, indicating a potential side effect of insulin treatment itself.
Of the 147 proteins classified as insulin dependent, 138 were converted to gene symbols and analyzed using Reactome FI. Analysis revealed nine significantly enriched (FDR <0.05) pathways. Most of these pathways are functionally related to metabolism and include metabolism of amino acids and related pathways (urea cycle and phenylalanine and tyrosine catabolism), the tricarboxylic acid (TCA) cycle and respiratory electron transport chain, and metabolism of lipids (mitochondrial fatty acid beta-oxidation; fatty acid, triacylglycerol, and ketone body metabolism; beta oxidation of palmitoyl-CoA to myristoyl-CoA). In addition, detoxification of the ROS pathway was identified as significantly affected.
Considering the 152 insulin-independent proteins, 149 were successfully converted to gene symbols. Reactome FI analysis revealed 30 pathways (FDR <0.05) that were significantly enriched. The pathways identified for the insulin-independent proteins are primarily related to energy metabolism, redox balance amino acid metabolism, and lipid metabolism, including glucose metabolism (gluconeogenesis, glycolysis), formation of ATP by chemiosmotic coupling, degradation of cysteine and homocysteine, synthesis of ketone bodies, pyruvate metabolism and TCA cycle, metabolism of nucleotides, sulfur amino acid metabolism, branched-chain amino acid (BCAA) catabolism, and phase II conjugation.
All identified pathways with corresponding genes for both insulin-dependent and -independent changes are summarized in Table 2.
Bold: upregulated in DM1; Non-Bold: downregulated in DM1.
FDR, false discovery rate.
Discussion
Amino acid metabolism
Insulin-dependent changes in protein abundance
The DM1 group had the following enzymes increased: carbamoyl phosphate synthetase I (CPS1, 1.54-fold increase), argininosuccinate synthetase (ASS1, 1.54-fold increase), and argininosuccinate lyase (ASL, 3.43-fold increase). These enzymes are involved in the urea cycle to detoxify ammonia, which is a by-product of protein and amino acid catabolism. Ammonia is a substrate of CPS1 incorporating it into carbamoyl phosphate, with subsequent steps producing argininosuccinate, and arginine and fumarate by ASS1 and ASL, respectively.
However, upon insulin treatment in the DM + I group, these enzymes were restored to control levels, demonstrating that their abundance is insulin dependent. In the diabetic condition, catabolism of skeletal muscle occurs, releasing glucogenic amino acids and ammonia. These results indicate that increased levels of these enzymes in the DM1 group play an important role in the detoxification of excess ammonia generated by protein catabolism. Insulin treatment prevents the breakdown of skeletal muscle and release of ammonia to generate glucose and therefore restores enzymes necessary for ammonia detoxification to control levels.
Insulin-independent changes in protein abundance
Similarly, the protein abundance of arginase-1 (ARG1, 1.42-fold increase) was increased in the DM1 group; a result which could potentially be explained by reduced insulin action and increased protein catabolic processes. However, ARG1 protein levels were not restored to control levels in the insulin-treated group. Reduced insulin activity in the diabetic state may cause impaired endothelial function and remodeling resulting from the ARG1 reaction that ultimately decreases NO production from the eNOS pathway to the arginase pathway (Shemyakin et al., 2012).
The abundance of ornithine transcarbamylase (OTC, 1.16-fold decrease) was also decreased in the DM1 group and not restored to control levels in the DM + I group. This potentially suggests that activation by Mn2+ supports increase/decrease flux without altering OTC protein levels (Xiong and Anderson, 1989). Two BCAA catabolic processes had increased abundance in the DM1 group: 2-oxoisovalerate dehydrogenase subunit alpha and beta (BCKDHA, 1.30-fold increase, and BCKDHB, 1.27-fold increase). Previous studies have displayed that these enzymes are particularly responsive to the inhibitory action of insulin where disturbances in BCAA protein abundance have been associated with diabetic complications (Adeva et al., 2012).
However, the present study did not show significant differences in BCAA protein abundance between the DM1 group and the DM1+I group. This discrepancy may be due to the potential excessive damage induced by the diabetic state in the model systems examined. ALAD demonstrated a decrease in abundance in both the DM1 and DM1+I groups. Previous studies have also shown a decrease in ALAD in DM1 (Fernandez-Cuartero et al., 1999; Kade et al., 2009; Schmatz et al., 2011). In addition, decreased abundance of Alad is associated with high-glucose levels and decreased antioxidant defense (Nogueira et al., 2004).
Most of the enzymes that function in the urea cycle were restored to control levels upon insulin treatment (Fig. 2). Interestingly, ARG1 displayed increased abundance in both DM1 and DM1+I groups, suggesting that the remodeling occurring under the initial diabetic state in the insulin-treated group cannot be completely reversed by insulin treatment.
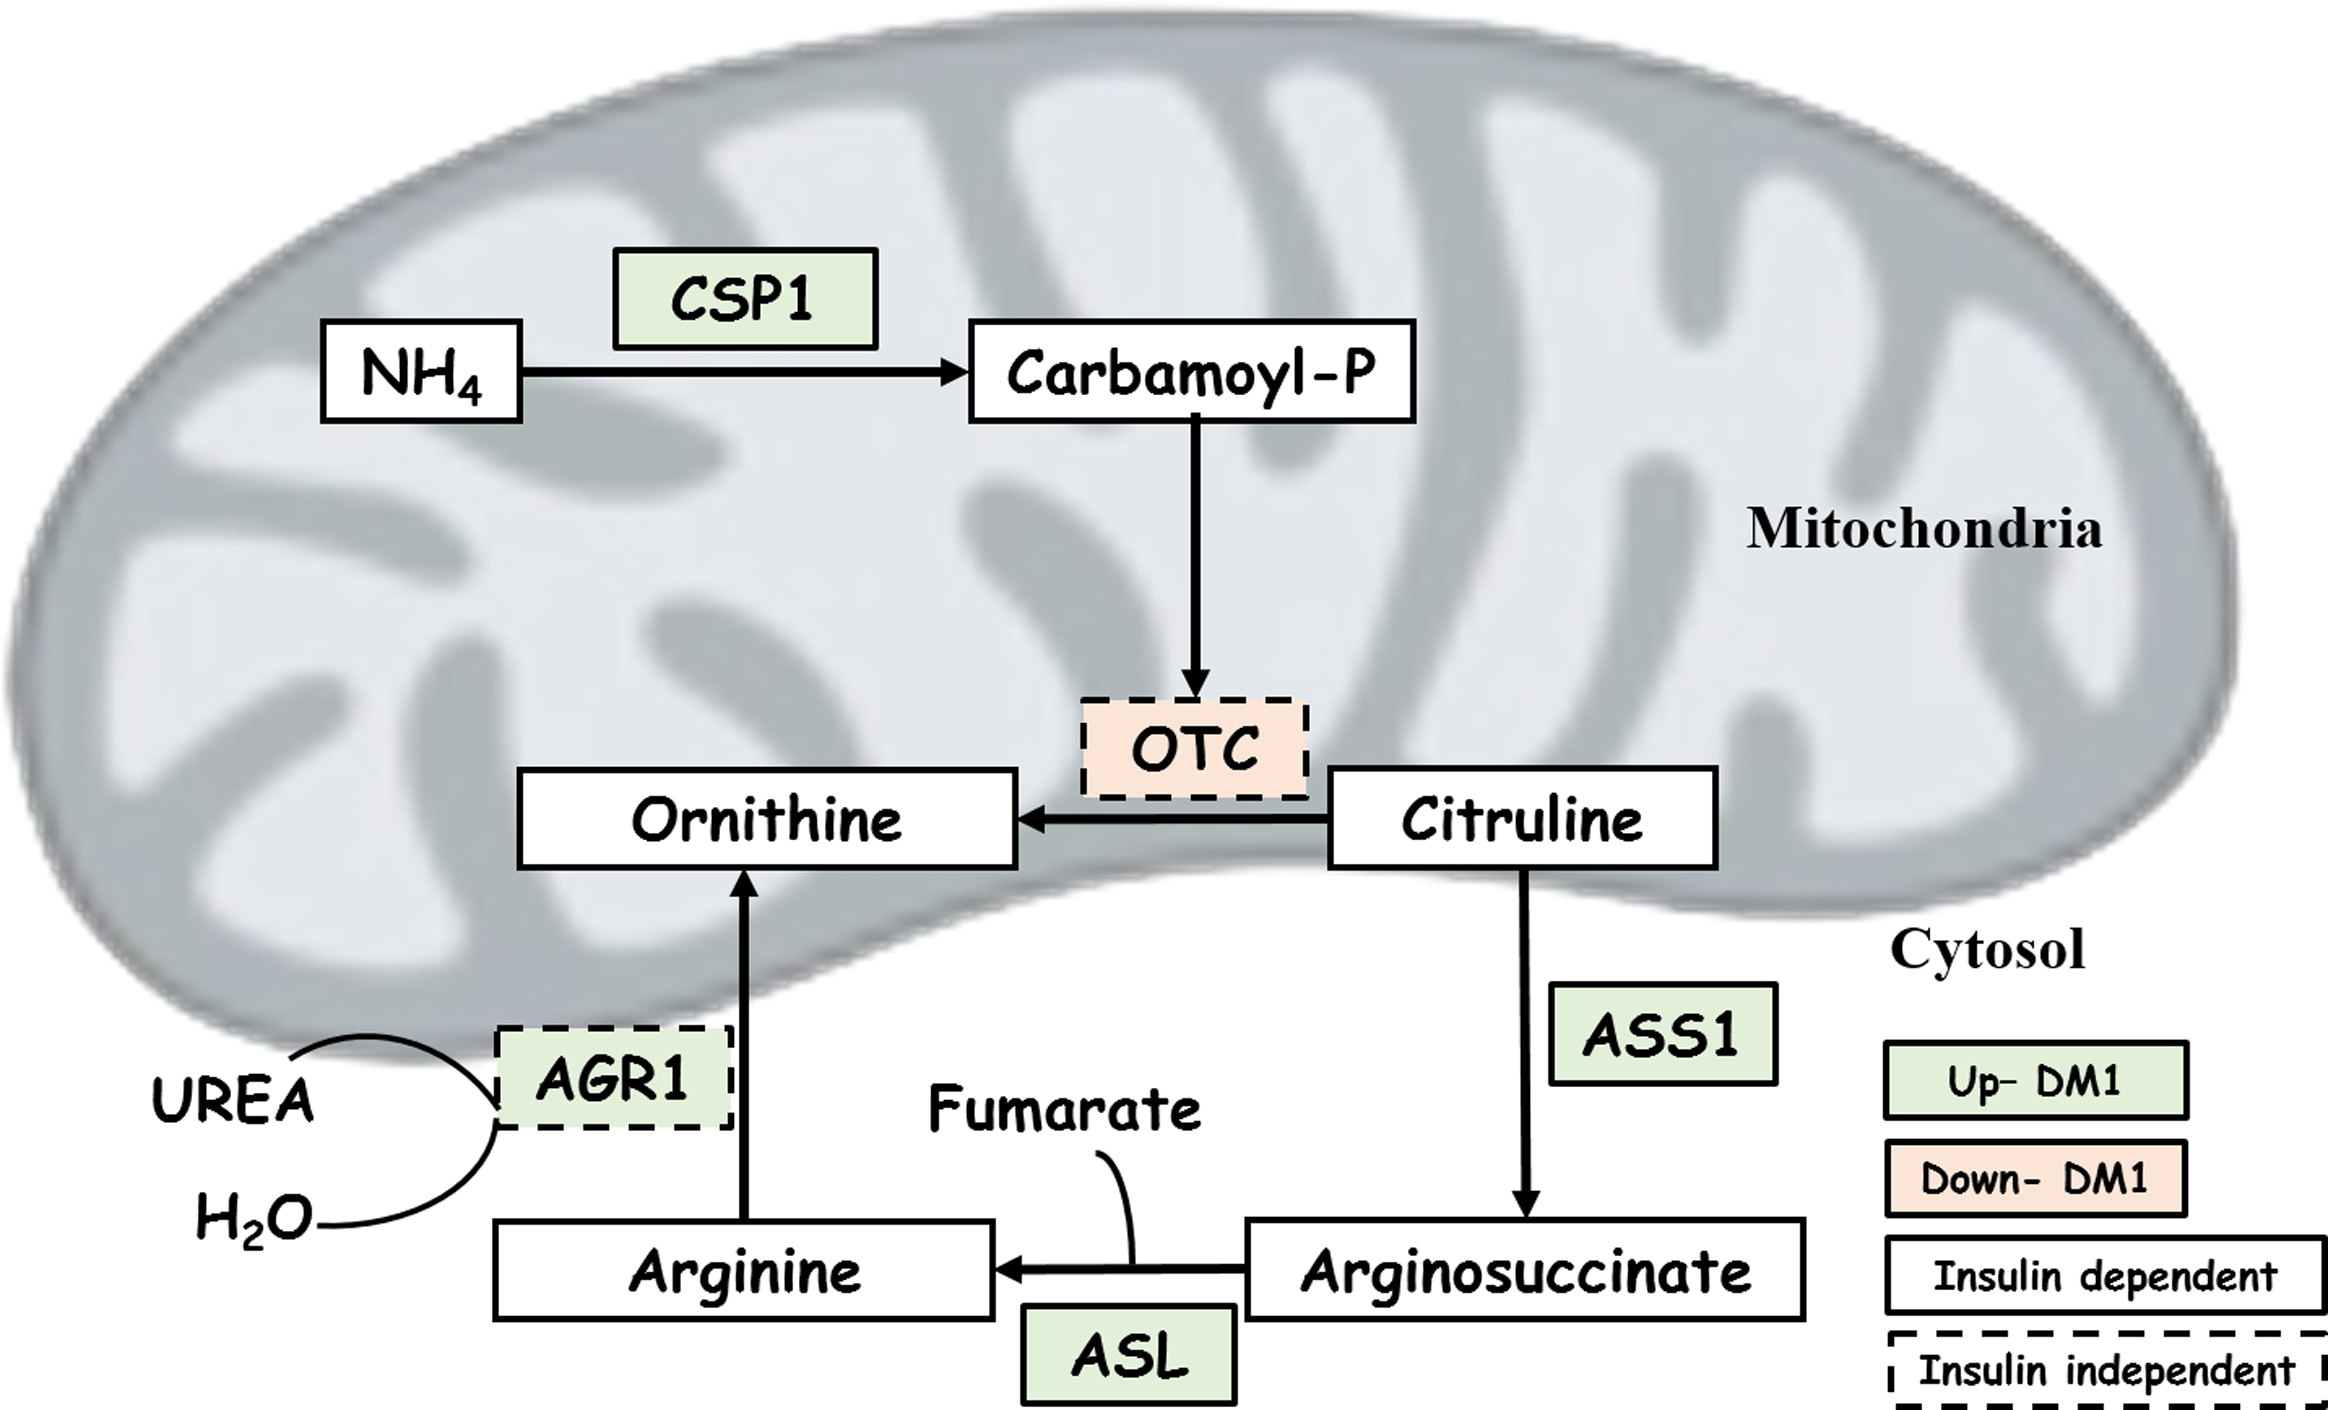
Urea cycle with insulin-dependent and -independent genes related to DM1. The green color indicates upregulation and orange downregulation in DM1. Based on insulin condition, the box with complete trace indicates that the gene is insulin dependent and traced box indicates insulin-independent genes. The urea cycle was restored to control levels upon insulin treatment.
Energy metabolism
Insulin-dependent changes in protein abundance
In the DM1 group, glycogen metabolism regulates blood glucose by stimulating gluconeogenesis and inhibiting glycolysis, producing glucose and urea from lactate, glutamine, and alanine (Jiang and Zhang, 2003). Two enzymes that function in gluconeogenesis had increased abundance in the DM1 group: fructose 1,6-bisphosphatase (FBP1, 1.53-fold increase) and cytosolic phosphoenolpyruvate carboxykinase (PCK1, 1.82-fold increase) (Fig. 3).
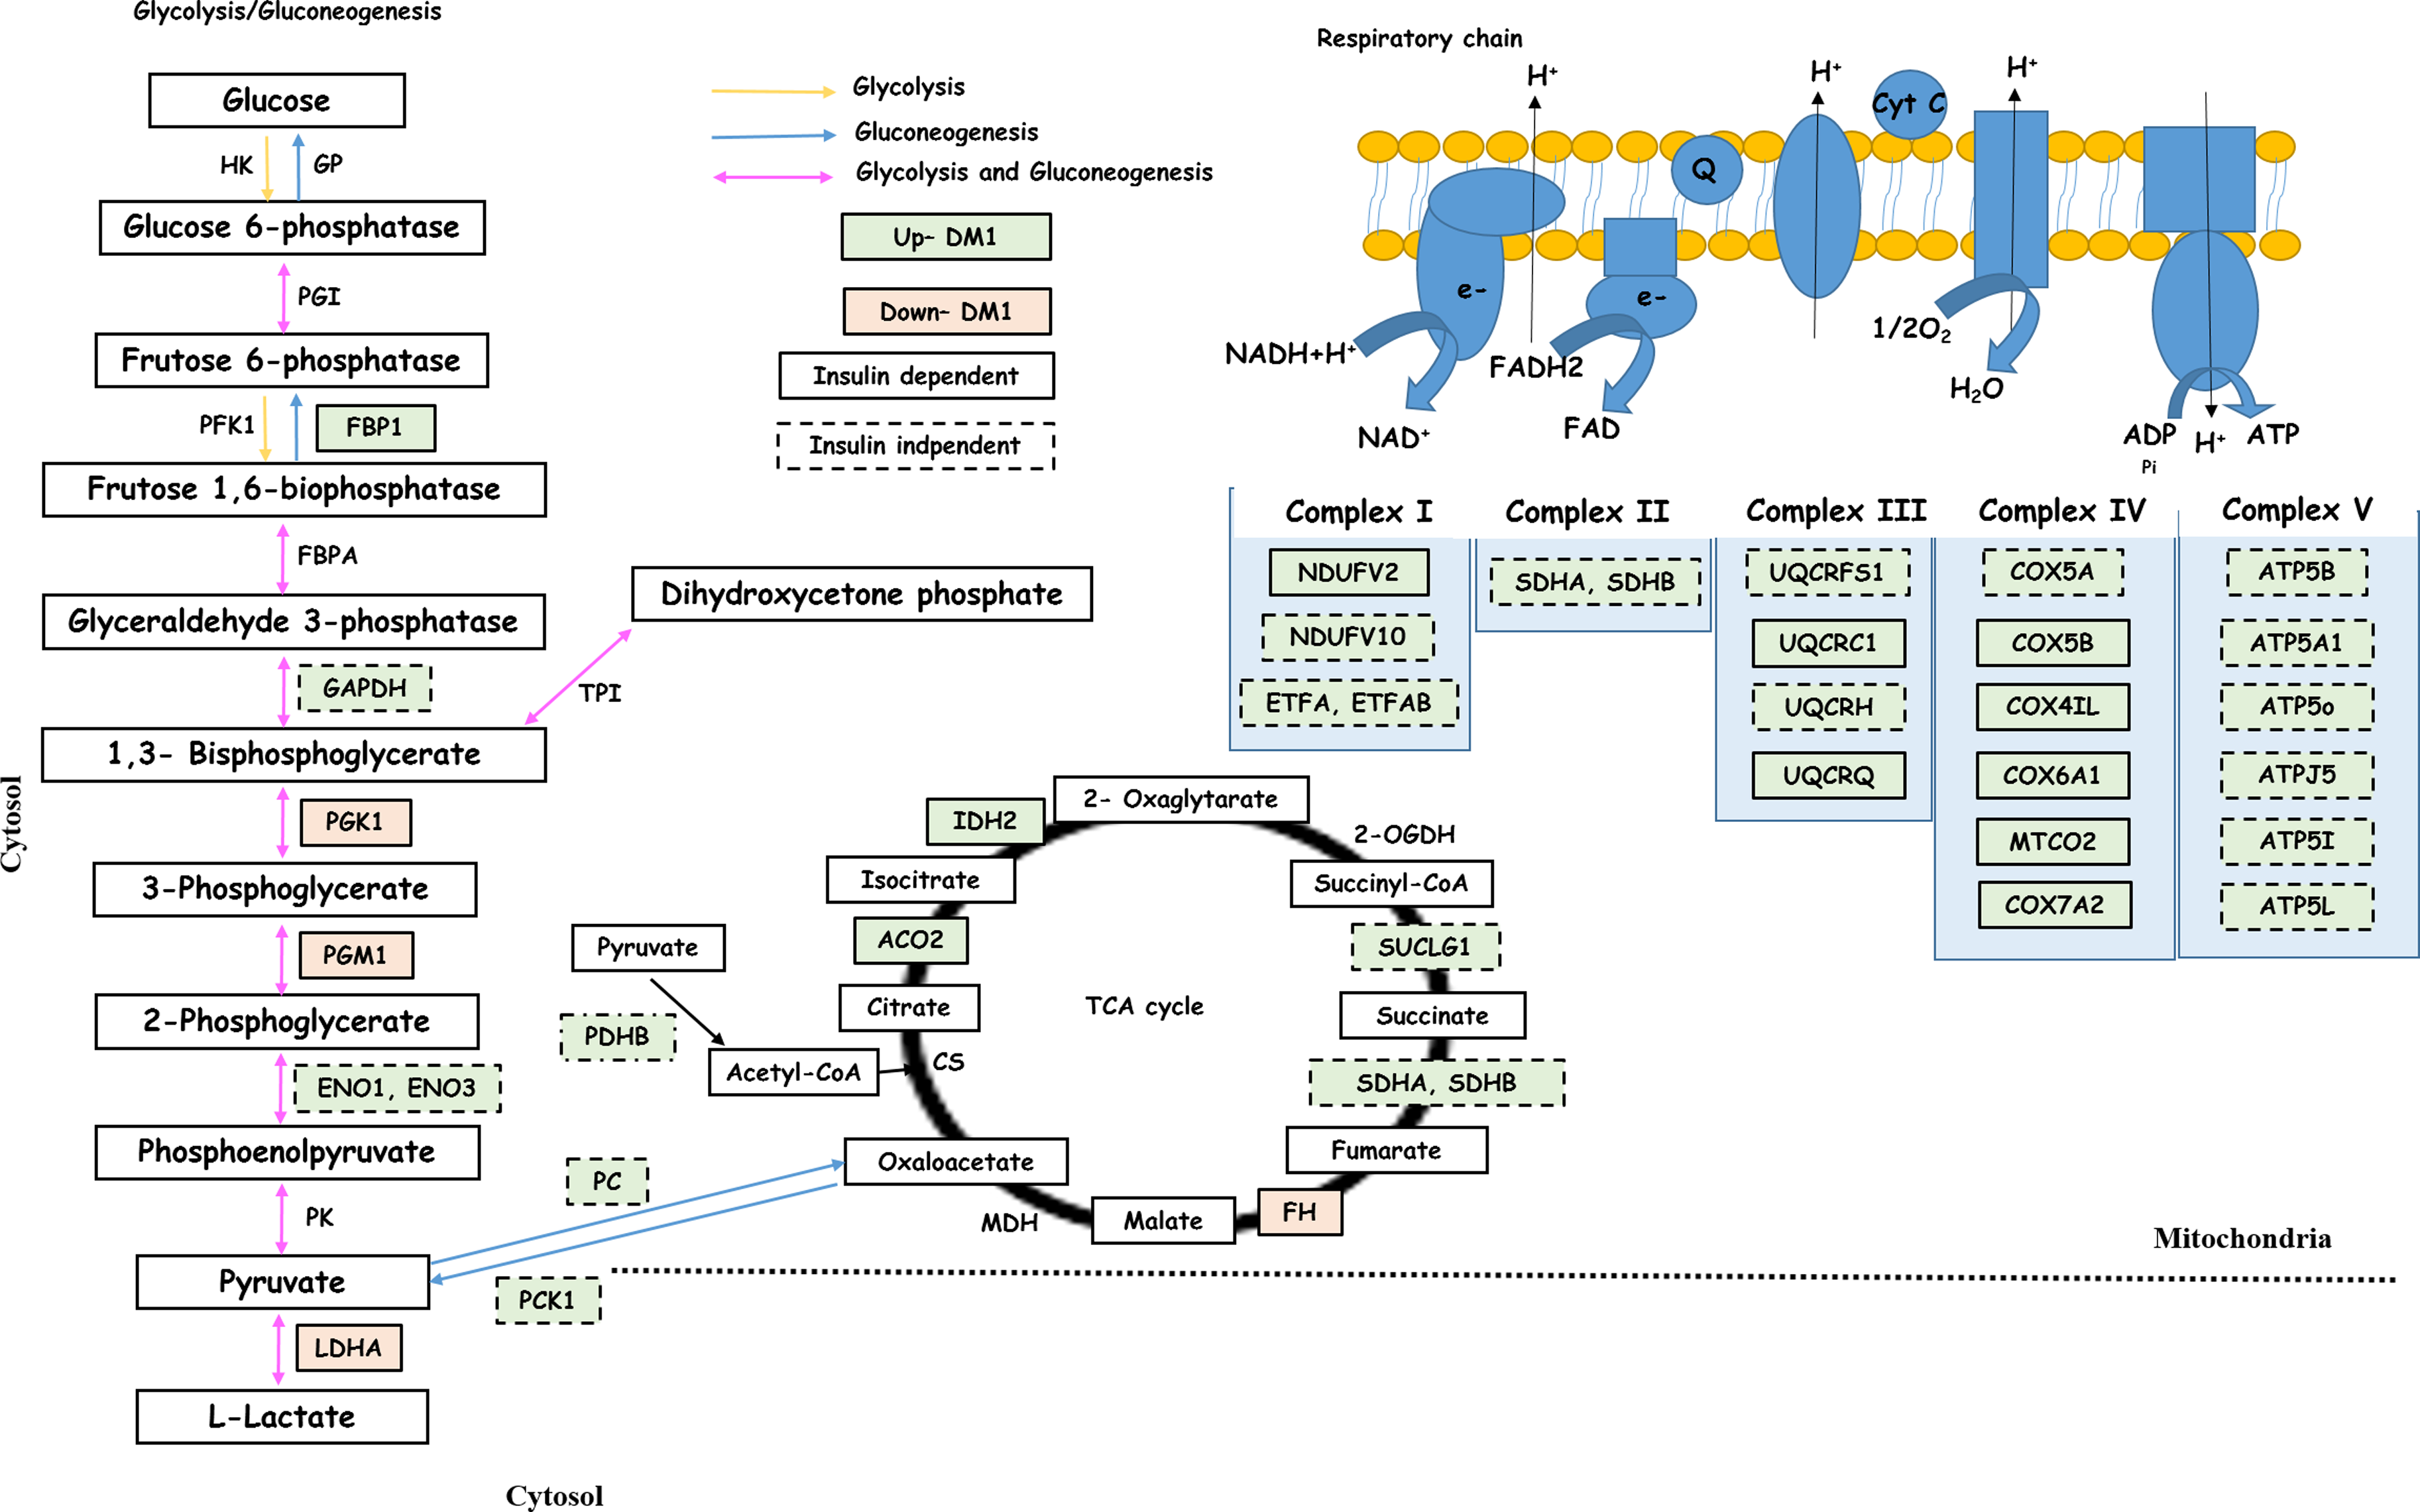
Glycolysis/Gluconeogenesis, TCA cycle, and respiratory chain pathways associated with insulin-dependent and -independent genes related to DM1. The green color indicates upregulation and orange color downregulation in DM1. Based on insulin condition, the box with complete trace indicates that the gene is insulin dependent and traced box indicates insulin-independent genes. Gluconeogenesis: blue arrow; and Gluconeogenesis/glycolysis: purple arrow. The levels of Fbp1 in gluconeogenesis were restored with insulin treatment, while Pc was insulin independent and its involvement in initial steps of gluconeogenesis can be how oxaloacetate enters and maintains intermediates of the TCA cycle. In the TCA cycle, the majority of enzymes were insulin dependent, explained as an anapleurotic response to maintain intermediates of the TCA cycle in response to insulin. The TCA cycle generates reducing equivalents that are used by the ETC to ultimately produce ATP. TCA, tricarboxylic acid. ETC, electron transport chain.
Insulin treatment in the DM + I group restored both enzymes to control levels. Previous studies have reported increased hepatic and renal FBP1 protein abundance in diabetic rats (Allerston et al., 2013; Punithavathi et al., 2008; Ramesh et al., 2006) and a correlation between PCK1 activity and glycemic control (Gomez-Valades, 2008). Additional studies have also reported increased FBP1 and PCK1 protein abundance in models of DM that were restored to steady-state levels upon insulin treatment (Chakravarty et al., 2005; Liu et al., 2010; Veneziale et al., 1983).
Phosphoglycerate kinase 1 (PGK1, 1.25-fold decrease), glycerol-3-phosphate dehydrogenase (NAD(+), GPD1, 1.66-fold decrease), and phosphoglucomutase-1 (PGM1, 1.74-fold decrease) were found to be decreased in the DM1 group (Fig. 3). Lower levels suggest potential mitochondrial dysfunction and increased demand for NADPH generation by the pentose phosphate pathway, indicating high levels of oxidative stress.
In addition, increased abundance of lactoylglutathione lyase (GLO1) is associated with oxidative stress and production of AGEs. The abundance of GLO1 was found to be decreased in the DM1 group (1.31-fold decrease) and restored to control levels in the insulin-treated group. Previous studies have shown similar levels of GLO1 associated with high-glucose levels in the formation of AGEs and AGE precursors such as methylglyoxal and glyoxal in DM1 that were reversed by insulin treatment (Kim et al., 2012).
In DM1, TCA cycle induction has been correlated with the development of mitochondrial respiratory dysfunction, hepatic oxidative stress, and inflammation. Three enzymes—mitochondrial aconitate hydratase (ACO2, 1.75-fold increase), mitochondrial fumarate hydratase (FH), and cytoplasmic isocitrate dehydrogenase (NADP, IDH1)—that function in the TCA cycle were shown to have altered abundance in the DM1 group and were restored to control levels in the DM + I group (Fig. 3).
In contrast to the results presented here, previous examination of diabetic models has not reported altered abundance of the abovementioned enzymes (Bugger et al., 2009; Johnson et al., 2009). However, insulin dependence of these enzymes can be explained by the fact that they provide mitochondrial-derived substrates for elevated glycolysis and decrease electron deposition related to oxygen species production.
Two isoforms of NADH dehydrogenase (complex II of electron transport chain, ETC) had increased abundance in the DM1 group and were restored to control levels in the insulin-treated group, including flavoprotein 2 (NDUFV2, 1.59-fold increase) and 1 alpha subcomplex subunit 10 (NDUFA10, 1.47-fold increase) (Fig. 3).This suggests that insulin plays a role in the activation of mitochondrial oxidative phosphorylation in this experimental model of DM1. In addition, related to the ETC, nine isoforms of cytochromes were identified to have altered abundance in the DM1 group and were restored to control levels upon insulin treatment in the DM1 group.
Four of these cytochrome oxidases are present in complex IV of the ETC. To our knowledge, none of the alterations in ETC enzyme abundance have been previously reported. These cytochromes are the primary system for chemical defense in animals (Gillam, 1998); therefore, insulin treatment may be associated with decreasing ROS generation and oxidative stress. Conclusively, the normalization of protein abundance in the ETC in the DM + I group suggests that insulin increases the efficiency and maintenance of electron transport and the production of energy.
Insulin-independent changes in protein abundance
Pyruvate carboxylase, which regulates hepatic glucose production by catalyzing the first step in gluconeogenesis (Jitrapakdee et al., 2008), displayed increased abundance (PC, 1.19-fold increase) in both DM1 and insulin-treated DM1+I groups (Fig. 3). Contrary to results presented here, previous studies have not reported an increase in PC abundance upon insulin treatment. Our data suggest that PC may be involved in anapleurotic reactions, bypassing acetyl-CoA produced from fatty acid β-oxidation (FAO) that has an inhibitory effect on pyruvate dehydrogenase, to maintain TCA cycle intermediates such as producing oxaloacetate from pyruvate.
Additionally, three enzymes involved in glycolysis and gluconeogenesis, including alpha-enolase (ENO1, 1.22-fold increase), beta-enolase (ENO3, 1.38-fold increase), and glyceraldehyde-3-phosphate dehydrogenase (GAPDH, 1.34-fold increase) were identified as insulin independent (Fig. 3). These enzymes, however, participate in reversible reactions and their increased abundance in the DM1 group may reflect increased gluconeogenesis, while the insulin-treated group may be reflective of glycolytic activation and higher metabolic flux by constant supply of insulin.
Most of the enzymes involved in the TCA cycle were found to have increased abundance in both DM1 and DM1+I groups compared with control (Fig. 3). The insulin independence of TCA cycle enzymes may be related to that of PC insulin independence, bypassing acetyl-CoA, to maintain the intermediates of TCA cycle by promoting oxaloacetate generation from pyruvate upon a constant insulin treatment.
Current literature does not report L-xylulose reductase (DCXR, 1.38-fold increase) alterations associated with diabetes; however, this enzyme has been reported to have increased abundance in prostate cancer and is associated with melanoma progression (Matsunaga et al., 2008). The DCXR reaction produces NADPH, therefore it may also be attributed to increasing NADPH within the cell to combat oxidative stress.
ATP serves as a signal molecule in many cells (Corriden and Insel, 2010). Recent studies have shown that in STZ-induced type 1 diabetic mice, hepatic ATP is significantly reduced (Miyamoto et al., 2008). On the other hand, studies have also shown that cellular oxygen consumption along with hepatic ATP production is increased under diabetic conditions (Bugger et al., 2009; Petersen et al., 2004). Six proteins associated with ATP synthase also displayed increased abundance in both DM1 and DM1+I groups, suggesting that independent of insulin, the increased ATP synthase abundance could potentially result in increased ATP generation and suppression of glycolysis, promoting gluconeogenesis, to store glucose and ameliorate hyperglycemia present in DM1.
Hydroxymethylglutaryl-CoA lyase was also revealed to have increased abundance in DM1 and insulin-treated groups (HMGCL, 1.47-fold increase). HMGCL is a cytoplasmic enzyme and higher levels suggest that acetoacetate synthesis can occur in the cytoplasm, creating a surplus of acetyl-CoA when lipogenesis is inhibited.
Increased abundance of adenosine kinase (ADK, 1.24-fold increase) was found in both DM1 and DM1+I groups, suggesting an association of ADK with glucose levels. However, previous study showed that 10 days after the STZ injection, there was twofold increase in hepatic ADK content and administration of insulin decreased ADK levels under normal conditions (Williamson et al., 1968).
Lipid metabolism
Insulin-dependent changes in protein abundance
In DM1, both hepatic gluconeogenesis and ketogenesis are excessive (McGarry, 1992). Currently, a major area of interest is focused on the elevated FFAs and activation/regulation of enzymes participating in FAO and gluconeogenesis (Kurtz et al., 2000). Hepatic FAO is increased in DM1 for ATP generation. The enzymes upregulated in FAO can promote undesired ketogenesis with excessive production of acetyl-coA by increased FAO.
This fact is supported by the increased abundance of four enzymes, including mitochondrial trifunctional enzyme subunit beta (HADHB, 1.24-fold increase), mitochondrial enoyl-CoA hydratase domain-containing protein 3 (ECHDC3, 1.67-fold increase), mitochondrial 2,4-dienoyl-CoA reductase (DECR1, 1.94-fold increase), and mitochondrial delta[3,5]-delta[2,4]-dienoyl-CoA isomerase (ECH1, 2.67-fold increase). These four enzymes in the FAO pathway therefore supply the TCA cycle with acetyl-CoA. The levels of all four enzymes are restored to control levels by insulin treatment, suggesting that insulin may decrease acetyl-CoA provided by FAO.
Sulfotransferase 1 family member D1 (SULT1D1, 1.31-fold increase) abundance was increased in the DM1 group and restored to control levels in the DM1+I group. Previous exploration of the diabetic state reported similar alterations in sulfotransferases and indicated that these changes occurred concomitantly with shifts in glucose metabolism, ketone homeostasis, protein kinase C isoforms, and P450 metabolism (Runge-Morris, 1997).
DM1 is also associated with accumulation of intermediates of fatty acid metabolism and their accumulation in the liver (Rossi et al., 2012). Apolipoprotein A-I (APOA1) participates in the transport of cholesterol from peripheral tissues to the liver. Previous studies have shown negative correlation between plasma glucose and Apoa1 protein abundance (Haas et al., 2000). Increased abundance of APOA1 (1.72-fold increase) was found in the DM1 group and restored to control levels in the DM1+I group, suggesting that insulin treatment restored normal blood glucose levels in the models studied.
On the other hand, nonspecific lipid transfer protein (SCP2, 1.26-fold decrease) was downregulated in the DM1 group. These changes in both APOA1 and SCP2 suggest that they may be responsible for aberrant transfer of all common diacylglycerophospholipids and cholesterol, as well as glycosphingolipids and gangliosides, between membranes (Van Amerongen et al., 1989), promoting the development of steatosis of liver.
Insulin-independent changes in protein abundance
Eight enzymes directly functioning in FAO displayed increased abundance in DM1 and DM + I groups. Previous studies have not shown similar patterns of FAO enzymes; however, the lipotoxicity generated in the diabetic state may be influenced by other factors of insulin treatment. The insulin independence suggests that mitochondrial hydroxymethylglutaryl-CoA synthase (HMGCS2, 1.47-fold increase) may be involved in supplying ketone bodies through FAO as an alternative carbon source to glucose (Aledo et al., 2006).
Chaperone and oxidative stress
Insulin-dependent changes in protein abundance
Uncontrolled diabetes generates a multitude of physiological alterations, including dyslipidemia, modification of proteins and lipids, and perturbations in the tissue antioxidant defense, resulting in oxidative stress (Atalay et al., 2004).
Enzymes involved in ROS scavenging and protecting against oxidative stress, such as peroxiredoxin-1 and 4 (PRDX1, 1.30-fold decrease and PRDX4, 1.72-fold decrease), superoxide dismutase (Cu-Zn-Sod1, 1.54-fold decrease), catalase (CAT, 1.81-fold decrease), and glutathione S-transferase theta-2 (GSTT2, 1.32-fold decrease), were decreased in abundance in the DM1 group and were restored to control levels in the DM1+I group. Therefore, the cellular oxidative stress caused by increased ROS generation and the inability to combat it may cause oxidative damage to cellular macromolecules, such as proteins, and is ameliorated by insulin treatment (Sano et al., 1998).
Carbonic anhydrase 3 (CA3, 14.22-fold decrease) might function to protect cells from oxidative damage (Kowluru and Veluthakal, 2005; Raisanen et al., 1999). Previous examination also reported decreases in CA3 abundance in liver of diabetic rats, which were restored to control levels by administration of insulin (Vesely et al., 1979). Aldehyde oxidase 1 (AOX1, 1.62-fold decrease) was downregulated and is insulin dependent. Increased Aox1 has been associated with ROS generation and oxidative liver injury (Ghaffari et al., 2012). Similarly, previous examination has reported a significant increase in AOX1 in STZ-induced DM1 rats; however, the insulin was not examined in this study (Ghaffari et al., 2012).
Insulin-dependent changes in protein abundance
HSPS, also known as stress proteins, function to protect proteins, lipids, and nucleic acids from damage and denaturation (Hooper, 2003). The crucial role of HSPS in diabetes is their ability to counteract the denaturation of tissue proteins and defense mechanisms: processes that may contribute to diabetes complications (Kurtz et al., 2000).
Five Hsps had increased abundance and one had decreased abundance in both DM1 and DM1+I groups. The proteins with increased abundance include 60 kDa (HSPD1, 1.26-fold increase), 70 kDa (HSPA2, 1.53-fold increase), mitochondrial stress-70 protein (HSPA9, 1.22-fold increase), 10 kDa (HSPE1, 1.33-fold increase), and 70 kDa protein 1-like (HSPA1L, 1.24-fold increase). Increased Hsp abundance indicates a general stress response to damage and oxidative stress observed in DM1 and DM1+I.
Disturbance of antioxidant defense mechanisms present in uncontrolled DM1 creates an imbalance in cellular redox state and oxidative stress (Furuhashi et al., 2011). In the present study, PRX2 and PRX5 were shown to have increased abundance (1.22 and 1.39-fold increase). PRX2 and PRX5 protect against oxidative stress-induced apoptosis in DM1 (Zhao and Wang, 2012). Interestingly, insulin treatment in the DM1+I group did not restore the PRX proteins to control levels. In contrast to the results obtained in the current study, Bast et al. (2002) reported upregulation of PRX1 and PRX2, but not PRX5, in cultured insulinoma cells exposed to diabetes-inducing xenobiotics (STZ and aloxan) (Bast et al., 2002).
The thioredoxin (TRX) antioxidant system utilizes NADPH as a cofactor to protect cells from oxidative stress (Advani et al., 2009). Other studies have reported that high-glucose levels induce an increase in TRX expression (Advani et al., 2009). Similarly, TRX displayed an increased abundance in DM1 and DM1+I groups. This suggests that insulin can control high glucose, but cannot restore TRX protein alteration.
Conclusions and Expert Outlook
Large-scale proteomic studies are of great importance to understand the pathophysiology that occurs within a diseased state, including DM1. Examination of protein abundance is the initial step in establishing pathways that may be altered in DM1, resulting in the observed pathophysiology. Using the STZ-induced rat model of DM1 and insulin treatment, along with literature analysis, granted an insight into potentially affected hepatic pathways that play a role in the disease state and are either insulin independent or insulin dependent: information that will prove invaluable in furthering the understanding of alterations in DM1.
Gluconeogenesis was reestablished to normal levels in the DM1 group by insulin treatment suggested by restoration of the gluconeogenesis regulatory enzyme, FBP1. Pc participating in the initial steps of gluconeogenesis was insulin independent. This response may be related to the conversion of pyruvate to oxaloacetate to maintain TCA cycle intermediates. The activity of PC is largely dependent upon acetyl-CoA levels; it is inhibited by acetyl-CoA. Therefore, it would be expected that as acetyl-CoA levels decrease, as would be probable with insulin-dependent decrease in FAO enzymes, PC levels would also decrease. The observed insulin independence and 1.19-fold increase in Pc may be explained by multiple factors.
For instance, the diabetic state induced by STZ may create a completely altered homeostatic switch that is irreversible with insulin treatment and thus Pc is not restored to control levels, irrespective of its function in gluconeogenesis.
Interestingly, the abundance of several enzymes that function in both gluconeogenesis and glycolysis displayed insulin independence. These enzymes play a larger role in the activation of gluconeogenesis in the absence of insulin and stimulate glycolytic flux in the presence of insulin. Similarly, insulin-dependent enzymes are associated with activation of glycolysis and general bioenergetics under insulin treatment. The majority of the enzymes of the TCA cycle displayed insulin dependence. This may be explained as an anapleurotic response to maintain TCA cycle intermediates for energy generation and/or anabolic processes in response to insulin.
The abundance of proteins in the ETC, specifically complexes I, II, and V, was insulin independent and consequently results in mitochondrial ROS generation and an oxidative environment within the cell. Restoration of the blood glucose levels by insulin treatment affects the abundance of enzymes that function in detoxification of ROS, restoring the redox balance and mitochondrial function.
Footnotes
Acknowledgment
The authors thank the São Paulo Research Foundation, FAPESP, Processes 2011/21672-1 and 2014/14249-3.
Author Disclosure Statement
The authors declare that no competing financial interests exist.
Abbreviations Used
References
Supplementary Material
Please find the following supplemental material available below.
For Open Access articles published under a Creative Commons License, all supplemental material carries the same license as the article it is associated with.
For non-Open Access articles published, all supplemental material carries a non-exclusive license, and permission requests for re-use of supplemental material or any part of supplemental material shall be sent directly to the copyright owner as specified in the copyright notice associated with the article.