




Abstract
Abstract
Coronary artery disease (CAD) is a significant contributor to global health burden. Adiponectin gene single nucleotide polymorphisms (SNPs) have been associated with CAD susceptibility, but with inconsistent results across the studies. We present, in this study, an updated meta-analysis to discern the genetic susceptibility of adiponectin SNPs in relation to CAD. PubMed and EMBASE databases were used to identify the relevant published articles using the Preferred Reporting Items for Systematic Reviews and Meta-Analyses (PRISMA) guidelines. Pooled odds ratios and 95% confidence intervals were generated to assess the strength of the associations. Thirty-five articles with a total of 28,947 participants (mean age 55.3 years, 11,632 cases/17,315 controls, 19,443 males/8353 females, and 1151 persons with unspecified gender data) were included. The dominant, recessive, and additive models were applied. We found that the SNPs +45T>G (rs2241766), −4034A>C (rs822395), and −11391G>A (rs17300539) were linked to CAD development. In addition, +276G>T (rs1501299) SNP was associated with a decreased susceptibility to CAD among Caucasians. We did not find an association between the CAD susceptibility and the −11377C>G (rs266729) SNP. These observations offer new potential genetic biomarker candidates in relation to CAD, and warrant further research in independent world populations.
Introduction
C
Adiponectin is therefore considered as a preventive factor for CAD (Vaiopoulos et al., 2012; Zhang et al., 2012). In 2009, a genome-wide association study demonstrated that serum adiponectin level was associated with the single nucleotide polymorphisms (SNPs) of adiponectin (3q27) (Richards et al., 2009). Since then, more than 30 original studies and meta-analyses have demonstrated a correlation between adiponectin variants and CAD among different populations (Shen et al., 2015). However, the conclusion so far remains inconsistent.
To further confirm the relationship between adiponectin SNPs and CAD, we conducted the present systematic review and meta-analysis in a large sample of 28,947 participants, focusing on the following five SNPs at adiponectin: +45T>G (rs2241766), +276G>T (rs1501299), −4034A>C (rs822395), −11377C>G (rs266729), and −11391G>A (rs17300539), due to their susceptibilities to CAD and existence of enough publications. The dominant, recessive, and additive models were applied, and the comparisons of allelic frequencies were further included in this study.
Materials and Methods
Search strategy and inclusion criteria
We followed the Preferred Reporting Items for Systematic Reviews and Meta-Analyses (PRISMA) guidelines, as utilized in previous systematic reviews published in the Journal (Ameh et al., 2017). The PRISMA Checklist was presented in Supplementary Table S1.
PubMed and EMBASE databases were used to search for eligible studies published before October 31, 2016. The search strategy was based on a combination of the following terms: “coronary artery disease” or “CAD” or “coronary heart disease” or “CHD” or “ischemic heart disease” or “IHD” or “myocardial infarction” or “MI,” “adiponectin gene” or “ADIPOQ” and “polymorphism” or “variant” or “mutation.” Additionally, publications cited in the retrieved articles were screened.
Two authors (H.H. and L.Z.) independently reviewed all retrieved publications and citations, then evaluated the quality of each study with the predefined scale for quality assessment (Supplementary Table S2), which was designed in strict accordance with the scoring form of meta-analysis (Thakkinstian et al., 2005). The inclusion criteria for eligible studies were as follows: (1) case–control studies; (2) genotype distributions and source of participants are available; (3) as to the overlapping reports, the recent data or larger sample result were collected; and (4) English language publications.
Data extraction
Original data were independently extracted by H.H. and L.Z. using standardized data extraction forms. Contested issues in data extraction were resolved by the third colleague (Z.S.). The following information was retrieved from the included studies: author names, the year of publication, the characteristics of participants, method of genotyping, number of individuals, distribution information of genotype, and allelic frequency.
Statistical analyses
All statistical analyses were performed with Stata 14.0 (StataCorp, College Station, TX). The pooled odds ratios (ORs) and 95% confidence intervals (CIs) were used to quantitatively evaluate the relationship between adiponectin SNPs and CAD risk under dominant, additive, and recessive models, and also for allelic frequency contrast. Subgroup analyses were performed based on ethnicity (i.e., Arabian, African, Asian, Caucasian, and South American) and disease background (i.e., CAD, myocardial infarction [MI], and type 2 diabetes mellitus [T2DM]). Z test was applied to identify the statistical significance of pooled ORs. Hardy–Weinberg equilibrium in the control group was assessed with chi-square test (χ2-test).
Cochran's Q-test and I2 statistic were used to evaluate heterogeneity across included studies. When p < 0.10 or I2 > 50%, the heterogeneity was considered significant, then a fixed-effects meta-analysis was performed. Otherwise, the random-effects meta-analysis was applied. Galbraith plot analysis was utilized to determine the outliers across involved studies. In this analysis, the studies within limit area were considered homogeneous, whereas the ones beyond limit area were outliers. The stability of result in each meta-analysis was detected with sensitivity analysis by removing each individual study sequentially or by omitting the outliers. The significance of publication bias was estimated by funnel plots analysis, and Egger's test was further complemented. A p-value <0.05 was considered representation of statistical significance.
Results
Eligible studies
The initial search returned 191 articles. Among them 156 publications were excluded for the following reasons: duplicated data, studies of animals, investigating irrelevant polymorphisms, not referring to CAD, not original studies, and no essential data. As outlined in Figure 1 and Table 1, we included 35 articles (Al-Daghri et al., 2011; Antonopoulos et al., 2013; Bacci et al., 2004; Boumaiza et al., 2011; Chang et al., 2009; Cheung et al., 2014; Chiodini et al., 2010; De Caterina et al., 2011; Du et al., 2016; Esteghamati et al., 2012; Filippi et al., 2005; Foucan et al., 2010; Gable et al., 2007; Gui et al., 2012; Hegener et al., 2006; Hoefle et al., 2007; Jung et al., 2006; Katakami et al., 2012; Lacquemant et al., 2004; Mofarrah et al., 2016; Mohammadzadeh et al., 2016; Oguri et al., 2009; Ohashi et al., 2004; Oliveira et al., 2012; Persson et al., 2010; Pischon et al., 2007; Prior et al., 2009, 2011; Qi et al., 2005; Rizk et al., 2012; Rodriguez-Rodriguez et al., 2011; Sabouri et al., 2011; Zhang et al., 2016; Zhong et al., 2010; and Zhou et al., 2011). A total of 28,947 participants (mean age of 55.3 years, 11,632 cases/17,315 controls, 19,443 males/8353 females, and 1151 participants with unspecified gender data) were involved in the present study. We enrolled 11,720 more participants than previously published meta-analyses on this related topic.
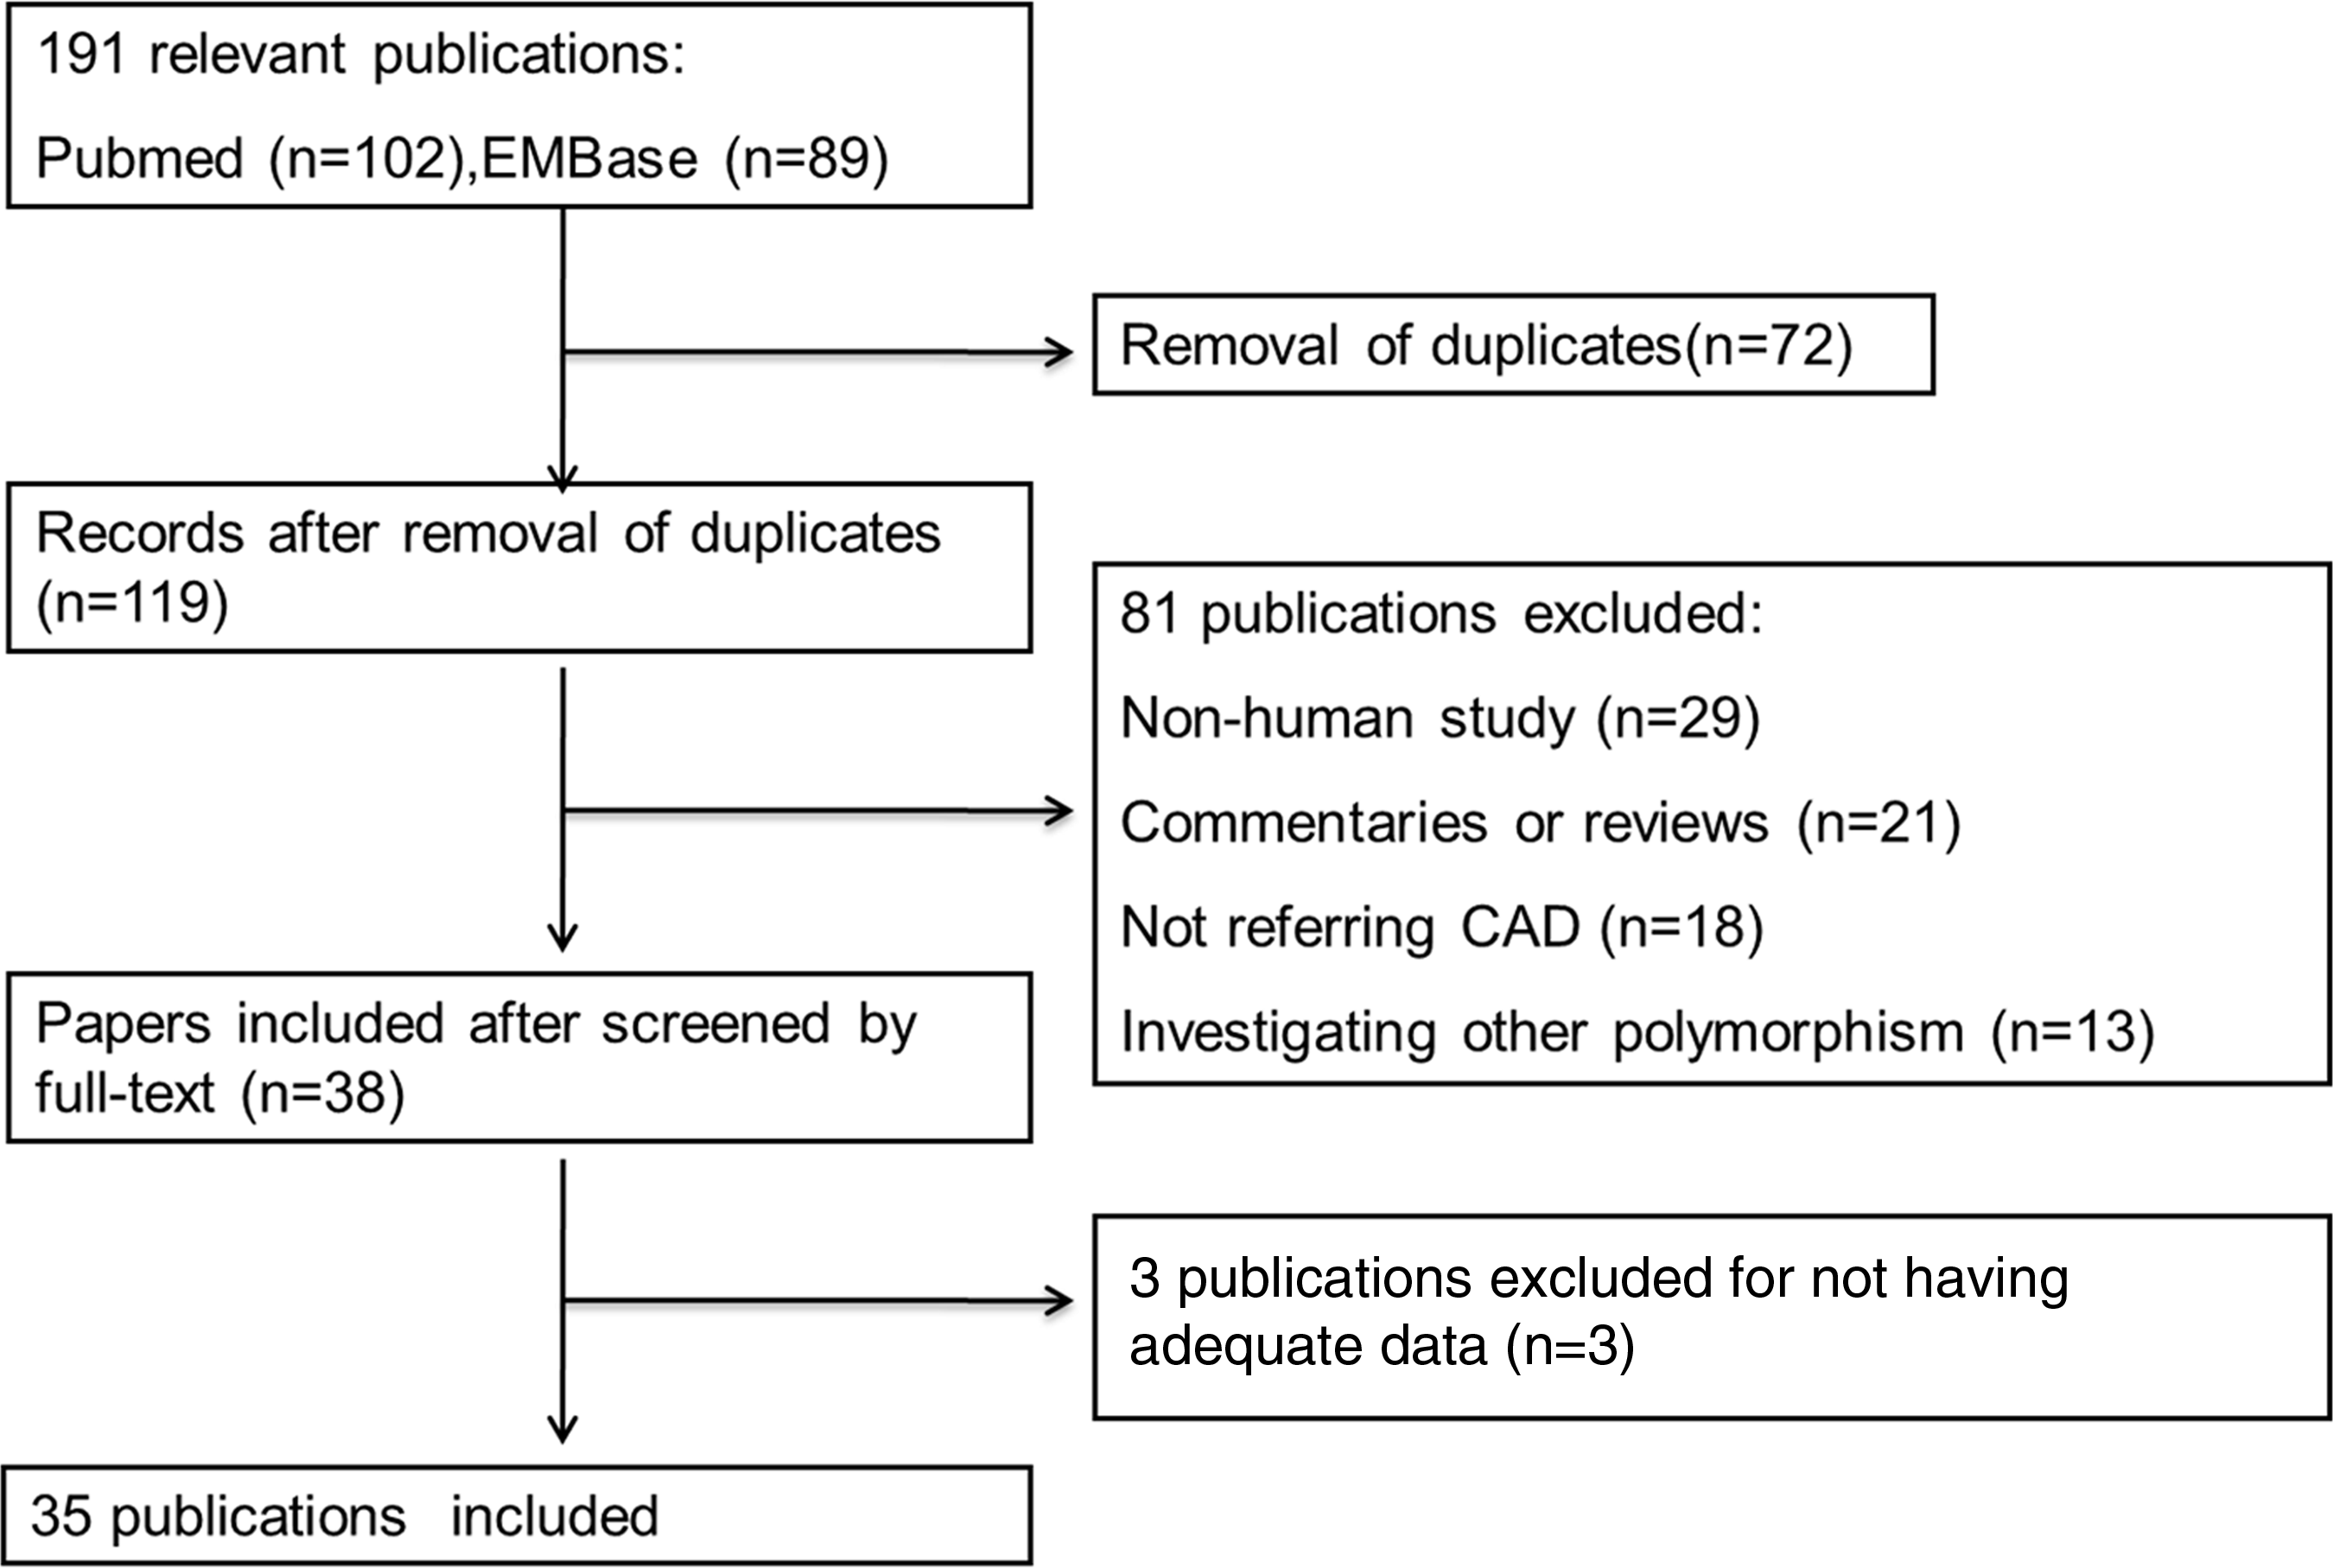
Flow chart for the process of searching and including studies.
ACS, acute coronary syndrome; CAD, coronary artery disease; MI, myocardial infarction; RA, rheumatoid arthritis; NFL, nonalcoholic fatty liver disease; T2DM, type 2 diabetes mellitus; T1DM, type 1 diabetes mellitus; NA, no reported baseline disease.
The detailed information of ethnicity of the subjects, source of individuals, and genotype frequency were listed in Table 1 and Supplementary Table S3. Among the 28,947 participants in the 35 studies, 8536 (in 11 studies) were CAD patients with concomitant T2DM, 550 (in 1 study) were CAD patients with nonalcoholic fatty liver disease, 674 (in 1 study) were CAD patients with rheumatoid arthritis, and 383 (in 1 study) were CAD patients with T1DM. For ethnic group distributions, 2306 (in 8 studies) were Arabians, 11,906 (in 11 studies) were Asians, 14,132 (in 15 studies) were Caucasians, and 603 (in 1 study) were South Americans.
Associations between +45T>G polymorphism and CAD
We included 23 studies published on the relationship between +45T>G polymorphism and CAD risk. Significant associations were found between +45T>G polymorphism and CAD under both allelic frequency contrast (OR = 1.22, 95% CI = 1.06–1.41, p = 0.007) and dominant model analysis (OR = 1.21, 95% CI = 1.04–1.39, p = 0.011). On the contrary, no significant associations were found under additive model (OR = 1.21, 95% CI = 0.88–1.67, p = 0.242) or recessive model (OR = 1.16, 95% CI = 0.86–1.56, p = 0.344) (Fig. 2 and Table 2).

Forest plot of the association between +45T>G (rs2241766) polymorphism and CAD under allelic frequency contrast. Each line represents one original study. The gray box shows the weight for each study. The black diamond shows the pooled OR and 95% CI. 95% CI, 95% confidence interval; CAD, coronary artery disease; OR, odds ratio.
To eliminate the heterogeneity across the included studies, we conducted subgroup analyses based on ethnic groups. Consequently, significant associations were observed among the Arabian populations, with the ORs (95% CIs) of 1.65 (1.12–2.42) for allelic frequency contrast, 2.35 (1.26–4.39) for additive model, 1.56 (1.03–2.35) for dominant model, and 2.29 (1.30–4.03) for recessive model analysis (Table 3).
95% CI, 95% confidence interval; Fix, fixed-effects meta-analysis model; OR, odds ratio; Ran, random-effects meta-analysis model; SNP, single nucleotide polymorphism.
CAD, cases were patients of coronary artery disease without accompanied disease; MI, cases were patients of myocardial infarction without accompanied disease; T2DM, the baseline status of subject was type 2 diabetes mellitus.
The associations were statistically significant (p < 0.05).
Furthermore, we performed subgroup analyses based on the disease background. The results showed that +45T>G polymorphism was significantly associated with CAD among T2DM patients under allelic frequency contrast (OR = 1.60, 95% CI = 1.14–2.25), and under additive (OR = 2.48, 95% CI = 1.23–4.98), dominant (OR = 1.42, 95% CI = 1.01–1.98), and recessive (OR = 2.27, 95% CI = 1.17–4.42) models, respectively (Table 3).
Associations between +276G>T polymorphism and CAD
We combined 22 eligible studies to analyze the associations between +276G>T polymorphism and CAD. Consequently, no significant associations were found under allelic frequency contrast (OR = 0.97, 95% CI = 0.88–1.07, p = 0.513), additive (OR = 0.87, 95% CI = 0.71–1.07, p = 0.193), dominant (OR = 0.99, 95% CI = 0.88–1.12, p = 0.930), and recessive models (OR = 0.87, 95% CI = 0.72–1.04, p = 0.125) (Fig. 3 and Table 2). Moreover, subgroup analyses did not return any significant association for other populations, except for Caucasians under the recessive model analysis (OR = 0.76, 95% CI = 0.58–0.99).
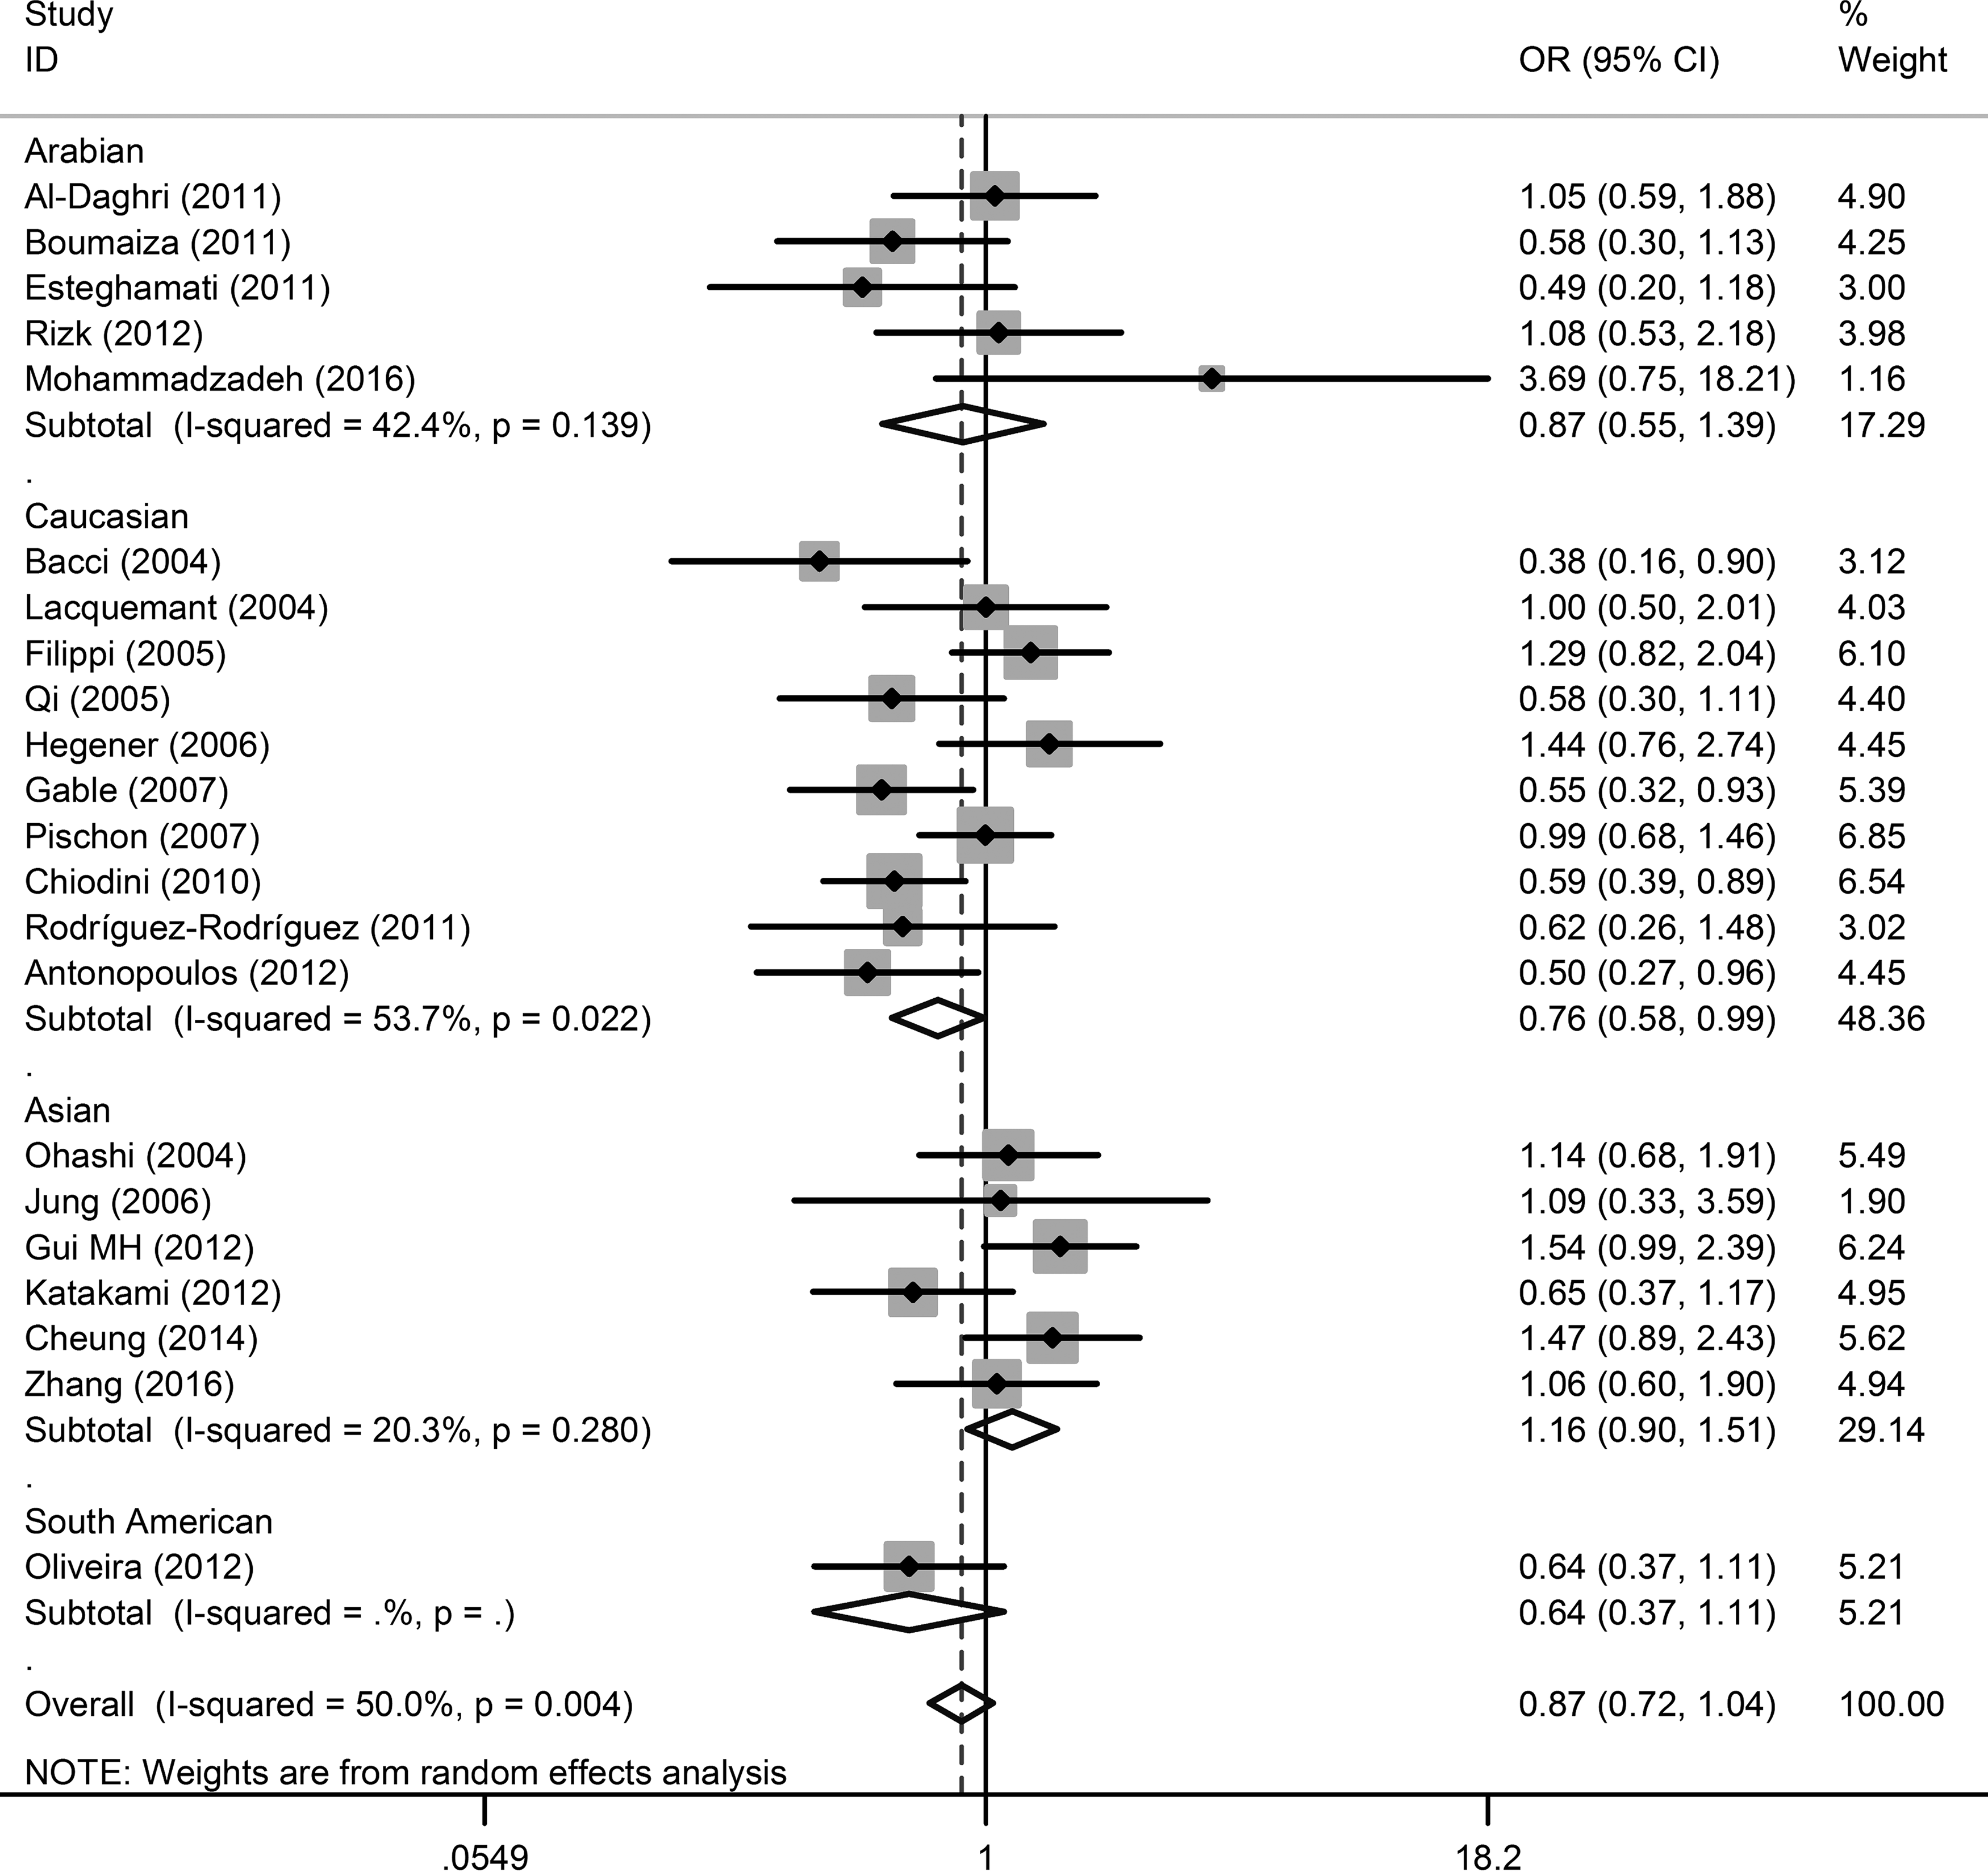
Forest plot of the association between +276G>T (rs1501299) polymorphism and CAD under recessive model analysis. Each line represents one original study. The gray box shows the weight for each study. The black diamond shows the pooled OR and 95% CI.
Associations between −4034A>C polymorphism and CAD
Seven studies matched the designated inclusion criteria for estimating the relationship between −4034A>C polymorphism and CAD. The combining results from these studies demonstrated a significant association under the additive model analysis, with the pooled OR of 1.19 (95% CI = 1.01–1.40, p = 0.040) (Fig. 4 and Table 2). Meanwhile, heterogeneity test across the seven studies showed no statistical significance. Subgroup analyses elucidated that −4034A>C polymorphism was significantly associated with CAD among Caucasians under the additive model (OR = 1.20, 95% CI = 1.02–1.43) (Table 3).
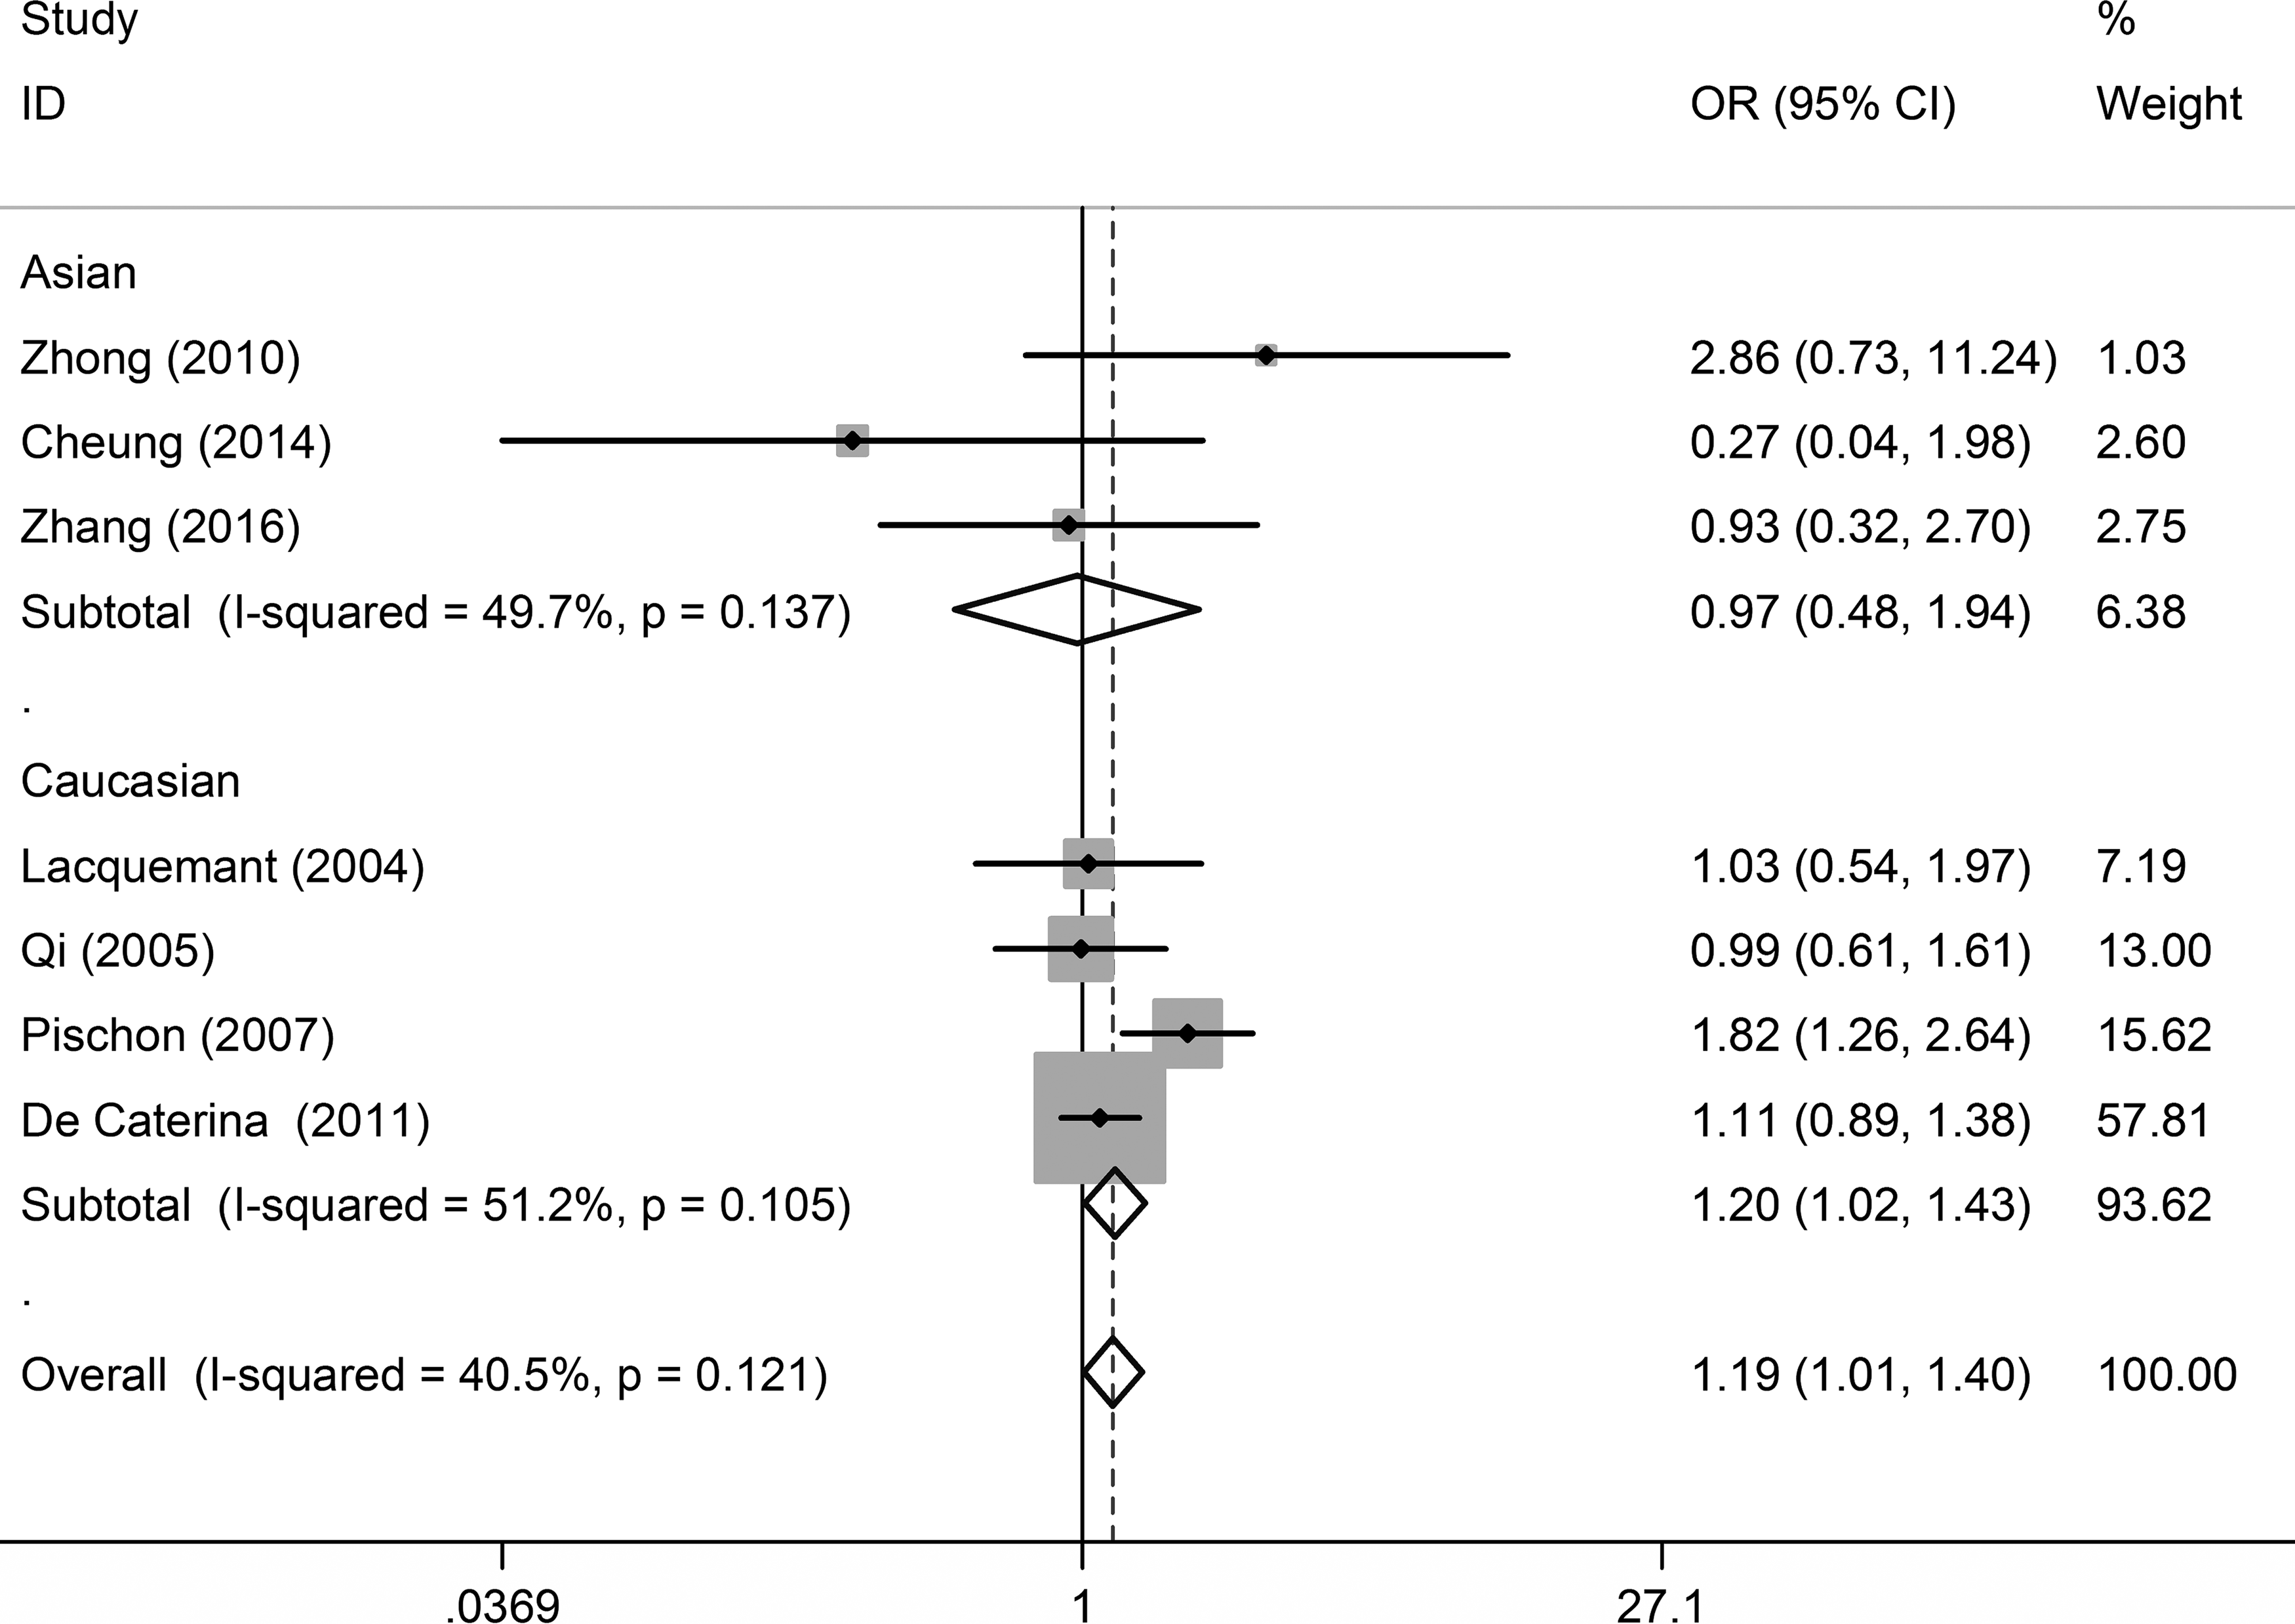
Forest plot of the association between −4034A>C (rs822395) polymorphism and CAD under additive model analysis. Each line represents one original study. The gray box shows the weight for each study. The black diamond shows the pooled OR and 95% CI.
Associations between −11377C>G polymorphism and CAD
Sixteen studies on the association between the −11377C>G polymorphism and CAD were enrolled in this meta-analysis (Fig. 5 and Tables 2 and 3). No significant associations were found under additive (OR = 1.19, 95% CI = 0.95–1.49, p = 0.126), dominant (OR = 1.12, 95% CI = 0.99–1.26, p = 0.077), recessive (OR = 1.15, 95% CI = 0.94–1.40, p = 0.173) model analyses, and allelic frequency contrast (OR = 1.09, 95% CI = 0.99–1.22, p = 0.091). Further subgroup analyses indicated no significant association either (Table 3).
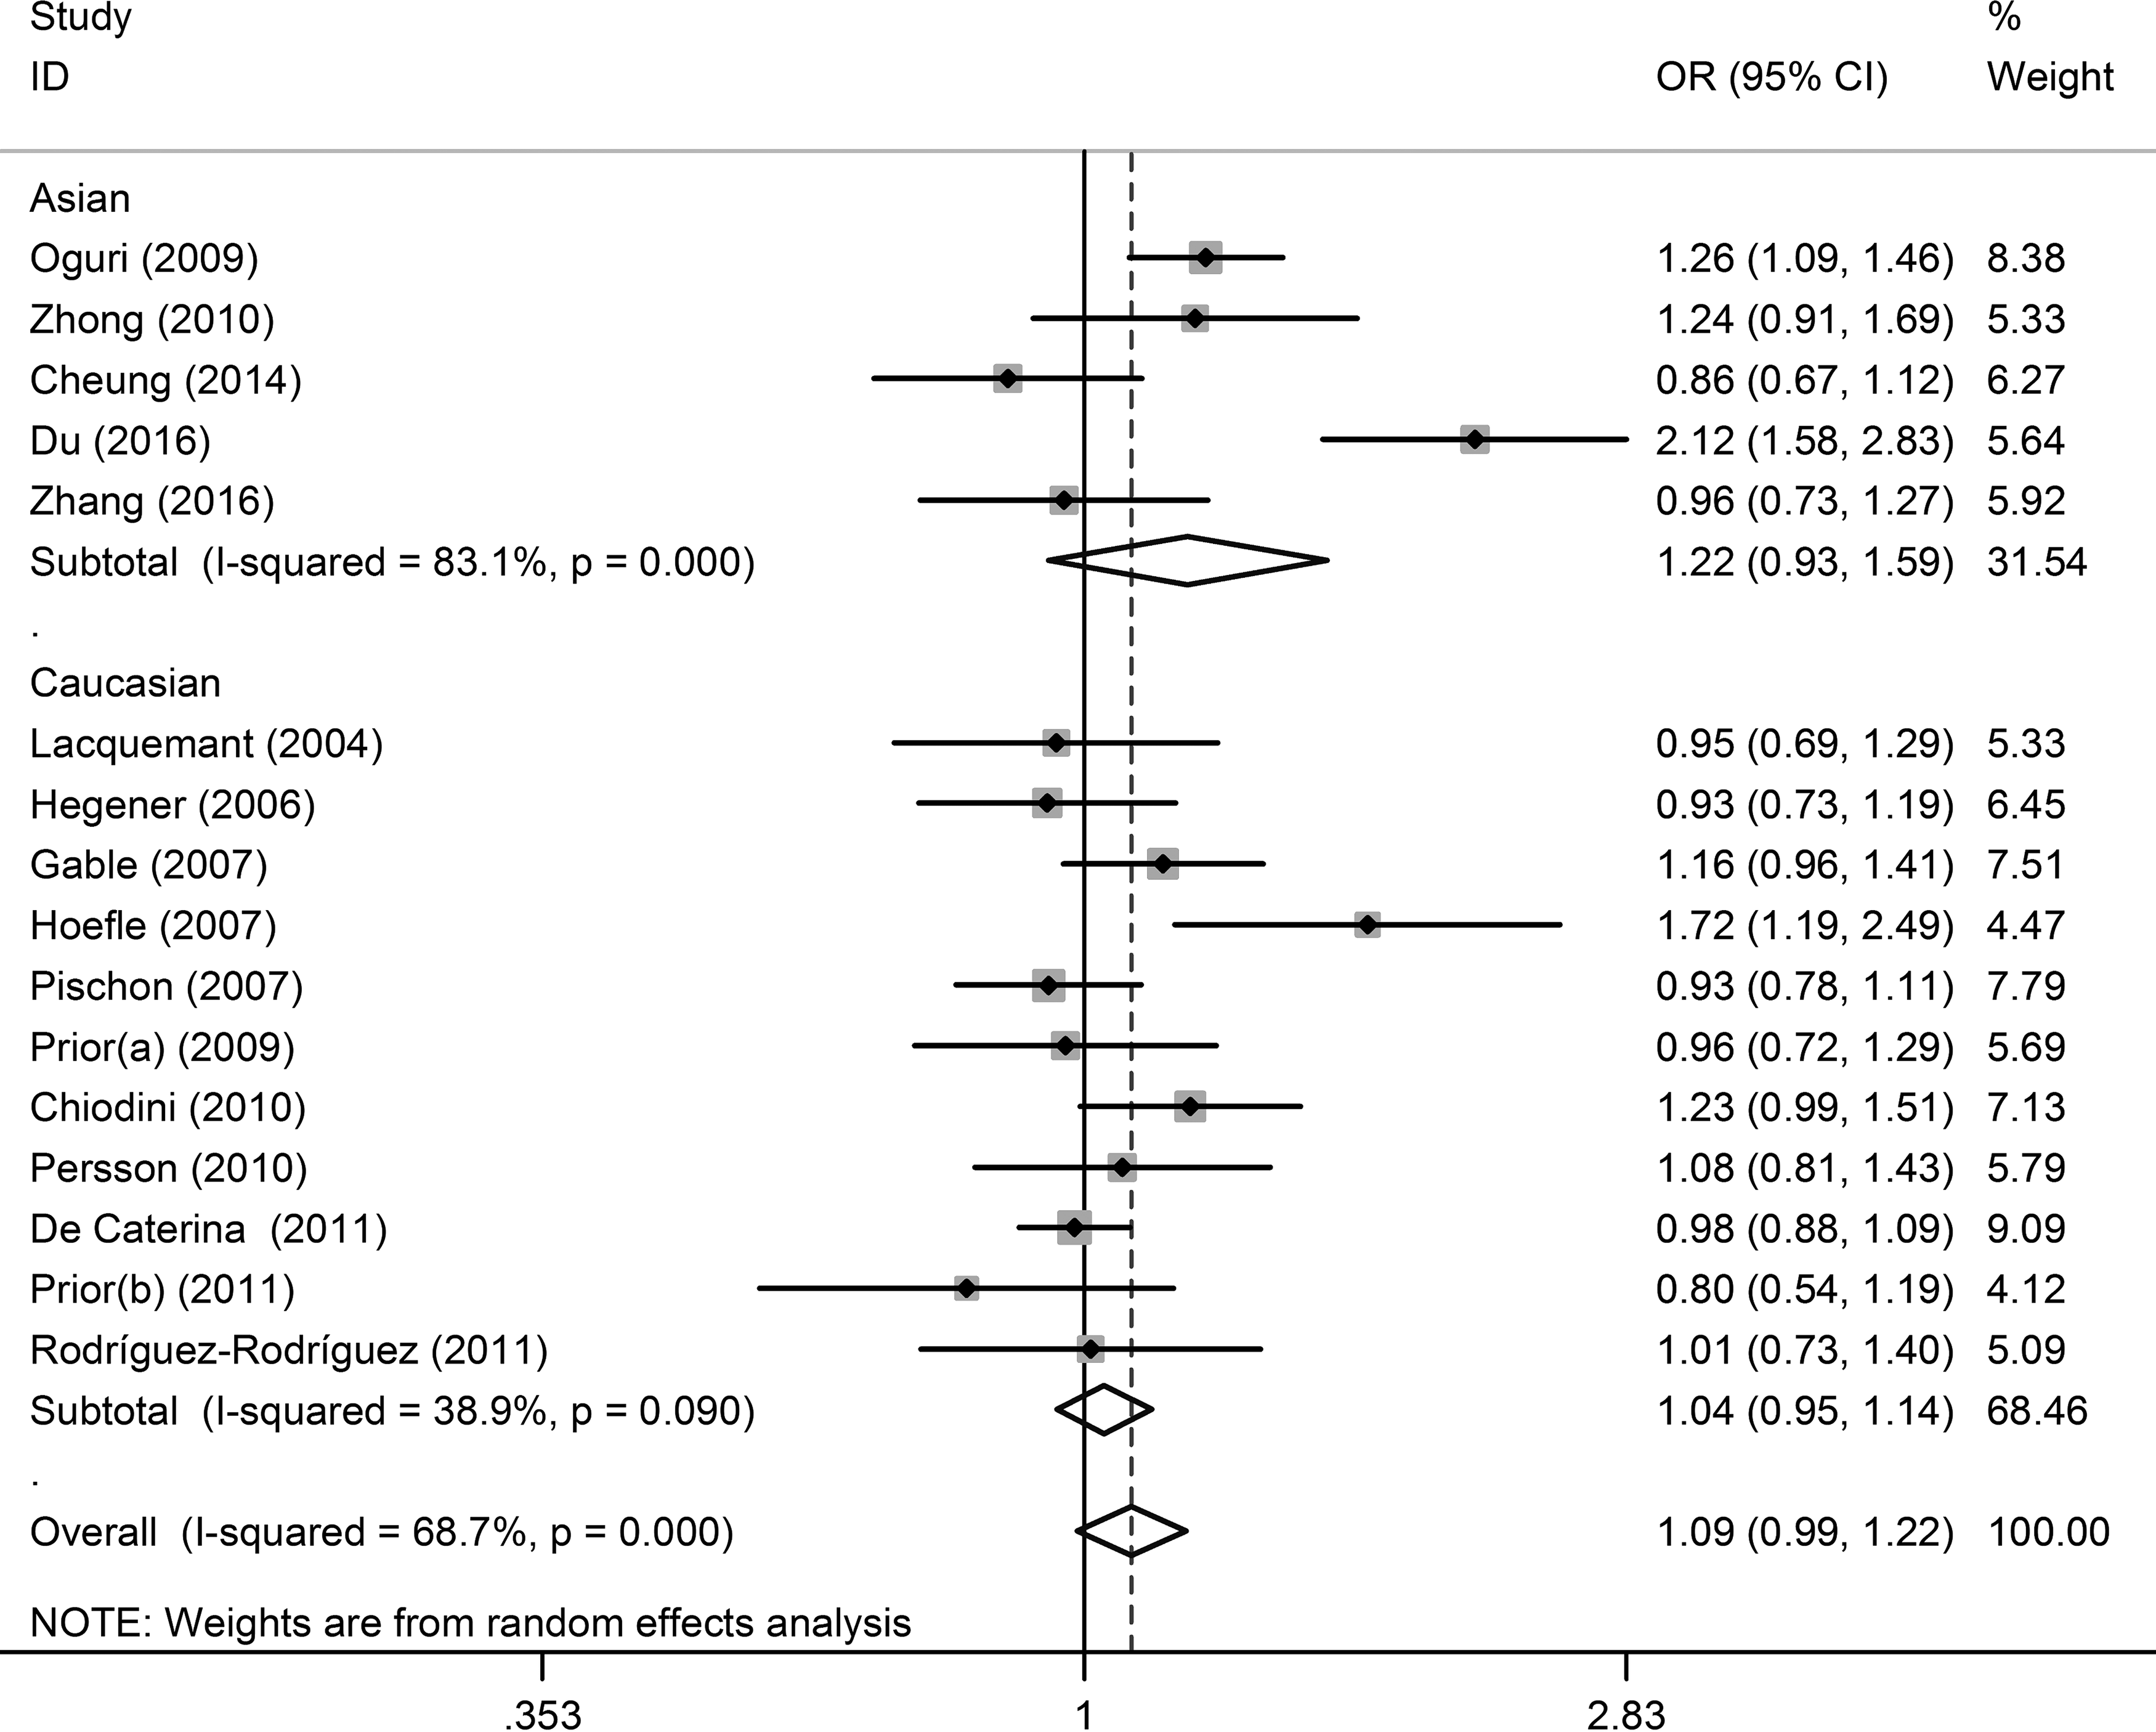
Forest plot of the association between −11377C>G (rs266729) polymorphism and CAD under allelic frequency contrast. Each line represents one original study. The gray box shows the weight for each study. The black diamond shows the pooled OR and 95% CI.
Associations between −11391G>A polymorphism and CAD
The synthesized results were statistically significant under additive model (OR = 2.14, 95% CI = 1.05–5.92, p = 0.039) (Fig. 6) and recessive model (OR = 2.56, 95% CI = 1.07–6.08, p = 0.034). However, the allelic frequency contrast and dominant model analysis did not return significant results (Table 2), and no significant heterogeneity was observed across four studies included.

Forest plot of the association between −11391G>A (rs17300539) polymorphism and CAD under additive model analysis. Each line represents one original study. The gray box shows the weight for each study. The black diamond shows the pooled OR and 95% CI.
Publication bias and sensitivity analysis
Funnel plot analysis, followed by Egger's test was implemented to detect potential publication bias. As shown in Supplementary Figure S1, the statistically significant publication bias was found in +45T>G polymorphism analyses.
Galbraith plot analysis was carried out to identify the outliers across eligible studies. Two studies on −11377C>G (Du et al., 2016; Hoefle et al., 2007), three studies on +276G>T (Filippi et al., 2005; Gui et al., 2012; Mohammadzadeh et al., 2016), and six studies on +45T>G (Al-Daghri et al., 2011; Cheung et al., 2014; Esteghamati et al., 2012; Foucan et al., 2010; Mofarrah et al., 2016; Rizk et al., 2012) were considered as outliers (Supplementary Figs. S2–S4).
Furthermore, we conducted sensitivity analysis by sequential removal of each study and excluding studies exhibited as outliers in Galbraith plot analysis. No significant change was found in meta-analyses of +45T>G, +276G>T, and −11377C>G polymorphisms. However, the results of −4034A>C polymorphism changed significantly when we excluded two studies conducted among the Caucasians (De Caterina et al., 2011; Pischon et al., 2007) (Supplementary Fig. S5).
Discussion
Adiponectin is expressed in adipocytes (Hoefle et al., 2007), and regulates the metabolism of glucose, energy storage, and fatty acid (Nakano et al., 1996; Sun et al., 2012). Although previous studies have extensively investigated an association between the five common adiponectin SNPs (+45T>G, +276G>T, −4034A>C, −11377C>G, −11391G>A) and CAD, the past literature was not uniformly consistent.
Based on combined analyses of 28,947 participants, our study suggested that +45T>G, −4034A>C, and −11391G>A polymorphisms are associated with CAD risk, +276G>T polymorphism is associated with a decreased risk of CAD among Caucasians, and −11377C>G polymorphisms are not related to CAD susceptibility.
The +45T>G SNP is a common synonymous mutation located at exon 2 of adiponectin. It has been proven in clinical investigation that adiponectin mRNA expression is relatively higher in G allelic carriers (Chang et al., 2009). This SNP has also been reported to be associated with higher serum adiponectin level and insulin resistance (Mackawy, 2013). Our study indicated that +45T>G polymorphism is a susceptibility factor for CAD. Subgroup analyses illuminated that +45T>G polymorphism is associated with CAD risk among Arabians, as well as in T2DM patients. This can be explained with the strong association of +45T>G polymorphism with insulin resistance and obesity (Zhou et al., 2014). Although a previous meta-analysis (Zhou et al., 2012) had reported a protective association of +45T>G polymorphism with CAD, our study presented similar result with two meta-analyses based on Asians and Caucasians (Zhang et al., 2012; Zhou et al., 2014).
The +276G>T polymorphism, sitting at intron 2 of adiponectin is also reported to regulate both adiponectin level and insulin resistance, as well as reduce oxidative stress (Fumeron et al., 2004; Jang et al., 2005; Menzaghi et al., 2002). In the previous meta-analyses, +276G>T polymorphism was dominated to be a preventive factor for CAD in general populations (Zhou et al., 2014) and among peoples with T2DM background (Zhang et al., 2012). This study showed no significant association between +276G>T polymorphism and CAD, except for Caucasians when recessive model analysis was performed.
Also, −4034A>C SNP has been considered a candidate gene for CAD, and is related to an increased susceptibility of fatal CAD and non-fatal MI (Zhong et al., 2010). In this meta-analysis, the seven studies included in the additive model analysis showed that −4034A>C SNP is a risk factor for CAD.
The polymorphism of −11377C>G, located in the promoter region of adiponectin, has been related to obesity among healthy adult population (Park et al., 2011). Two meta-analyses indicated the significant association of −11377C>G SNP with an increased risk of cardiovascular disease (Zhang et al., 2012; Zhou et al., 2012). However, we did not observe any significant association in the present study, which was consistent to a study of ischemic stroke patients (Shen et al., 2015).
The −11391G>A SNP is another adiponectin gene variant located in the promoter region of the adiponectin gene, which decreases the risk of insulin resistance (Chiodini et al., 2010). Four eligible studies reported the association of −11391G>A SNP with CAD. Nonetheless, no meta-analysis referred to −11391G>A polymorphism with CAD risk. Our study suggested that −11391G>A polymorphism is a risk factor for CAD.
Regarding ethnic stratification, which is recognized as one of the most important covariate in meta-analysis, we found disagreements between subgroups of ethnicities. Among the Asian populations, the five adiponectin SNPs examined in this study were not associated with CAD. However, a significant association of CAD with +45T>G polymorphism among Arabians as well as a −4034A>C and +276G>T polymorphisms among Caucasians were found in this study. These findings may probably be explained by the differences in genetic backgrounds, environmental factors, and lifestyles of the populations (Zhao et al., 2016; Zhou et al., 2014). Besides, the genetic diversity is owing to the flip-flop phenomenon, a phenomenon resulting from an interlocus correlation with the variant at another locus through linkage disequilibrium, which has been reported to be a contributing factor (Zhang et al., 2011).
There are some limitations of our study which are noteworthy and are common in meta-analyses of genetic polymorphisms and disease risks. First, the searched database was limited to English language publications. Second, only four original studies were found in terms of −11391G>A polymorphism, thus the potential publication bias on this locus could not be excluded thoroughly.
Conclusions
The current meta-analysis suggests that the polymorphisms of +45T>G (under dominant model), −4034A>C (under additive model), and −11391G>A (under both additive model and recessive model) are susceptible SNPs to CAD. The polymorphism of +276G>T is associated with a reduced susceptibility for CAD among the Caucasians (under recessive model), but not in other populations. Meanwhile, −11377C>G polymorphism is not related to CAD risk. These observations offer new potential genetic biomarker candidates in relation to CAD and warrant further analyses in independent world populations.
Footnotes
Acknowledgments
This study was supported by the National Natural Science Foundation of China (Grant: NSFC, No. 81202170). The authors thank Enoch Odame Anto, School of Medical and Health Sciences, for his English editing on this article.
Author Disclosure Statement
The authors declare that no competing financial interests exist.
Abbreviations Used
References
Supplementary Material
Please find the following supplemental material available below.
For Open Access articles published under a Creative Commons License, all supplemental material carries the same license as the article it is associated with.
For non-Open Access articles published, all supplemental material carries a non-exclusive license, and permission requests for re-use of supplemental material or any part of supplemental material shall be sent directly to the copyright owner as specified in the copyright notice associated with the article.
