
Abstract
Abstract
Next-generation (postgenomic) biomarkers from the nascent field of glycomics now offer fresh vistas for innovation in chronic disease biomarkers and system diagnostics in clinical medicine. Our previous work has shown an association between hypertension and immunoglobulin G (IgG) glycome composition, suggesting that individual variation in N-glycosylation of IgG might contribute to hypertension pathogenesis. The present study examined, for the first time to the best of our knowledge, the IgG N-glycans as potential biomarkers for hypertension in the Kazakh population. The profile of 60 N-glycopeptides of IgG subclass isolated from plasma samples of 150 Kazakh study participants was analyzed by nano ultra-performance liquid chromatography with mass spectrometry. Fourteen IgG subclass-specific Fc N-glycopeptide structures, along with one derived glycosylation trait in subclasses IgG2/3 and IgG4, were found to correlate with systolic blood pressure and/or diastolic blood pressure. For differentiation of hypertension and healthy status in the Kazakh population sample, the receiver operating characteristic curve analysis showed that the performance of the model, including nine IgG N-glycans, was greater than the traditional gender, age, and body mass index based model (p < 0.05). This study indicates that alteration in Fc N-glycopeptide profiles of plasma IgG subclasses is associated with blood pressure status in the Kazakh population. IgG N-glycosylation profiles may serve as potential biomarkers for hypertension in the Kazakhs, thus contributing to move toward personalized medicine. Further studies of postgenomic glycomic biomarkers in cardiovascular and chronic diseases are timely and called for.
Introduction
H
Hypertension is a complex disease that is influenced by both heritable and environmental factors and their complex interactions. At present, the specific composition of epigenetics (e.g., proteins, glycans, and lipids) in hypertension assessed by the metabolomic techniques could potentially redefine hypertension at a molecular level (Carty et al., 2013; Nikolic et al., 2014).
Glycosylation is an essential posttranslational modification and plays important roles in various biological processes such as molecular recognition, cell adhesion, and immunological defense systems (Arnold et al., 2007; Molinari, 2007; Varki et al., 1993). The glycan biosynthetic pathways depend on multiple parameters and can be influenced by genetic regulation and environment factors (Knezević et al., 2009). Protein N-glycosylation can differ between persons, but is remarkably stable over periods of time per individual, with even up to 1 year between measurements (Gornik et al., 2009).
Glycosylation pathways are altered in numerous diseases, giving rise to their potential as disease markers and providing a better understanding of disease pathogenesis (Etxebarria and Reichardt, 2016; Lu et al., 2011; Saldova et al., 2014; Sebastian et al., 2016; Vučković et al., 2015). Biomarker innovations have tended to focus on genomics, but next-generation biomarkers from the nascent field of glycomics now offer fresh vistas for innovation in chronic disease biomarkers and system diagnostics (medicine) (Adua et al., 2017; Wang et al., 2016a). Therefore, glycan biomarkers would offer potential as prospective disease biomarkers for precision medicine.
Immunoglobulin G (IgG) is one of the most abundant plasma glycoprotein, with average 2.8 N-linked sugar chains per molecule of IgG (Huang et al., 2016). Two N-glycans are present on the heavy polypeptide chains at asparagine 297 in the CH2 domain of the fragment crystallizable (Fc) moiety (Huang et al., 2016). Our previous study showed that five IgG N-glycans significantly differed in participants with prehypertension or hypertension compared to those with normal blood pressure in Han Chinese (Wang et al., 2016b). Available mouse data have further indicated a potential role of IgG N-glycosylation in the development of hypertension through inflammatory activity (Bautista et al., 2005; Kaess et al., 2012). Moreover, both aging and excess weight contributed to the increased risk of hypertension associated with protein or lipid N-glycosylation process (Meites and Saniel-Banrey, 1973; Selman et al., 2012; Yu et al., 2016).
These observations collectively suggest that IgG N-glycosylation may play an important role in the development of hypertension. Moreover, the results of glycosylation research in Han Chinese might not apply directly to the other ethnic groups. Therefore, studies in other ethnic populations like Kazakhs could aid in determining population-specific glycan biomarkers for hypertension.
In the present study, we performed an N-glycomic analysis of IgG subclasses in the Kazakh population and evaluated the characteristic IgG N-glycopeptides associated with hypertension in the Kazakhs, to examine IgG N-glycopeptides as potential postgenomic biomarkers and/or novel therapeutic targets for hypertension in the Kazakh population.
Materials and Methods
Participants
During 2014, 150 Kazakh participants were recruited from the Yili County of Xinjiang, China, where the Kazakh population was less affected by the recent migration of Han Chinese. All participants had to meet the following inclusion criteria: (1) signed informed consents before participation; (2) self-reported Kazakh ethnicity without intermarriage history with other ethnic groups within at least the past three generations; (3) aged more than 18 years; and (4) no history of medications during the preceding 2 weeks.
Individuals were excluded based on the following criteria: diagnosis of specific diseases of the severe cardiovascular, cerebrovascular, hepatic, nephritic, and metabolic diseases. This study was approved by the local community leaders and the Ethics Committee of the Capital Medical University, Beijing, China.
Demographic characteristics of participants, including ethnicity, gender, age, and history of medications, were collected by a questionnaire. Height and weight were carried out with the participants wearing only light indoor clothing and without shoes. The body mass index (BMI) was calculated by the formula weight (kg)/height2 (m2).
According to the guideline of World Health Organization, systolic blood pressure (SBP) and diastolic blood pressure (DBP) were measured twice on the right arm using a standard mercury sphygmomanometer on set with the subjects resting at least 10 min in a sitting position (World Health Organization, 2013). Two measurements separated by at least 5 min and the mean values were used for statistical analysis. Based on the mean values of blood pressure, the participants were classified into the hypertension group (SBP ≥140 mmHg or DBP ≥90 mmHg), the prehypertension/high-normal blood pressure group (120 mmHg ≤ SBP <140 mmHg or 80 mmHg ≤ SBP <90 mmHg), and the normal blood pressure group (SBP <120 mmHg and DBP <80 mmHg).
Fasting blood samples were collected in the morning after an overnight fasting by venipuncture and then transported at 4°C immediately for laboratory measurements of blood biochemistry indexes and glycomic analysis. Serum total cholesterol (TC), triglycerides (TG), high-density lipoprotein cholesterol (HDL), and low-density lipoprotein cholesterol (LDL) were measured using previous methods with an Olympus Automatic Biochemical Analyzer (Olympus Corporation, Japan) (Zhao et al., 2016). The fasting blood glucose (FBG) concentrations were measured by the glucose oxidase–peroxidase method (Meites and Saniel-Banrey, 1973). The rest of blood samples were centrifuged at 3000 rpm for 10 min, and plasma was stored at −80°C until N-glycomic analysis.
IgG N-glycan analysis
N-glycopeptide profile of each IgG subclass was analyzed by robust nano reverse phase ultra-performance liquid chromatography (UPLC) with mass spectrometry (MS) using a sheath-flow electro spray ionization (ESI) sprayer interface (Pezer et al., 2016). Briefly, IgG was isolated from plasma by affinity chromatography using a 96-well protein G monolithic plate and digested by trypsin. After the reverse-phase desalting and purification, glycopeptides were applied to a nanoACQUITY UPLC (Waters) system and a quadrupole time of flight MS (Compact, Bruker Daltonics) equipped with a standard ESI source (Bruker Daltonics) and a CE ESI-MS sprayer (Agilent Technologies) (Pezer et al., 2016).
Raw data files were converted to mzXML format using Data Analysis 3.2 software (Bruker Daltonics) and processed with in-house Python script. For m/z data recalibration, a hand-picket subset of analytes with high signal to noise ratio and expected isotopic distributions was used. After recalibration, top four isotopes per analyte were extracted using a 10 ppm m/z window. Finally, analyte specific retention time bins were defined, and signals originating from a single analyte were summed up. Total area normalization and batch correction were used to remove experimental variation from measurements, in a subclass specific manner.
Along with the 20 glycan structures per subclass (Supplementary Table S1 and Fig. 1), an additional 4 derived traits (galactosylation, sialylation, bisecting N-acetylglucosamine [GlcNAc], and fucosylation) representing composite traits were calculated according to the following formulas (Huffman et al., 2014; Selman et al., 2012; Wuhrer et al., 2007):
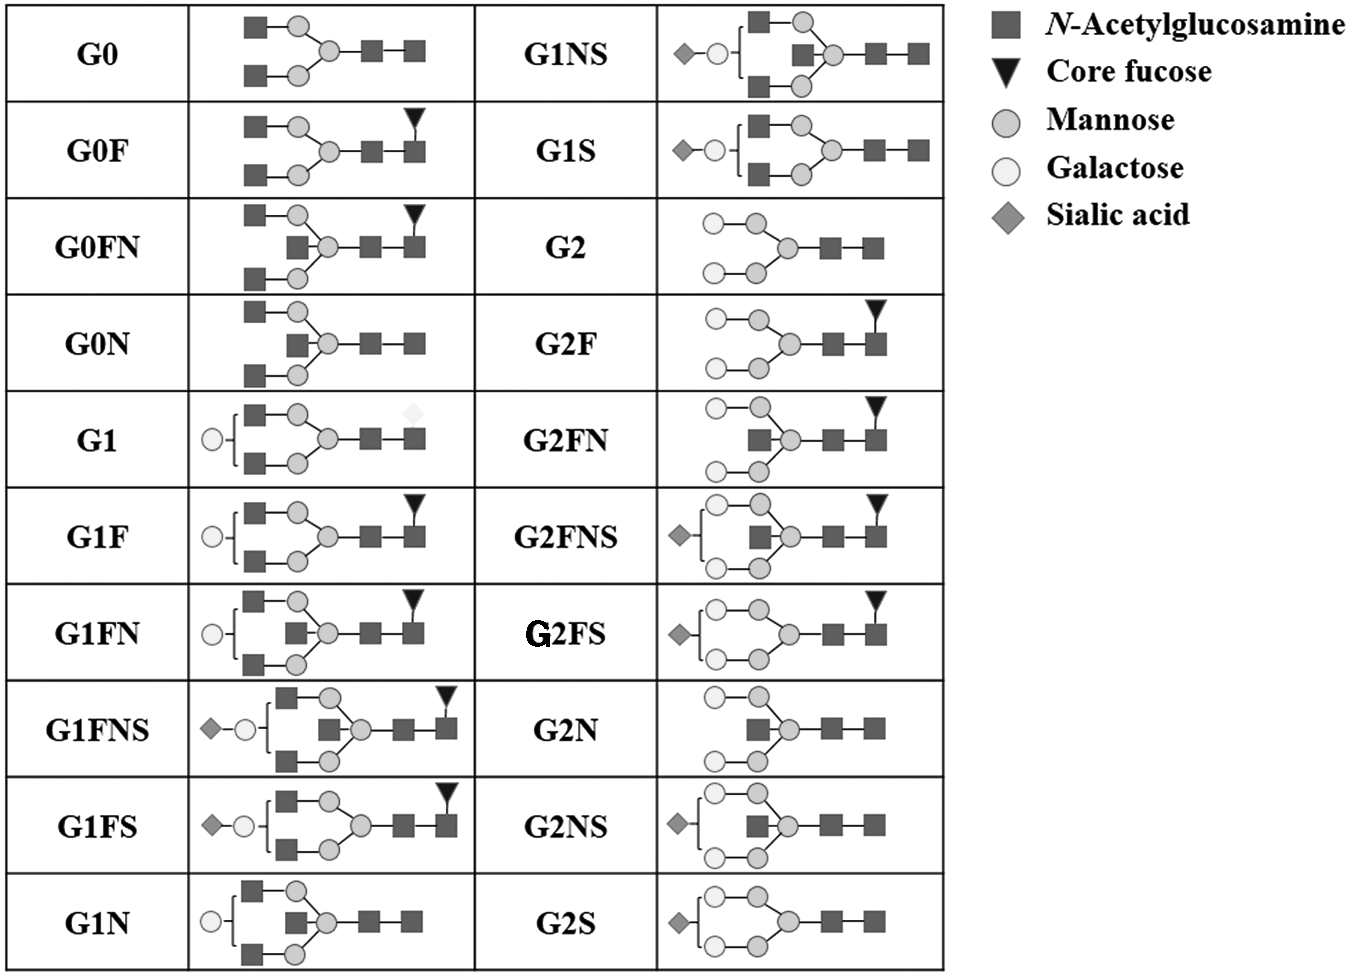
The 20 directly measured Fc glycopeptide N-glycan structures of each IgG subclass. Glycan structural features are given in terms of number of galactoses (G0, G1, and G2), fucose (F), bisecting N-acetylglucosamine (N), and N-acetylneuraminic acid (S). Fc, fragment crystallizable; IgG, immunoglobulin G.
Statistical analysis
Normality distributions of all the data obtained in the current study were checked by the Kolmogorov–Smirnov test, and p < 0.05 was considered statistically significant. Mean with standard deviation was used in descriptive statistics. One-way ANOVA was performed to compare the differences between participant characteristics among the three blood pressure categories. Covariance analysis was used to compare the differences of IgG subclass-specific Fc N-glycopeptide profile among the three blood pressure categories adjusted for gender, age, BMI, and FBG. Partial correlation analysis adjusted for gender, age, BMI, TC, TG, HDL, LDL, and FBG was performed to estimate the association between IgG subclass-specific Fc N-glycopeptides and SBP and/or DSP.
The box plot was used to determine the difference in the derived Fc N-glycosylation traits of IgG subclasses. Bonferroni correction was applied for covariance and partial correlation analyses. The significance level 0.05 was divided by 21 (no. of principal component of IgG subclass-specific N-glycans) and then by 2 due to multiple comparisons (SBP and DBP) (Lauc et al., 2013).
Discriminant analysis was performed to evaluate the discriminative ability of IgG subclass-specific Fc N-glycopeptides. Ordinal Regression and receiver operating characteristic (ROC) curve analyses were used to screen glycan biomarkers for hypertension. Normal transformation and dimension reduction based on LASSO (least absolute shrinkage and selection operator) method were performed for making N-glycopeptides comparable before the regression analysis. All the analyses were performed with the SPSS (Version 21.0) software, and dimension reduction was performed with R packages (Version 2.7.2). All the reported p values were two sided, and p < 0.05 was considered statistically significant (if not stated otherwise).
Results
Participant characteristics
Fifty-two Kazakh participants with hypertension, 23 with prehypertension, and 75 with normal blood pressure were included in the analysis. Demographic descriptions and anthropometric parameters are shown in Table 1. The age and BMI were significantly higher in the hypertension group than those in the normal blood pressure group (p < 0.001), while the TG were higher in the hypertension group than that in the prehypertension group (p = 0.001). The TC, HDL, LDL, and FBG were significantly higher in the hypertension group than those in both the prehypertension group and the normal blood pressure group (all the p < 0.025 adjusted by Bonferroni correction).
Data are shown as mean ± SD. The p values in bold represent p < 0.05. *p < 0.025 compared with normal tension group, #p < 0.025 compared with prehypertension group.
BMI, body mass index; FBG, fasting blood glucose; HDL, high-density lipoprotein cholesterol; LDL, low-density lipoprotein cholesterol; SD, standard deviation; TC, total cholesterol; TG, triglycerides.
Correlation of IgG N-glycans and blood pressure
By covariance analysis, there were significant differences among the three blood pressure categories in 9 N-glycan structures of IgG1 Fc glycopeptide (G0F, G0N, G1F, G1FN, G1FNS, G1NS, G2F, G2FNS, and G2NS), in 10 N-glycan structures of IgG2/3 Fc glycopeptide (G0F, G0N, G1F, G1FN, G1FNS, G1FS, G2, G2F, G2FN, and G2N), and in 9 N-glycan structures of IgG4 Fc glycopeptide (G0F, G0FN, G1, G1N, G1S, G2, G2FS, G2N, and G2NS), adjusted for gender, age, BMI, and FBG (all the p < 0.05; Supplementary Table S2 and Supplementary Fig. S1). The levels of N-glycan structure G0F on the Fc fragment of each IgG subclass were significantly lower in the hypertension group than both those in the prehypertension group and in the normal blood pressure group, and the levels in the prehypertension group were lower than that in normal blood pressure group (Supplementary Table S2).
In addition, statistically significant and considerable decreasing trends were observed in the levels of following derived Fc glycopeptide glycosylation traits (galactosylation of each IgG subclass, sialylation, and bisecting GlcNAc of IgG2/3) adjusted for gender, age, BMI, and FBG (Supplementary Table S2 and Fig. 2). However, the level of fucosylation of IgG4 was decreasing only in case of prehypertension, but increasing in hypertension, compared to normal blood pressure adjusted for gender, age, BMI, and FBG (Fig. 2).

Differences in the derived Fc N-glycosylation traits of IgG subclasses, IgG1, IgG2/3, and IgG4, in the Kazakh participants with normal blood pressure, prehypertension, and hypertension (p < 0.05). Data are shown as box plots. Each box represents the 25th to 75th percentiles. Lines inside the boxes represent the median. Lines outside the boxes represent the 5th and 95th percentiles. Bis, bisecting GlcNAc; Fuc, fucosylation; Gala, galactosylation, Hyp, hypertension; Nor, normal blood pressure; Pre, prehypertension; Sia, sialylation.
After the Bonferroni correction, the corrected significance level was 2.38E-03 (the significance level 0.05 was divided by 21 [no. of principal component of IgG N-glycans]) (Lauc et al., 2013). There were significant differences among the three blood pressure categories in 14 IgG subclass-specific Fc glycopeptide N-glycan structures (IgG1-G1FNS, IgG1-G2FNS, IgG2/3-G0F, IgG2/3-G1FN, IgG2/3-G1FNS, IgG2/3-G2F, IgG2/3-G2N, IgG4-G0F, IgG4-G0FN, IgG4-G1, IgG4-G1N, IgG4-G2, IgG4-G2FS, and IgG4-G2N) and in Fc glycopeptide galactosylation of IgG2/3 and IgG4 (all the p < 2.38E-03; Supplementary Table S2).
The correlations of Fc N-glycopeptides of each IgG subclass and SBP or DBP are shown in Tables 2 and 3, with corrected significance level of 1.19E-03 (the significance level 0.05 was divided by 21 [no. of principal component of IgG N-glycans] (Lauc et al., 2013) and then by 2 [SBP and DBP]). In the Kazakh individuals, 10 subclass-specific IgG Fc glycopeptide N-glycan structures (IgG1-G0F, IgG1-G1FNS, IgG2/3-G0N, IgG2/3-G1FN, IgG2/3-G2, IgG2/3-G2N, IgG4-G0F, IgG4-G0FN, IgG4-G1, and IgG4-G1S) and Fc glycopeptide galactosylation of IgG4 were correlated (five positively and six negatively) with SBP after adjustment for gender, age, BMI, TC, TG, HDL, LDL, and FBG. The biggest correlation coefficient was observed for IgG4-G0F (r = 0.419, p = 1.60E-07).
Bold in p-value represents p < 1.19E-03 (the significance level 0.05 was divided by 21 [no. of principal components of IgG N-glycans] and then 2 [SBP and DBP]).
IgG, immunoglobulin G.
Bold in p-value represents p < 1.19E-03 (the significance level 0.05 was divided by 21 [no. of principal components of IgG N-glycans] and then by 2 [SBP and DBP]).
Similarly, eleven subclass-specific IgG Fc glycopeptide N-glycan structures (IgG1-G1FNS, IgG1-G2FNS, IgG2/3-G0F, IgG2/3-G1FN, IgG2/3-G1FNS, IgG2/3-G2, IgG2/3-G2F, IgG4-G0F, IgG4-G0FN, IgG4-G1, and IgG4-G1S) and Fc glycopeptide galactosylation of IgG2/3 and IgG4 were correlated (six positively and seven negatively) with DBP after adjustment for gender, age, BMI, TC, TG, HDL, LDL, and FBG, with the biggest correlation coefficient also for IgG4-G0F (r = 0.398, p = 6.85E-07). In these 14 IgG subclass-specific Fc glycopeptide N-glycan structures, seven directly measured N-glycan structures (IgG1-G1FNS, IgG2/3-G1FN, IgG2/3-G2, IgG4-G0F, IgG4-G0FN, IgG4-G1, and IgG4-G1S) and one derived glycosylation trait (galactosylation of IgG4) were associated with both SBP and DBP, and with the same trend.
Exploring IgG N-glycans as potential biomarkers for hypertension
Since the majorities of IgG subclass-specific Fc glycopeptide N-glycan structures were significantly different among the three blood pressure categories and statistically associated with SBP and/or DBP, a glycan-based discriminant analysis was performed. The discriminant model was built with the 60 directly measured IgG subclass-specific Fc glycopeptides, resulting in a striking distinction among the three blood pressure categories (92.0% of X axis variance and 62.2% of Y axis variance were explained, p < 0.001) (Fig. 3).
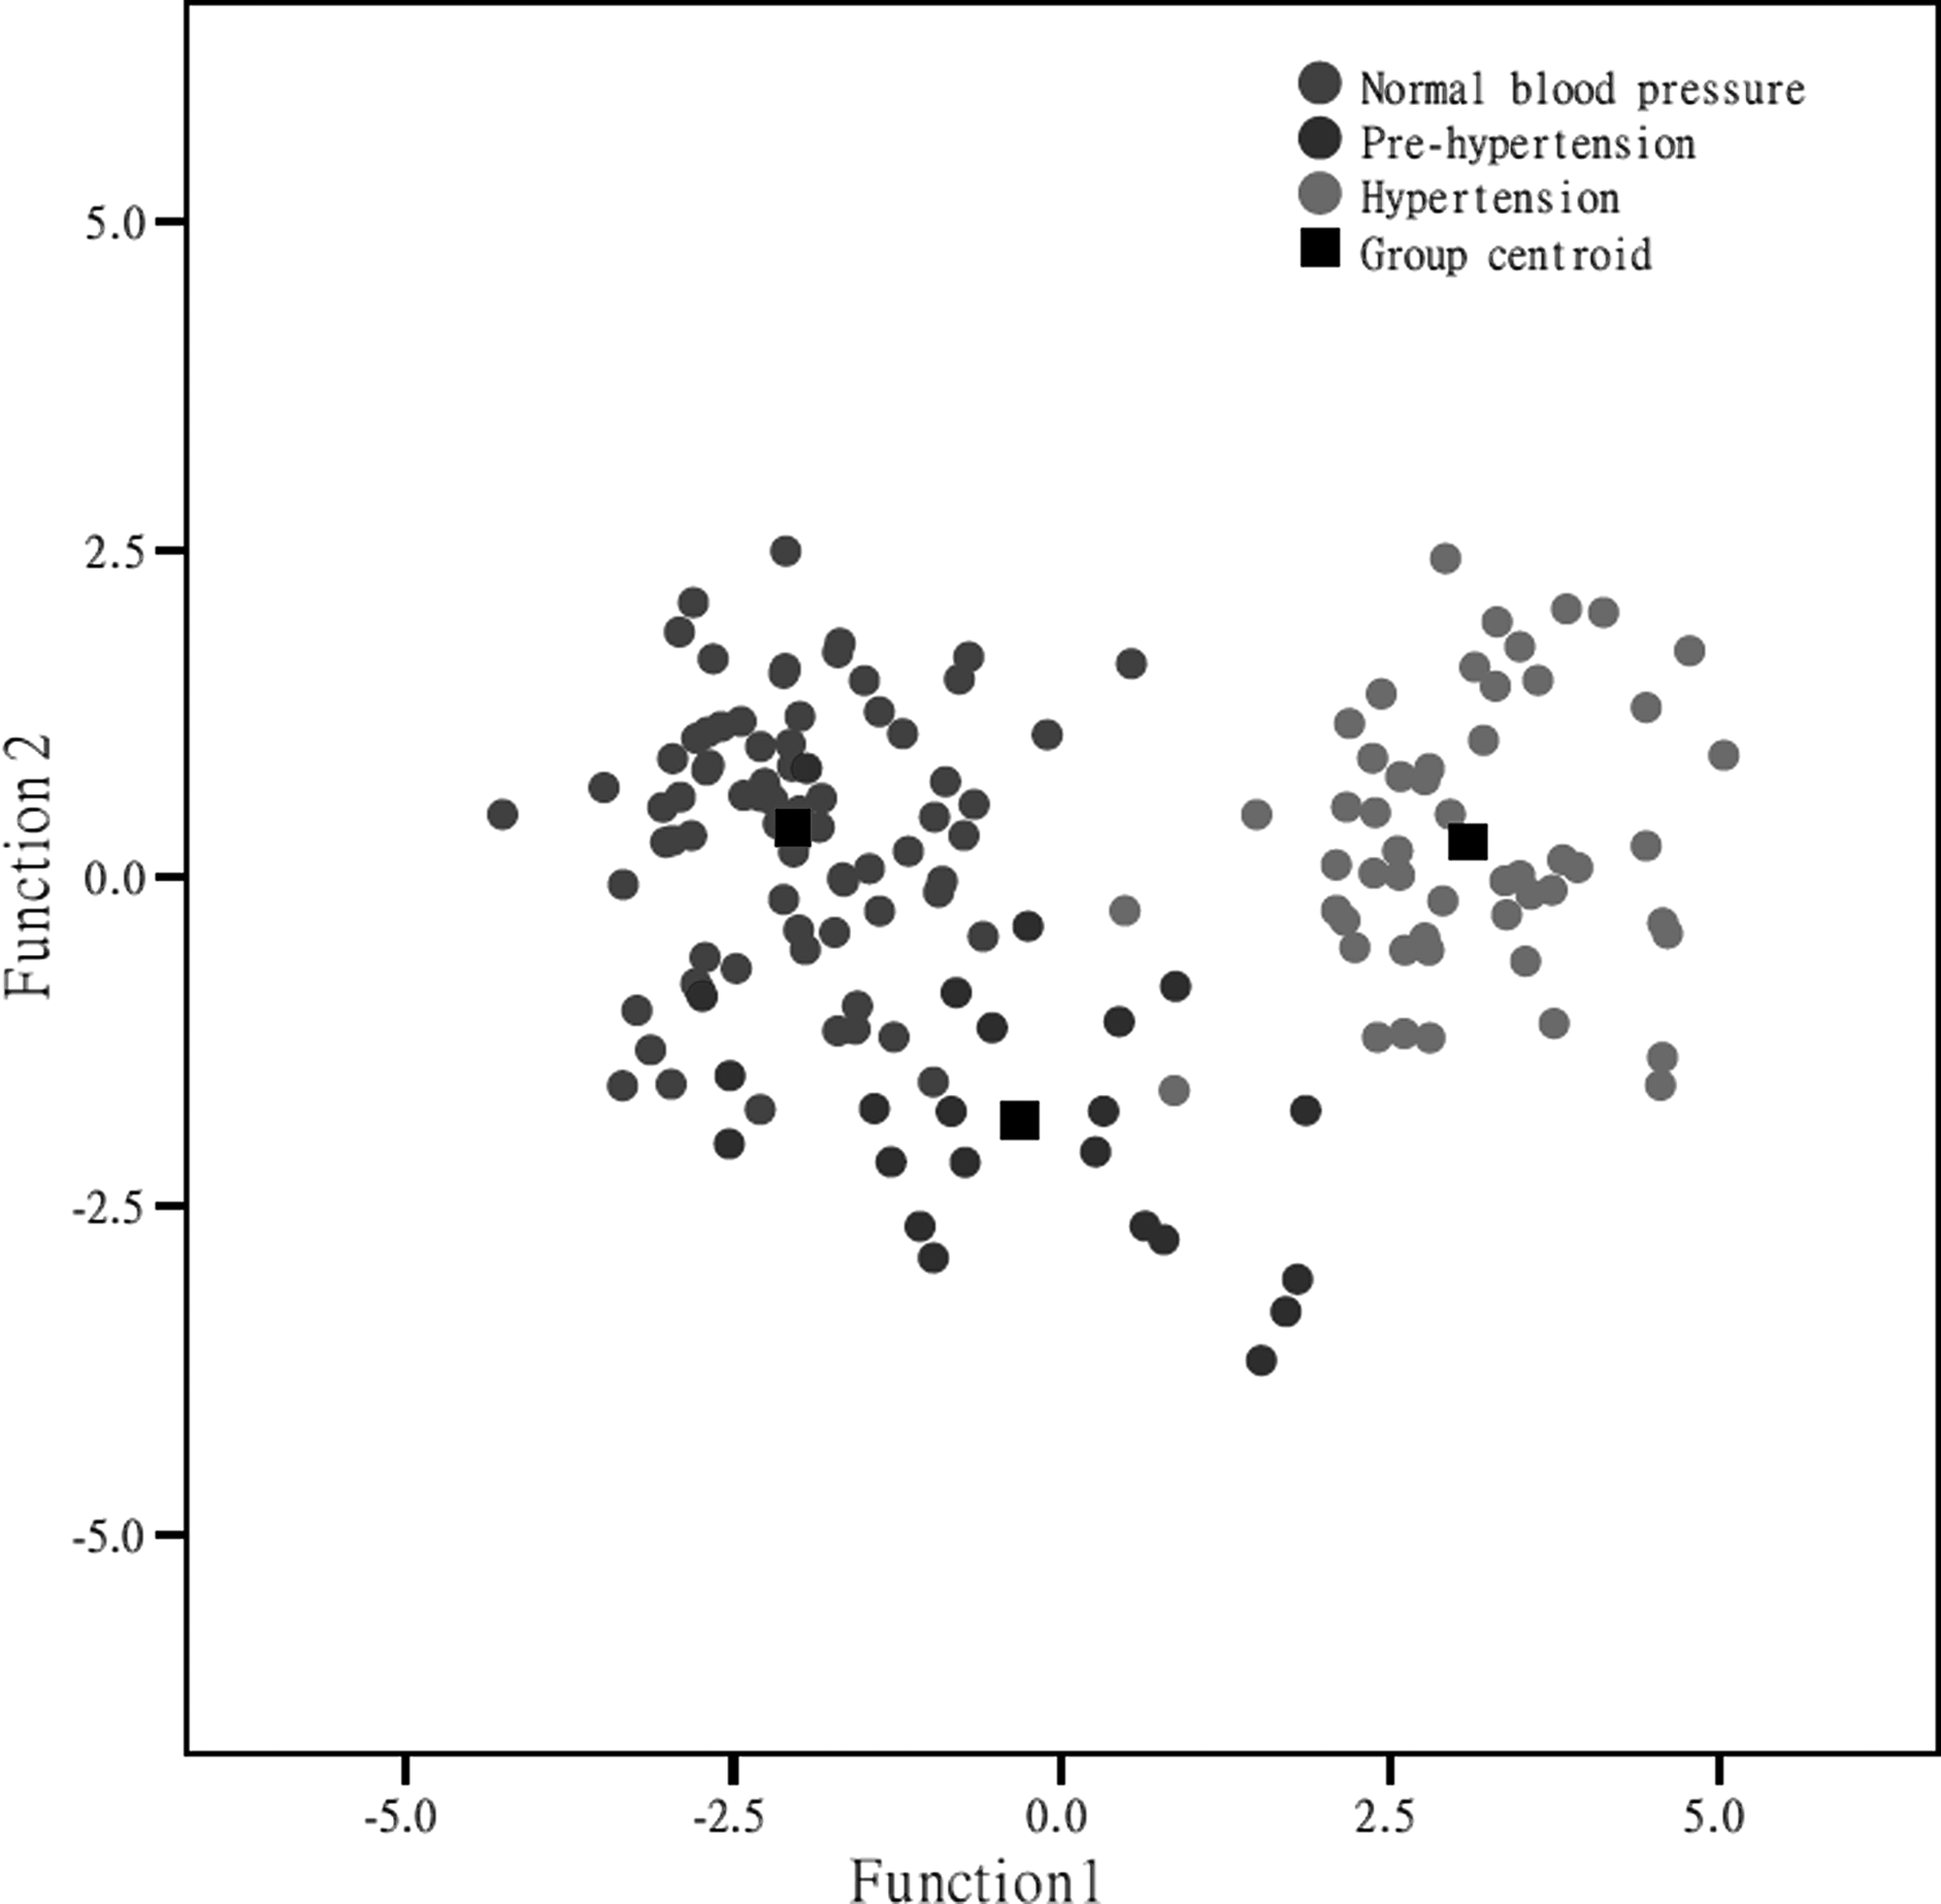
Discriminant analysis plots showing differences in function 1 (X axis-variance) and function 2 (Y axis-variance) based on subclass-specific IgG Fc N-glycosylation among Kazakh participants with normal blood pressure, prehypertension, and hypertension.
Two different predicted models were analyzed using Ordinal Regression. First, a baseline-based model, which included only gender, age, and BMI components, and second, a glycan-based model, which included only all of the IgG Fc glycopeptide N-glycans, were built. Normal transformation and dimension reduction based on LASSO method were performed before regression for making glycans comparable.
Among the 60 directly measured Fc N-glycopeptides, only 9 N-glycopeptides (IgG1-G0F, IgG1-G1, IgG1-G1FN, IgG1-G2FS, IgG2/3-G1FNS, IgG4-G0F, IgG4-G1FN, IgG4-G2, and IgG4-G2FN) were found to be significantly related to blood pressure status after adjustment for gender, age, BMI, TC, TG, HDL, LDL, and FBG (Supplementary Table S2). The analysis showed that IgG1-G0F (adjusted odds ratio [AOR] = 1.25 × 10²; 95% confidence interval [CI]: 4.40–3.56 × 10²; p = 0.005) had a highest likelihood of occurrence in hypertension cases, whereas IgG4-G1FN (AOR = 0.09; 95% CI: 0.01–0.69; p = 0.020) was less likely to occur in hypertension cases (Supplementary Table S3). The glycan-based predicted model based on the nine IgG subclass-specific Fc glycopeptide N-glycan structures was as follows:
The ROC curve analyses were performed to assess the performances of the two predicted models. The nine IgG glycan-based model for discriminating hypertension from the healthy controls (area under the curve [AUC] = 0.994, 95% CI: 0.985–1.000) has displayed higher predictive potential than the model based on gender, age, and BMI (AUC = 0.757, 95% CI: 0.679–0.835) (Fig. 4).

ROC curve illustrating the performance of the models in predicting hypertension of the Kazakh participants. The predictive power and the AUC of the nine N-glycan based model (AUC = 0.994) were significantly higher than the model based on gender, age, and BMI (AUC = 0.757). AUC, area under the curve; ROC, receiver operating characteristic.
Discussion
We found that IgG subclass-specific Fc glycopeptide N-glycosylation was associated with blood pressure status in the Kazakh population. To the best of our knowledge, this is the first attempt to examine the association between subclass-specific IgG N-glycosylation patterns and hypertension in the Kazakh population and demonstrates the clear differences between the Fc N-glycan profiles of each IgG subclass.
In this study, galactosylation of all IgG subclasses decreased with increasing blood pressure in the Kazakh samples, consistent with the results of total IgG from the Han Chinese (Wang et al., 2016b). Decreased levels of galactosylation of total IgG have been associated with several chronic inflammatory diseases such as inflammatory bowel disease, glomerulonephritis, and Alzheimer's disease (Lundström et al., 2014; Trbojević Akmačić et al., 2015; van Timmeren et al., 2010).
Glycans that lack terminal galactose activate complement and make IgG pro-inflammatory, while the addition of galactose decreases the inflammatory potential of IgG (Mihai and Nimmerjahn, 2013; Nimmerjahn and Ravetch, 2008). For example, high Fc-galactosylation of IgG1 molecules promotes cooperative signaling of the FcγRIIb with dectin-1 resulting in an inhibitory signaling pathway that blocks pro-inflammatory effector functions (Karsten et al., 2012). Thus, decreased IgG galactosylation might contribute to the pathogenesis of hypertension through the increased inflammatory activity.
Our study also showed that IgG2/3 subclass of patients with hypertension had decreased sialylation and bisecting GlcNAc of the Fc, while IgG1 and IgG4 subclasses did not. This is consistent with the results of total IgG N-glycan analysis from the Han Chinese (Wang et al., 2016b). Decrease in sialylation may be a consequence of decrease in galactosylation, which is necessary for covalent attachment of the terminal sialic acid residues (Hassinen et al., 2011).
The lack of sialic acids suggests an extensive improvement in the receptor FcγRIIa and FcγRIIb binding, an increased degree of either antibody dependent cell-mediated cytotoxicity (ADCC) or complement-dependent cytotoxicity (Anthony et al., 2008; Maverakis et al., 2015; Quast et al., 2015). In addition, bisecting GlcNAc was also reported to have significantly increased binding of IgG to FcγRIIIa leading to an increase in ADCC (Clerc et al., 2016). But it is not clear whether this is a direct effect or an indirect consequence of increased core fucose level, because the addition of a bisecting GlcNAc by GnT-III can prohibit the subsequent addition of a core fucose (Ferrara et al., 2006).
Interestingly, although we have not detected statistically significant increase in IgG2/3 fucosylation, and this is possibly due to the small sample size, a significant tendency of increased fucosylation of IgG4 was observed.
However, the increased fucosylation of IgG4 observed in our study is in contradiction to an earlier finding from the Chinese Han population, which showed a decreased total IgG core fucosylation among hypertension group (Wang et al., 2016b). The observed difference may own to the difference in two ethnic backgrounds. Kazakh is a population presenting a typical admixture of European and Asian anthropometric traits, with different genetic profile, customs, culture, and food consumption from the Han Chinese (Ablimit et al., 2013; Black et al., 2006; Song et al., 2015). For example, the genetic diversity of the genes involved in drug absorption, distribution, metabolism, and excretion of the Kazakh ethnic groups was substantially different from those in the Han Chinese population (Li et al., 2014).
The widespread differences in genetic structure and environmental condition in Kazakh population may have different effects on its IgG N-glycosylation composition. The difference of fucosylation between the Kazakhs and Han Chinese may own to the ethnic variations, suggesting that studies in other ethnic populations like the Kazakhs could aid in determining population-specific glycan biomarkers for hypertension.
N-glycan profiles based on individual background variability and inherent sensitivity reflect the integrative effect of both genetic and environmental factors on the individuals, so as to make N-glycans promising disease biomarkers (Gornik et al., 2009). Complex molecular biomarkers based on glycomic techniques will be best suited to describe the current state of an individual and provide better individual prediction than traditionally unidimensional biomarker (Kearney et al., 2005). Italian National Research Center has proved the application of serum N-glycan profiles as sensitive surrogate biomarker for the presence of diabetes and metabolic syndrome (Testa et al., 2015).
In our study, we found an increase in the fucosylated agalactobiantennary Fc N-glycan (G0F) of all IgG subclasses, which were associated with increased SBP and/or DBP. These alterations may occur in prehypertension presenting early molecular biomarkers for subclinical stage of hypertension. For differentiation of hypertension patients and healthy controls in the Kazakhs, the model based on the nine IgG N-glycans has displayed predictive potential. Therefore, subclass-specific alteration in IgG Fc N-glycosylation could serve as a potential biomarker for hypertension, helping in the prediction of the risk of developing hypertension and the personalized medicine.
While this study provides valuable insight into the association between Fc N-glycosylation profile of IgG subclasses and hypertension in Kazakh population, it has limitations. The main limitation of this study is the relatively small sample size (n = 150) and nonrandom sampling because of the consanguinity practice of Kazakh people, but this drawback might provide the merit on the homogeneity of the population studies. In addition, this cross-sectional design cannot judge whether IgG N-glycosylation changes are causal for hypertension or just parallel with hypertension. Therefore, further longitudinal follow-up should focus on mechanisms behind the changes in IgG glycosylation and their functional role in pathogenesis of hypertension.
Conclusions
This study shows that the alteration in Fc N-glycopeptide profiles of plasma IgG subclasses is associated with blood pressure status in the Kazakh population. IgG N-glycosylation profiles may serve as potential biomarkers for hypertension in the Kazakhs, thus contributing to move toward personalized medicine. Further studies of postgenomic glycomic biomarkers in cardiovascular and chronic diseases are timely, and called for.
Footnotes
Acknowledgments
This study was supported by research grants from the National Natural Science Foundation of China (81573215, 31460285 and 81370083), Australian National Health & Medical Research Council and National Natural Science Foundation of China joint collaborative Grant (NH&MRC-APP1112767-NSFC81561128020), European Commission FP7 projects PainOmics (contract #602736), MIMOmics (contract #305280), and H2020 project GlySign (contract #722095), as well as funding for the Croatian National Centre of Research Excellence in Personalized Healthcare. M.S. was supported by the Importation and Development of High-Caliber Talents Project of Beijing Municipal Institutions (CIT&TCD201404185). Y.W. was supported by Beijing Higher Education Young Elite Teacher Project (YETP1671) and Beijing Nova Program (Z141107001814058). The authors thank the directors and relevant staff of Qapqal Xibe Autonomous County Health Bureau for their support for recruiting the Kazakh participants and the Kazakh volunteers and community leaders for their participation and support.
Author Disclosure Statement
G.L. is the founder and owner of Genos Ltd., a private research organization that specializes in high-throughput glycomic analysis, and has several patents in this field. J.Š. and I.T.-A. are the employees of Genos Ltd.
Abbreviations Used
References
Supplementary Material
Please find the following supplemental material available below.
For Open Access articles published under a Creative Commons License, all supplemental material carries the same license as the article it is associated with.
For non-Open Access articles published, all supplemental material carries a non-exclusive license, and permission requests for re-use of supplemental material or any part of supplemental material shall be sent directly to the copyright owner as specified in the copyright notice associated with the article.