




Abstract
The association between hypercoagulability and use of drospirenone (DRSP) and ethinylestradiol (EE) containing combined oral contraceptives (COCs) is an important clinical concern. We have previously reported that the two formulations of DRSP combined with EE (namely, DRSP/20EE and DRSP/30EE) bring about a prothrombotic state in hemostatic traits of female users. We report here the serum metabolomic changes in the same study cohort in relation to the attendant prothrombotic state induced by COC use, thus offering new insights on the underlying biochemical mechanisms contributing to the altered coagulatory profile with COC use. A total of 78 healthy women participated in this study and were grouped as follows: control group not using oral contraceptives (n = 25), DRSP/20EE group (n = 27), and DRSP/30EE group (n = 26). Untargeted metabolomics revealed changes in amino acid concentrations, particularly a decrease in glycine and an increase in both cysteine and lanthionine in the serum, accompanied by variations in oxidative stress markers in the COC users compared with the controls. Of importance, this study is the first to link specific amino acid variations, serum metabolites, and the oxidative metabolic profile with DRSP/EE use. These molecular changes could be linked to specific biophysical coagulatory alterations observed in the same individuals. These new findings lend evidence on the metabolomic substrates of the prothrombotic state associated with COC use in women and informs future personalized/precision medicine research. Moreover, we underscore the importance of an interdisciplinary approach to evaluate venous thrombotic risk associated with COC use.
Introduction
Combined oral contraceptive (COC)
Drospirenone (DRSP), a synthetic progestin, in combination with ethinylestradiol (EE), a synthetic estrogen, is a prevalently used oral contraceptive formulation. At present two preparations are available, namely, DRSP/30EE and DRSP/20EE; both formulations contain 3 mg DRSP in combination with 30 μg EE and 20 μg EE in each active tablet, respectively (Mathur et al., 2008). Another difference between the 2 formulations is the dosage strategy, with a DRSP/30EE packet containing 21 active pills followed by 7 hormone-free pills, whereas a DRSP/20EE packet consists of 24 active pills followed by 4 hormone-free pills (Rapkin et al., 2007).
Although there is conflicting evidence regarding the venous thrombotic (VT) risk associated with DRSP/30EE and DRSP/20EE (Geampana, 2016; Gronich et al., 2011; Kieler et al., 2003; Reid et al., 2010; Stegeman et al., 2013; Wiegratz and Thaler, 2011), the adverse effect of these COCs on hemostatic variables associated with hypercoagulability is known and of important clinical concern (Kluft et al., 2006; Stocco et al., 2015).
Our research group has previously reported the impact of DRSP/EE formulations on whole blood clot formation and indicated that the viscoelastic profile of the users shifted to a prothrombotic state. A number of alterations in the biophysical traits of the blood collected from these users on COCs, potentially leading to this phenotype, were identified, including:
platelet activation and aggregation; interactions between erythrocytes and platelets and/or fibrin; compromised membrane integrity of erythrocytes resulting in rouleaux formation, shape changes and, ultimately, eryptosis; and spontaneous fibrin formation; as given in Figure 1 (Emmerson et al., 2018).
Alterations to the biophysical traits of whole blood collected from DRSP/20EE and DRSP/30EE users. DRSP, drospirenone; EE, ethinylestradiol.
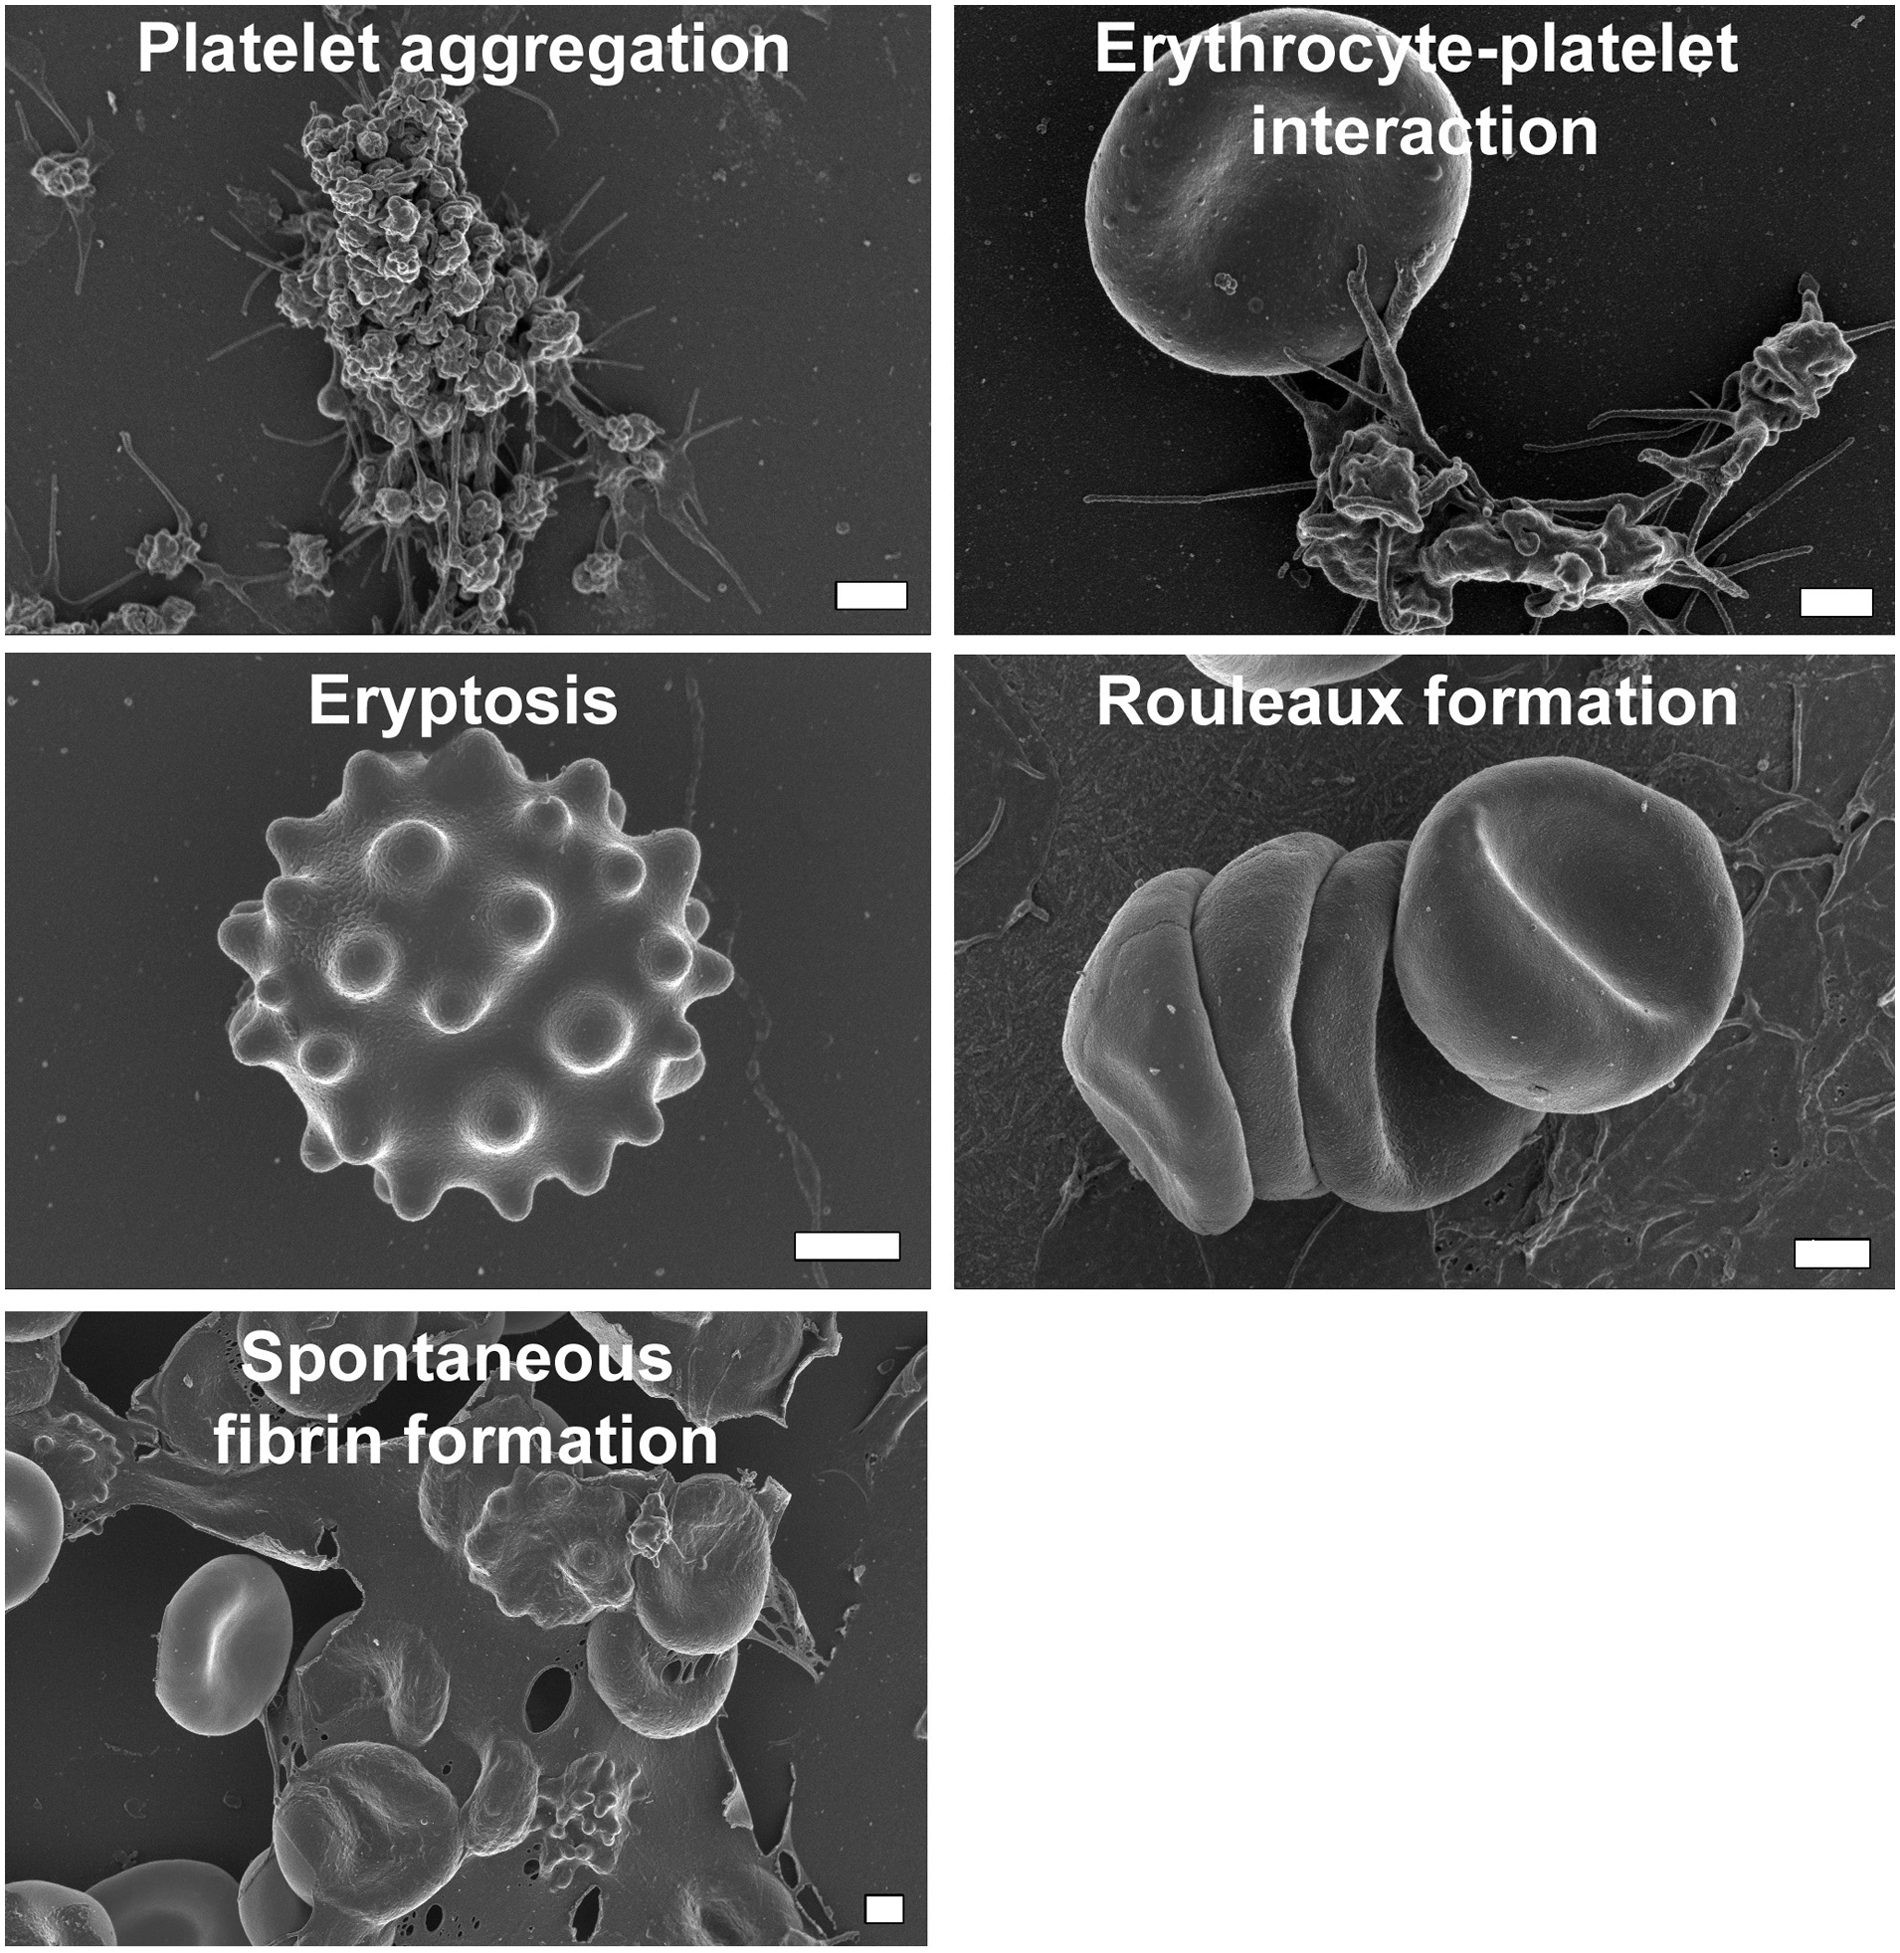
These observations may provide a possible explanation for the increased risk of venous thromboembolism (VTE) associated with use of these COCs and further indicate possible hypoperfusion to vital organs and tissues that could have long-term effects. That said, we were only able to hypothesize in that previous study which biochemical mechanisms, such as oxidative stress and inflammation, could bring about these phenotypic variations (Emmerson et al., 2018; Swanepoel et al., 2017).
The aim of this study was therefore to examine the metabolomic profiles of the same DRSP/30EE and DRSP/20EE user study cohort, to elucidate the underlying mechanisms contributing to the altered coagulatory profile and by prothrombotic state mentioned.
Materials and Methods
Ethics statement
Ethical approval for the study was granted by the Ethical committee of the University of Pretoria (307/2016). Written informed consent was given by all participants, and all collected samples were anonymized upon collection.
Reagents and chemicals
Methoxyamine hydrochloride and 3-phenyl butyric acid were purchased from Sigma-Aldrich (St. Louis, MO, USA). Pyridine, TMCS, and BSTFA were purchased from Merck (Darmstadt, Germany). All organic solvents used were ultrapure Burdick & Jackson brands (Honeywell International, Inc., Muskegon, MI, USA).
Participant recruitment and sample collection
Healthy, nonsmoking women between the ages of 18 and 30 years, with no history of thrombotic or other chronic diseases, and no history of chronic treatment (except for the relevant COC in the test groups), were recruited to participate in the study. These individuals included controls (individuals not using any type of hormonal contraceptive for at least 6 months to ensure a sufficient washout period), individuals using DRSP/20EE, and individuals using DRSP/30EE.
Blood was collected from the control participants during menses to eliminate the possible influence of endogenous estrogen and progesterone (Ruoppolo et al., 2014; Swanepoel et al., 2014), whereas the test groups were sampled after ingesting the active pills (containing DRSP and EE) for at least 7 days (Reif et al., 2013).
Venous blood was drawn by a qualified phlebotomist in a single VACUCARE plain red tube (no additives) from each participant. The tube was left to stand for 30–60 min at room temperature to allow a clot to form, after which the sample was centrifuged at 3000 rpm for 5 min at 4°C. A glass Pasteur pipette was used to collect the supernatant serum layer that was then transferred to a clean serum blood collection tube. The serum was subsequently centrifuged at 5000 rpm for 5 min at 4°C, and the supernatant aliquoted into DNA LoBind Eppendorf tubes using a digital pipette. Serum aliquots were immediately frozen at −80°C, and transported as such, until metabolomics analysis at the Centre for Human Metabolomics (North-West University, Potchefstroom, South Africa) commenced.
Quality control samples
To assess the quality of the data obtained, instrument and extraction repeatability was evaluated within and across batches. To quantify this variability, a master pooled quality control (QC) sample was made up by combining a small volume of each of the collected serum samples, from which a number of smaller aliquots was prepared with each batch and chromatographically analyzed on the two-dimensional gas chromatography time-of-flight mass spectrometer (GCxGC-TOFMS) as the first, middle, and last sample of each batch.
Metabolite extraction
As internal standard, 50 μL of 3-phenyl butyric acid (0.03602 mg/mL) was added to 50 μL of each sample, where after proteins were precipitated by adding 300 μL of ice-cold acetonitrile and then incubating the samples on ice for 10 min. Sample vials were then centrifuged at 8000 rpm for 8 min (4°C), where after the supernatant was collected and dried under nitrogen. The dry extract was then derivatized with 25 μL of methoxyamine hydrochloride in pyridine (15 mg/mL) at 50°C for 90 min, and trimethylated with 40 mL of BSTFA containing 1% TMCS at 60°C for 60 min. Samples were extracted and derivatized in a random order.
GCxGC-TOFMS analysis
Metabolomics analyses of sample extracts were carried out on a Pegasus four-dimensional GCxGC-TOFMS [LECO Africa (Pty) Ltd, Johannesburg, South Africa] coupled to a Gerstel Multipurpose Sampler (Gerstel GmbH and Co. KG, Mülheim an der Ruhr, Germany). All extracts (1 μL), including those from the QC samples, were chromatographically analyzed using a split ratio of 1:10. The carrier gas used was helium (constant flow of 1 mL/min) and the inlet temperature was held at 270°C for the total run.
Chromotography was performed using a Restek Rxi-5Sil-MS primary capillary column (29.9 m, 0.25 μm film thickness and 250 μm internal diameter), and the primary oven had an initial temperature of 55°C for 2 min, with a consequent increase of 4°C/min to an end temperature of 300°C, at which it was held for 2 min. For second dimensional separation, an Rxi-17 capillary column (1.4 m, 0.25 μm film thickness and 250 μm internal diameter) was used, and the initial oven temperature was 70°C for 2 min, followed by an increase of 4.5°C/min to a final temperature of 300°C, at which it was held for 4.5 min. An advanced modulator program was used, in which the modulator had an initial temperature of 85°C for 2 min, where after it was increased at 4°C/min to a final temperature of 300°C for 12 min.
Cryomodulation was attained through a hot pulse of nitrogen of 0.5 sec, every 3 sec. For solvent delay purposes, the mass spectrometer (MS) filament was set to be off for the first 460 sec of every run. The transfer line temperature was maintained at 270°C and the ion source temperature at 220°C throughout the analyses. The detector voltage was 1600 V and the filament bias −70 eV. Mass spectra were attained at 200 spectra per second, and the mass range used was set to 50–800 m/z.
Data processing
Data processing, including deconvolution, alignment, and peak annotation were carried out with ChromaTOF software (version 4.50; LECO Corporation). A signal-to-noise ratio of 100, with a minimum of three apexing peaks, was used. Statistical Compare (a function of ChromaTOF) was used to align peaks according to their mass spectra and retention times. Peaks were annotated using commercially available (NIST) and in-house generated mass spectral libraries. Peak areas were normalized relative to the area of the internal standard.
Statistical analyses
Data integrity and quality assurance
Before statistical data analyses, samples were grouped as either controls or contraceptive users (including both the high- and low-dose test groups).
First, the large proportion of zero-valued observations needed to be addressed. A zero filter, which excluded variables with 50% or more zero-valued observations in both experimental groups, was applied. The remaining zero-valued observations were replaced by random numbers just below the minimum observed value for each compound. Second, repeatability was assessed within each batch and only compounds found to be sufficiently reliable were retained by means of a QC-CV (coefficient of variation) filter. The QC-CV filter removed variables with a CV value in the QC samples exceeding 50% in three or more of the analytical sample batches.
Between-batch repeatability was assessed by comparing the variation in the samples with the variation in the QCs based on a scores plot generated using principal components analysis (PCA). Repeatability was considered achieved if the variation in QCs between batches was not obvious and was dramatically less than that observed for the samples. As a clear batch effect could be observed, a batch correction was performed based on the method set out in van der Kloet et al. (2009). On the contrary, correction for drift was not deemed necessary.
These data preprocessing filters reduced the dataset to 848 metabolites. Finally, to reduce the effect of compounds appearing in different orders of magnitude, which is not necessarily related to compound importance, and to correct for the skewed distribution of the data, the data were log transformed (using a shifted log with a shift parameter of 1) and autoscaled (van den Berg et al., 2006).
PCA score plots were also used to identify potential outlier samples, based on a 90% confidence interval of the group centroid and confirmed using Hotellings T-squared statistic. Two extreme outliers were removed from the contraceptive users' group, one from each dosage group, and two control samples.
Data exploration and metabolite marker identification
To explore the variation in the test data a PCA scores plot was again generated. PCA is an unsupervised technique where the group structure is not made available to the method. PCA is a very useful visual tool as it summarizes variation and projects it onto fewer dimensions.
Partial least-squares discriminant analysis (PLS-DA), a supervised multivariate technique to which sample group information is known, were used to identify combinations of variables that can distinguish between sample groups. The model assigns a VIP (variable importance in projection) value to each variable, thereby ranking variables according to their joint ability to explain the group structure. Compounds with a VIP value ≥1 were considered as potential discriminatory variables. Software used were MATLAB and Statistics Toolbox (2012b), along with the PLS-Toolbox 8.2.1 (2016) acquired through Eigenvector Research (www.eigenvector.com).
Supervised methods are provided with the grouping information and are thus able to focus on the variability of interest. This ability is more likely to produce a clearer differentiation between the two groups, as given in Figure 2B. That said, PLS-DA models' performance (i.e., prediction accuracy) is often difficult to replicate when given new data. Models tend to overfit to the data used in model development. Therefore, validation was required and performed by repeatedly leaving samples out of the development data to be used as test data. The model's performance on all data is then compared with its iterative performance given excluded data.

Univariate tests were performed in addition to the multivariate models constructed. The independent samples t-test (making no assumption regarding equal variances) and Cohen's d-value as effect size, respectively, were applied (Supplementary Table S1) to all compounds. However, because the main aim of the study was to explore the overall, cumulative effect of the COCs on the serum metabolome, and not to identify diagnostic or prognostic biomarkers, discriminatory compounds were not identified based on univariate analyses distinctively, but rather to validate the multivariate model.
Results
Participant information
A total of 78 women, complying with the set inclusion and exclusion criteria, enrolled in the study. Of these 25 women were included in the control group, whereas 27 women were classified as DRSP/20EE and 26 females as DRSP/30EE users. Venous blood was collected, processed, and analyzed as outlined in the Materials and Methods section.
Serum metabolome variations induced by COCs
Using PCA, no significant difference between the metabolome profiles of the two test groups could be identified (Supplementary Fig. S1), and we therefore refer to the test groups en bloc, that is, DRSP/EE (without the specific EE concentrations added) or COC users, from here on out.
Figure 2A provides the PCA scores plot for the first three principle components (PCs) explaining the largest amount of variation in the data, as indicated along each axis. The plot shows only a slight degree of separation between the control and COC user groups, whereas the total variance explained by the top three PCs is low (21%). This indicates that the variation induced as a result of group membership (i.e., the signal) is less than the remaining uninduced variation (i.e., the noise). We therefore resorted to a supervised method, PLS-DA. The model validated relatively well, with R-squared and Q-squared values of 95% and 63%, respectively. Although the R-squared value was high and the Q-squared value acceptable, the decrease noted when data are excluded cannot be ignored. It was therefore decided that variable selection based on the PLS-DA model should be verified using univariate statistics.
Metabolite marker identification
Of the 848 metabolites in the cleaned dataset, 255 presented with a VIP value ≥1 when doing the PLS-DA, and therefore their combined profile was recognized as a potential discriminatory metabolites signature for COC use. Their individual discriminatory ability could subsequently be derived from the univariate statistical results. The identities of 119 of these markers could be determined through comparisons with mass spectral libraries, and the details of these annotated compounds are listed in Supplementary Table S1. The identified marker compounds could be linked to a prothrombotic profile, which includes platelet aggregation, erythrocyte–platelet interaction, eryptosis, rouleaux formation, and spontaneous fibrin formation (Table 1).
Identified Marker Compounds Linked to a Prothrombotic Profile, Including Platelet Aggregation, Erythrocyte–Platelet Interaction, Eryptosis, Rouleaux Formation, and Spontaneous Fibrin Formation
The approach originating in Benjamini and Yekutieli (2001) was used to correct for multiple testing by controlling the FDR to 5%. The MATLAB script of Arnaud Delorme, made available in 2002 and sourced through MathWorks (https://uk.mathworks.com/matlabcentral/fileexchange/27960-resampling-statistical-toolkit/content/statistics/fdr.m), was used to perform adjustments. FDR adjusted p-values are reported and were viewed as statistically significant if this value was ≤0.1. Cohen's d-values exceeding 0.5 were considered of practical relevance, whereas values exceeding 0.8 were considered practically significant.
COC, combined oral contraceptive; FDR, false discovery rate; PLS-DA, partial least-squares discriminant analysis; VIP, variable importance in projection.
Discussion
The association between hypercoagulability and use of COCs remains an important clinical limitation and concern. This study makes an original contribution as the first to link specific amino acid variations, serum metabolites, and the oxidative metabolic profile with DRSP/EE use.
Figure 3 offers a synopsis of the metabolome profile and the proposed connection to the prothrombotic profile and different biophysical traits associated with DRSP/EE use. The following discussion aims to contextualize these findings in greater detail.
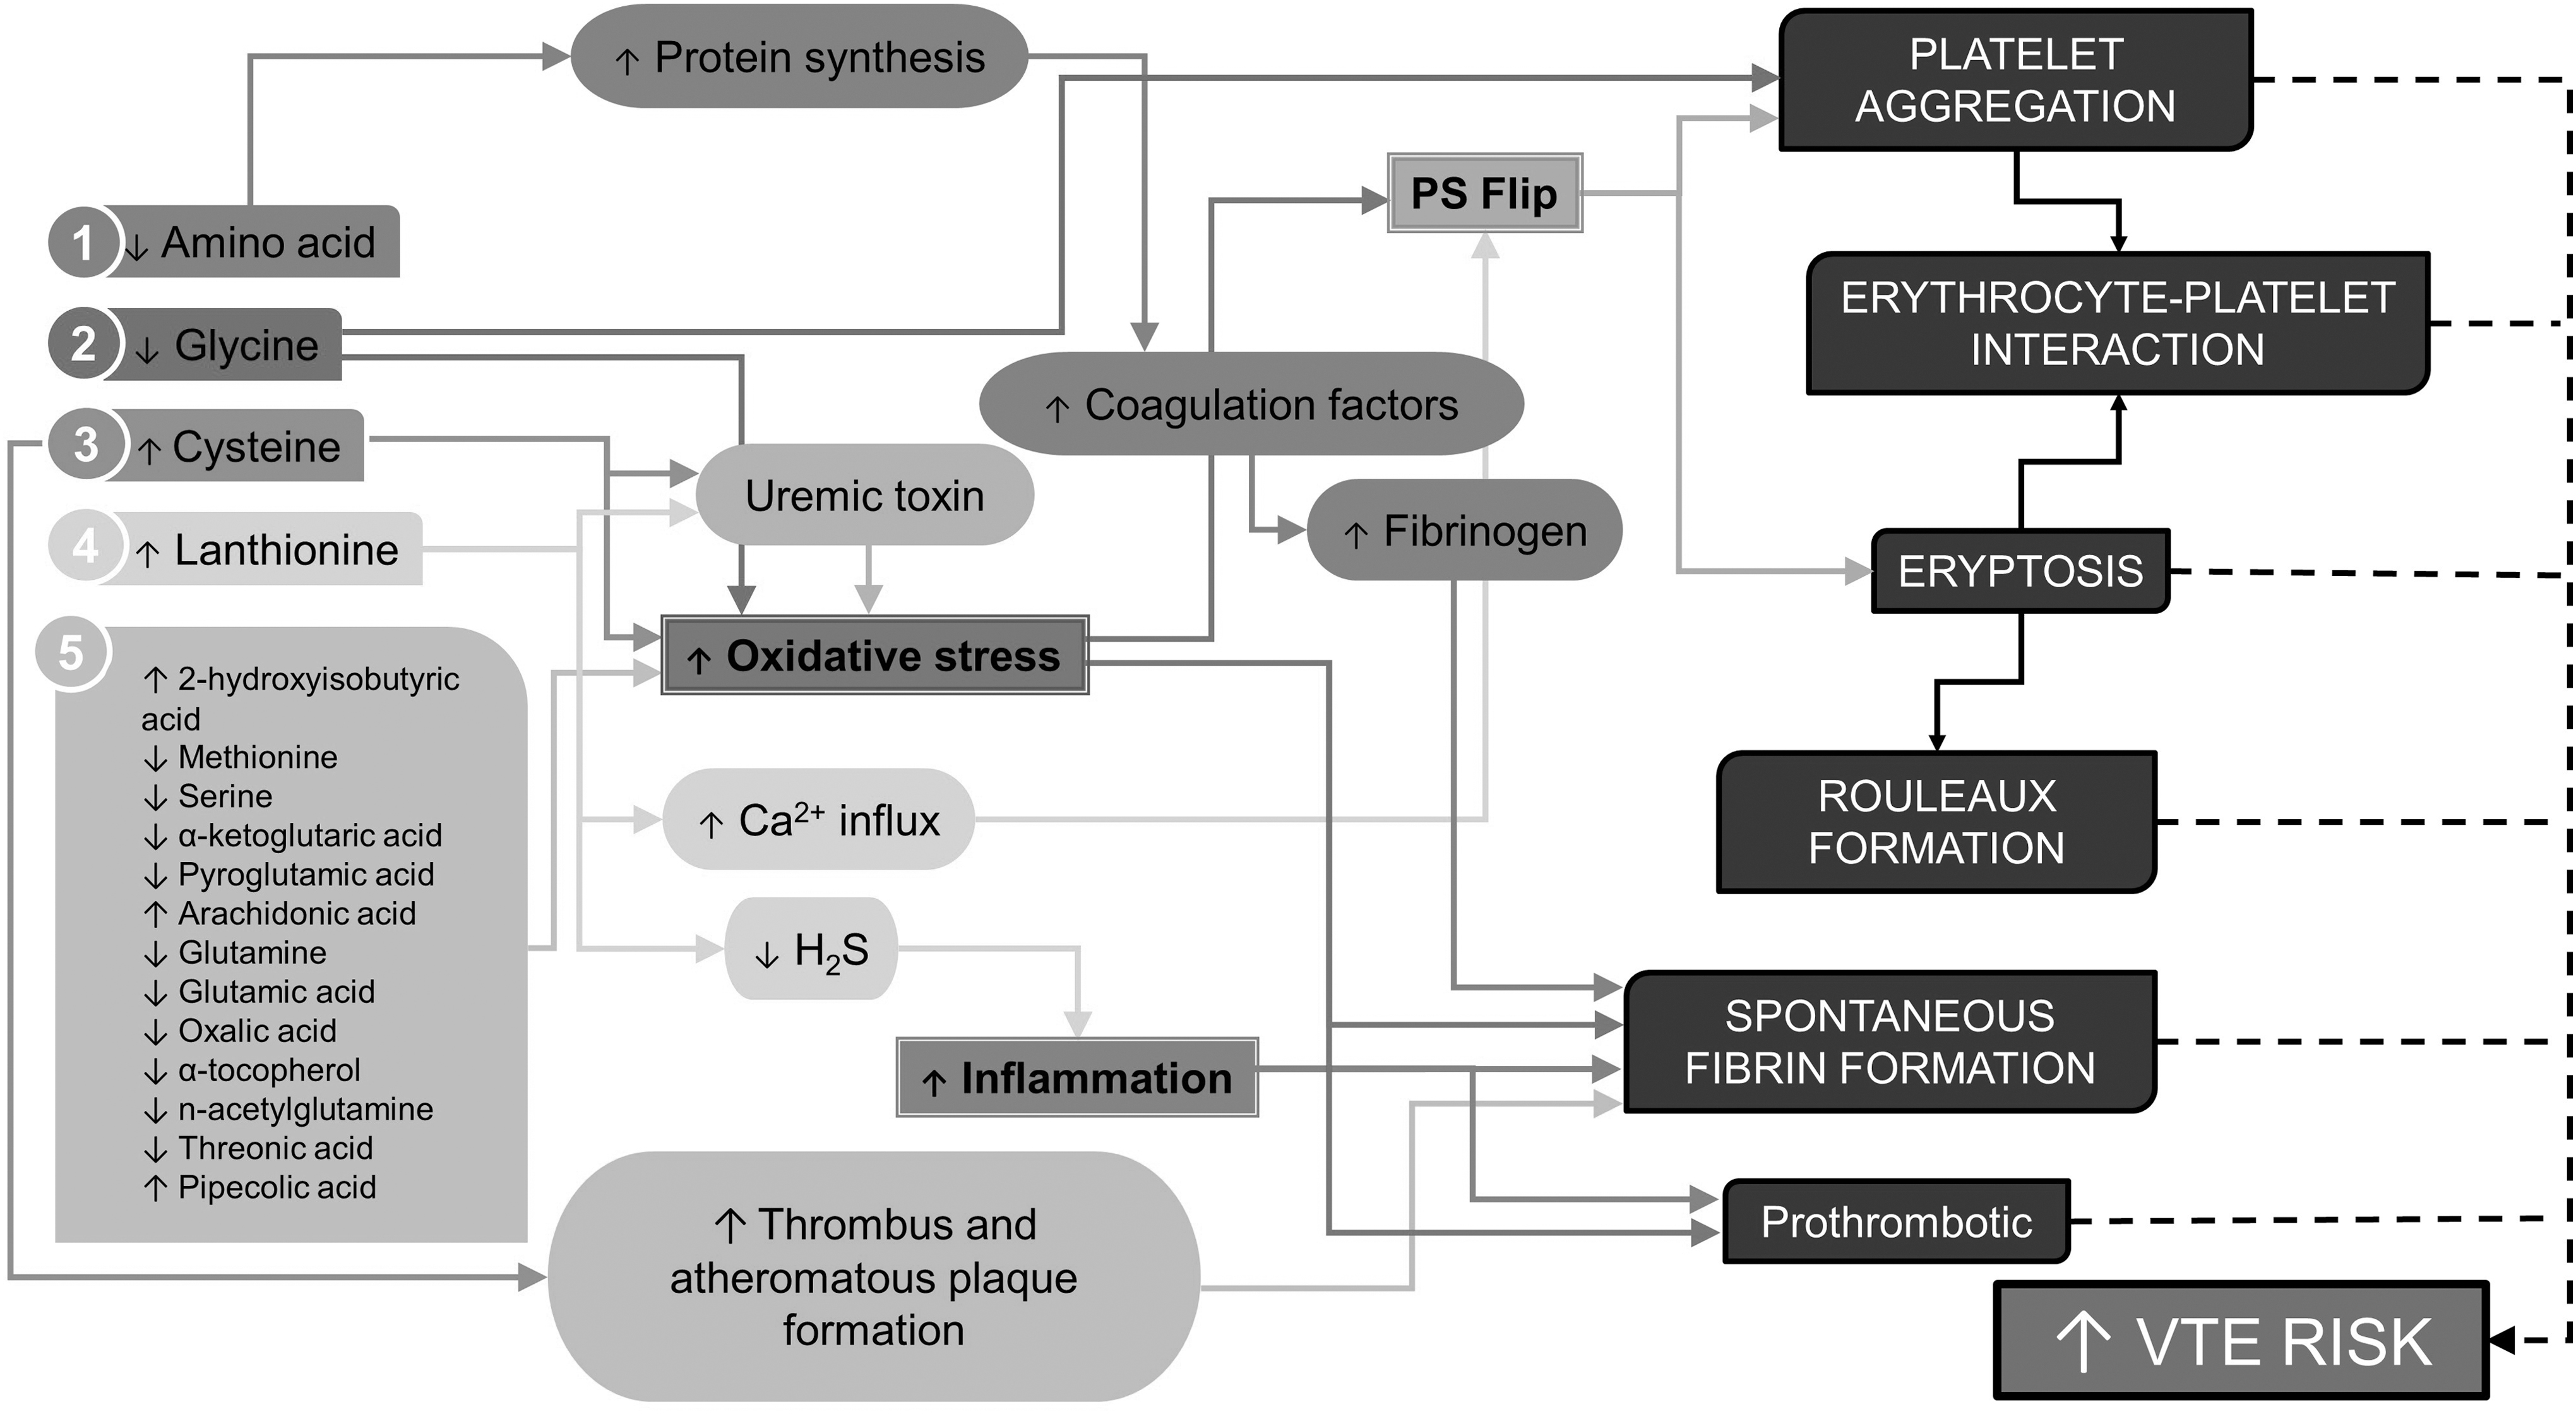
Synopsis of metabolome profile and the proposed connection to the prothrombotic profile and different biophysical traits associated with DRSP/EE use.
Amino acid changes
DRSP/EE use induced significant variation in the serum amino acids and dipeptides detected. It has been proposed that serum amino acid reduction owing to COC use promotes augmented hepatic protein synthesis (thus increased utilization of amino acids) rather than elevated breakdown or excretion of proteins (Amatayakul et al., 1994; Craft and Peters, 1971), a phenomenon that can potentially be attributed to the fact that estrogens and progestins are both anabolic hormones and associated with a positive nitrogen balance (Lecocq et al., 1967).
In addition, the use of DRSP alone may contribute to this reduction in serum amino acids because this has been additionally shown to increase muscle protein synthesis in postmenopausal women (Smith et al., 2014); postmenopausal being defined as the period associated with cessation of natural estrogen and progesterone production. Progesterone has also been shown to affect amino acid levels during a normal menstrual cycle, lowering the total amino acid count, as well as the amino acid derivatives citrulline, ornithine, and sarcosine (Sawai et al., 2018), which is reflected in our results. Ornithine and citrulline levels are also inversely related to progesterone levels during a normal menstrual cycle (Faustmann et al., 2018).
EE may also contribute to the reduced serum amino acids, by elevating the utilization of these toward the production of various clotting factors. EE is implicated in the clotting and fibrinolytic changes associated with COC use because EE has been shown to closely control liver proteins, whereas the majority of progestins do not have a significant effect. EE also promotes hepatic estrogen-dependent protein synthesis to a greater extent than some of the natural estrogens and can induce powerful stimulation of liver proteins and coagulation factors especially when combined with an anti-androgenic progestin, such as DRSP, which cannot fully counteract the effects of EE (Sitruk-Ware and Nath, 2013).
Moreover, both DRSP/30EE and DRSP/20EE is associated with increased fibrinogen levels (Krysiak et al., 2017; Stocco et al., 2015). Because fibrinogen is the precursor of fibrin, the increased amino acid utilization in this study can thus possibly explain the increased spontaneous fibrin formation in these participants (Emmerson et al., 2018).
Glycine is known to inhibit platelet aggregation (Schemmer et al., 2013), and hence the decreased abundance of this amino acid in the serum of the COC groups could potentially be involved in the increase platelet activation and aggregation as previously observed. The platelet plug, consisting of activated, aggregated platelets at an injury site, initiates the activation of the remainder of the coagulation cascade resulting in fibrin formation to form a stable clot. The reduced concentration of glycine can therefore also be indirectly responsible for the spontaneous fibrin formation previously observed in the DRSP/EE group (Emmerson et al., 2018).
The majority of the previous COC studies focused on EE in combination with other progestins other than DRSP (Campesi et al., 2012; Craft and Peters, 1971; Moller et al., 1995, 1996; Potera and Rose, 1978; Ruoppolo et al., 2014; Valtonen et al., 2010; Wang et al., 2016b). Campesi et al. (2012) were the only group to include DRSP-containing COCs (along with several other COCs), and indicated significantly reduced plasma cysteine levels in the COC group compared with the control group, even after stratifying for androgenicity of the progestin. It should however be noted that Campesi et al. did not evaluate DRSP (a nonandrogenic progestin) on its own, but along with another progestin called clormadinone; thus, the individual effect of DRSP is not clear.
In our study we found that, although cystine was significantly decreased, cysteine was significantly elevated for the DRSP/EE users compared with that of the controls. Cysteine and its thioether dimer, lanthionine, were the only amino acids that were significantly elevated in the serum of the COC groups comparatively.
Cysteine is a semi-essential, sulfur-containing, proteinogenic amino acid. It can be obtained from dietary protein or the transsulfuration of methionine and serine. This amino acid is involved in the synthesis of (1) coenzyme A, which is essential in many pathways, including the citric acid cycle, (2) the amino sulfonic acid, taurine, (3) inorganic sulfur and most importantly, (4) the antioxidant, glutathione (GSH) (Stipanuk, 2004).
Considering the latter, cysteine plays an important role in the body's antioxidant system and together with glycine and glutamate, it is involved in the synthesis of GSH (Sekhar et al., 2011). The liver is responsible for regulating free cysteine concentration and plays a crucial role in maintaining the fine balance between adequate amount of cysteine in circulation to sustain normal metabolism while keeping the concentrations below the toxic threshold. The liver uses GSH synthesis as a means toward maintaining healthy cysteine levels; and hence GSH serves as both a cysteine reservoir and a mode of transportation of cysteine from the liver to other tissues ( Stipanuk, 2004; Stipanuk et al., 2006).
In contrast, it has also been shown that cysteine can mediate an overproduction of both free radicals and hydrogen peroxide, thus functioning as a prooxidant agent that brings about oxidative damage (Andine et al., 1991; Dudman et al., 1991; Hogg, 1999; Lehmann et al., 1993; Saez et al., 1982; Stipanuk, 2004; Stipanuk et al., 2006, 2009). Too high cysteine may also expedite GSH oxidation resulting in a metabolic “short circuit” subsequently negatively affecting the reducing capacity of the cell (Hogg, 1999).
Various processes implicated in both thrombus and atheromatous plaque formation are additionally supported by the availability of auto-oxidized cysteine, and these include the following: (1) generating oxidants and free radicals with subsequent oxidative damage to endothelial cells, (2) modifying low-density lipoproteins to promote the formation of foam cells, (3) forming an adduct with nitric oxide that impairs endothelial function, and (4) promoting iron-induced lipid peroxidation (Heinecke et al., 1987; Hogg, 1999; Parthasarathy, 1987; Sheu et al., 2000; Starkebaum and Harlan, 1986; Stipanuk et al., 2006; Tsai et al., 1994; Welch et al., 1997).
Increased cysteine levels are also associated with vascular occlusive diseases such as cardiovascular, cerebral, and peripheral vascular disease (Andersson et al., 1995; Araki et al., 1989; Mansoor et al., 1995; Mills et al., 2000), coronary heart disease (Ozkan et al., 2002), and myocardial and cerebral infarction (Araki et al., 1989; Verhoef et al., 1996).
The increased cysteine concentration in the COC groups could therefore be a trigger for the spontaneous fibrin formation observed in the COC groups and the biophysical changes observed for both the erythrocytes and platelets as a result of its oxidative properties (Emmerson et al., 2018).
The oxidized form of this plasma aminothiol is furthermore classified as a uremic toxin (Duranton et al., 2012; Himmelfarb et al., 2002), which is discussed in the Uremic Toxins section hereunder.
Lanthionine, a naturally occurring amino acid, which is nonproteogenic, is the byproduct of H2S biosynthesis from cysteine (Chiku et al., 2009; Perna et al., 2017). Lanthionine has been shown to induce an increased calcium influx in cells while inhibiting the release of H2S, suggesting that lanthionine may be responsible for interfering with calcium signaling while decreasing the H2S concentration (Vigorito et al., 2019). Increased cytosolic calcium has been shown to disrupt erythrocyte membrane integrity leading to eryptosis (Harisa et al., 2017; Mohanty et al., 2014), as previously observed in DRSP/EE users (Emmerson et al., 2018) and which will be discussed in a later section.
H2S in turn has both anti-inflammatory and antioxidant properties (Shefa et al., 2018; Whiteman and Winyard, 2011; Zimmermann et al., 2018). Through its inhibiting effect on H2S (Assem et al., 2018), elevated lanthionine levels observed in the serum of the COC groups provides another contributing factor to the oxidative stress observed in these COC users. Oxidative stress in turn is well known to alter fibrin structure (Shacter et al., 1994; Wang et al., 2016a), and also contribute to the aforementioned eryptosis and platelet aggregation through phosphotidylserine exposure on the plasma membrane.
Inflammation activates the coagulation system while preventing fibrinolytic action (Esmon, 2005; Swanepoel et al., 2015). Lanthionine could therefore be indirectly responsible for the spontaneous fibrin formation as well as eryptosis, platelet activation, and erythrocyte–platelet interaction previously seen in the COC groups (Emmerson et al., 2018).
Uremic toxins
Lanthionine has recently been identified as a uremic toxin (Perna et al., 2017). Uremic toxins are a group of toxic substances that accumulate in body fluids, ultimately resulting in uremia (Glassock, 2008). Uremic toxins may also induce oxidative stress, which in turn is linked to increased hypercoagulability and vascular calcification, ultimately increasing the risk of thrombosis (Assem et al., 2018). The increase in the two uremic toxins, cysteine and lanthionine, observed in the COC groups could thus provide another possible link to both spontaneous fibrin formation as well as eryptosis and platelet aggregation seen in the COC users (Emmerson et al., 2018).
Oxidative stress
A number of studies have linked oral contraceptive use to a general increase in oxidative stress in female users (Cauci et al., 2016; Chen and Kotani, 2012; Pincemail et al., 2007). Only one such study to date has specifically shown DRSP/30EE also to do so, with elevated measures of oxidative stress and increased lipid peroxidation determined (De Groote et al., 2009). In the current metabolomics investigation, several metabolites associated with increased oxidative stress were detected as markers for both DRSP/20EE and DRSP/30EE use. The observed drug-induced increase in serum 2-hydroxybutyric acid and cysteine, accompanied by the reduced levels in serum methionine and serine, indicates a shift in the methionine-to-GSH pathway toward an increased synthesis of hepatic GSH, a powerful antioxidant (Lord and Bralley, 2008).
In addition, many other identified metabolite markers (α-ketoglutaric acid, pyroglutamic acid, arachidonic acid, glutamine, glutamic acid, oxalic acid, alpha-tocopherol, glycine, and N-acetylglutamine) characterizing the COC groups, have previously been associated with elevated oxidative stress (Combrink et al., 2019; Wang et al., 2017; Wu et al., 2004). Threonic acid, an oxidation product of the antioxidant vitamin C (Combrink et al., 2019), and pipecolic acid a marker for peroxisomal disorders (Peduto et al., 2004), additionally supports these findings in the COC users. Elevated oxidative stress levels in the COC users is strongly associated with the previously observed hematological variations reported in the COC users, including fibrin formation, eryptosis, and platelet aggravation and aggregation (Emmerson et al., 2018).
Fibrin formation
Fibrinogen is particularly prone to oxidative modification (Shacter et al., 1994). When fibrinogen is exposed to oxidative stress it alters the fibrillization of the fibrinogen that results in changes to the cross-linking, branching, and height distribution of the formed fibrin (Wang et al., 2016a), most likely resulting in the spontaneous fibrin formation observed in the DRSP/EE group (Emmerson et al., 2018).
Eryptosis
The lifespan of circulating erythrocytes or red blood cells (RBCs) is limited by senescence to 100–120 days (Lang et al., 2006, 2012). RBC aging is characterized by morphological changes, which includes volume, density, and shape alterations as well as fine topographical changes on the cell surface (Qadri et al., 2017). Before senescence, erythrocytes might also experience external assaults that compromise their membrane integrity and survival rate, and ultimately leads to suicidal death.
Suicidal erythrocyte death, also referred to as eryptosis, is known to be triggered by a number of endogenous and exogenous factors, including oxidative stress (Bialevich et al., 2014). These substances either trigger an increase in cytosolic free calcium, enhance the production of endogenous ceramide, or activate additional mechanisms such as ATP depletion. Multiple eryptotic mechanisms may also be triggered concurrently (Lang and Qadri, 2012; Lang et al., 2006).
One of the hallmarks of eryptosis and a means to measure eryptosis in erythrocytes is the breakdown of the cell membrane phospholipid asymmetry and the reversal of the cell membrane phospholipid phosphatidylserine (PS), from the inner leaflet to the exterior of the membrane, which is regulated by flippases (Qadri et al., 2017).
The increased oxidative stress markers as measured previously in the COC groups may thus cause activation of nonselective cation channels, resulting in an increase in intracellular Ca2+ that leads to the activation of two pathways: (1) activation of calpain, which results in degradation of cytoskeletal proteins and thus induces cell membrane blebbing, (2) stimulation of cell membrane scrambling, which leads to the breakdown of phospholipid asymmetry of the cell membrane and PS exposure on the cell surface. These morphological changes are referred to as rouleaux formation.
Considering the aforementioned increase in oxidative metabolic markers (including cysteine and lanthionine) accompanied by the decreased antioxidants along with the increased Ca2+ influx associated with the elevated lanthionine levels could therefore possibly be responsible for the eryptosis and rouleaux formation previously observed in the DRSP/EE users (Emmerson et al., 2018).
Platelet activation and aggregation
When platelets become activated, the subsequent alterations to the cell membrane results in PS translocation. This not only regulates the production of thrombin but is also considered a key hemostatic regulator (Lentz, 2003; Lhermusier et al., 2011). Just as with erythrocytes, oxidative stress can thus also explain platelet activation and the subsequent interaction with erythrocytes previously seen in the DRSP/EE groups (Emmerson et al., 2018).
Conclusions
The COC induced serum amino acid changes, particularly that of glycine, cysteine, and lanthionine, when coupled with the elevated oxidative stress profile, provides credible explanations for the hypercoagulability, eryptosis and rouleaux formation, platelet aggregation, spontaneous fibrin formation, and the interactions between erythrocytes and platelets/fibrin previously reported in this study. Our study is the first to link specific metabolites of the oxidative metabolic profile associated with DRSP/EE use to the specific biophysical coagulatory alterations observed in the same individuals. This study also emphasizes the importance of an interdisciplinary approach to evaluate VT risk associated with DRSP/EE use.
Clinical medicine continues to thrive for improvement in care for the individual. This study further highlights that metabolomics is emerging as a powerful tool that can, in the future, inform the practice of precision medicine.
Footnotes
Author Disclosure Statement
The authors declare they have no conflicting financial interests.
Funding Information
A.C. Swanepoel received funding from the National Research Foundation (NRF) (South Africa) for rated researchers; the source was in no way involved in any part of this article. No payment was received for the writing of this manuscript.

Abbreviations Used
References
Supplementary Material
Please find the following supplemental material available below.
For Open Access articles published under a Creative Commons License, all supplemental material carries the same license as the article it is associated with.
For non-Open Access articles published, all supplemental material carries a non-exclusive license, and permission requests for re-use of supplemental material or any part of supplemental material shall be sent directly to the copyright owner as specified in the copyright notice associated with the article.
