
Abstract
Alzheimer's disease (AD) is a leading cause of dementia and a neurodegenerative disease. Proteomics and post-translational modification (PTM) analyses offer new opportunities for a comprehensive understanding of pathophysiology of brain in AD. We report here multiple PTMs in patients with AD, harnessing publicly available proteomics data from nine brain regions and at three different Braak stages of disease progression. Specifically, we identified 7190 peptides with PTMs, corresponding to 2545 proteins from brain regions with intermediate tangles, and 6864 peptides with PTMs corresponding to 2465 proteins from brain regions with severe tangles. A total of 103 proteins with PTMs were expressed uniquely to intermediate tangles and severe tangles compared to no tangles. Kyoto Encyclopedia of Genes and Genomes pathway enrichment analysis suggested the association of these proteins in AD progression through platelet activation. These modified proteins were also found to be enriched for the tricarboxylic acid (TCA) cycle, respiratory electron cycle, and detoxification of reactive oxygen species. The multi-PTM data reported here contribute to our understanding of the neurobiology of AD and highlight the prospects of omics systems science research in neurodegenerative diseases. The present study provides a region-wise classification for the proteins with PTMs along with their differential expression patterns, providing insights into the localization of these proteins upon modification. The catalog of multi-PTMs identified in the context of AD from different brain regions provides a unique platform for generating newer hypotheses in understanding the putative role of specific PTMs in AD pathogenesis.
Introduction
Alzheimer'
Bridging the gap in perceiving the molecular mechanisms involved in AD progression necessitates the development of novel biomarkers, which would serve for effective early diagnosis or therapeutic strategies for AD. The known risk factors associated with the development and progression (genetic or environmental) of AD are hypothesis driven as they involve the study of a single gene/protein linked with amyloid plaques or formation of NFTs and lack in providing definitive information leading to late-onset AD (Livingston et al., 2017; Namba et al., 1991). In contrast, multiomics investigations involving genomics, transcriptomics, and proteomics offer a rich source of extensive information on genes/proteins and enable understanding the cellular and molecular interactions (Drummond and Wisniewski, 2017).
High-resolution mass-spectrometry based proteomic studies of the human brain regions are crucial as they complement the next frontiers for the data derived by genomics and transcriptomics approaches (Seyfried et al., 2017).
Understanding AD pathogenesis using tandem mass spectrometry (MS/MS)-based proteomics has multiple advantages, such as the use of minute amounts of brain tissues for quantification of thousands of proteins and aid discovery of novel protein features found altered in pathogenesis and progression of AD. Proteomics can also assist in the detection of multiple post-translational modifications (multi-PTMs) of proteins, which might have an important molecular role in any biological conditions, and therefore can be used to identify proteins associated with the pathogenesis of AD (Deolankar et al., 2019; Drummond et al., 2018).
Proteomic studies comparing protein expression between vulnerable brain regions from cognitively normal controls and AD together form a vast amount of data reported for understanding the mechanism of AD progression (Andreev et al., 2012; McKetney et al., 2019; Seyfried et al., 2017; Xu et al., 2019; Zhang et al., 2018). However, a considerable portion of MS-derived data remains unassigned to any proteins (Nesvizhskii et al., 2006). This poor assignment of MS/MS spectra and identification of annotated proteins may be due to several restricted parameters applied during database searches and further due to the presence of several PTM containing peptides, which would not be detected unless otherwise specified to the search algorithms (Flikka et al., 2006; Nesvizhskii et al., 2006; Nielsen et al., 2006). Thus, we used two iterations of data searches and assignment of spectra by incorporating multi-PTM analysis in AD samples.
The present study is an extension of our quest for detecting multi-PTMs from brain regions in the context of AD (Deolankar et al., 2019). A publicly available label-free proteomics data of nine brain regions from three individuals covering three Braak stages of disease progression (quantified through NFTs) were subjected for multi-PTM analysis. The selected study (McKetney et al., 2019) included brain regions from the limbic (thalamus, caudate nucleus, amygdala, and entorhinal cortex) and cerebral cortex section (middle frontal gyrus, inferior parietal lobule, superior temporal gyrus, and visual cortex).
A global PTM search from unassigned spectra using a combination of existing and in-house generated computational tools was implemented. Previously, we reported a catalog of widely studied crucial protein PTMs such as phosphorylation, citrullination, methylation, and acetylation from two anatomical brain regions (Deolankar et al., 2019). In this study, using data from Mcketney et al. (2019) an extended catalog of PTMs was searched, which shows growing pieces of evidence directed toward unwinding the relationship between the role of hydroxylation and nitrosylation of proteins leading to protein aggregation, which is associated with AD pathogenesis (Aksenov et al., 2001; Polidori et al., 2007; Zhao et al., 2015).
Select PTMs in this study from the literature show relationship with AD upon altered modification, such as acetylation and methylation are reported to be involved in microtubule associated autophagy and tau aggregation (Balmik and Chinnathambi, 2021; Esteves et al., 2019; Huseby et al., 2019; Son et al., 2021). Protein citrullination is a majorly observed modification in central nervous system of AD related studies (Jin et al., 2013; Nicholas, 2013). Protein phosphorylation is widely studied modification and has set a quest for finding novel therapeutics through understanding hyperphosphorylation of tau from early to late stage AD from past few years (Barthelemy et al., 2020; Ercan-Herbst et al., 2019; Neddens et al., 2018).
Materials and Methods
Data sources and database search for peptide identification
The publicly available high-resolution MS-derived data raw files were downloaded from the ProteomeXchange consortium through the Proteomics IDEntification (PRIDE) repository with ID: PXD010603. The corresponding author of the reanalyzed publicly available data was also informed by the authors of the present study, and an Institutional Ethics Committee Waiver was obtained (YEC-1/2020/010). The age, gender, and brain regions were used to generate the data by Mcketney et al. (2019) and are depicted in Figure 1A.
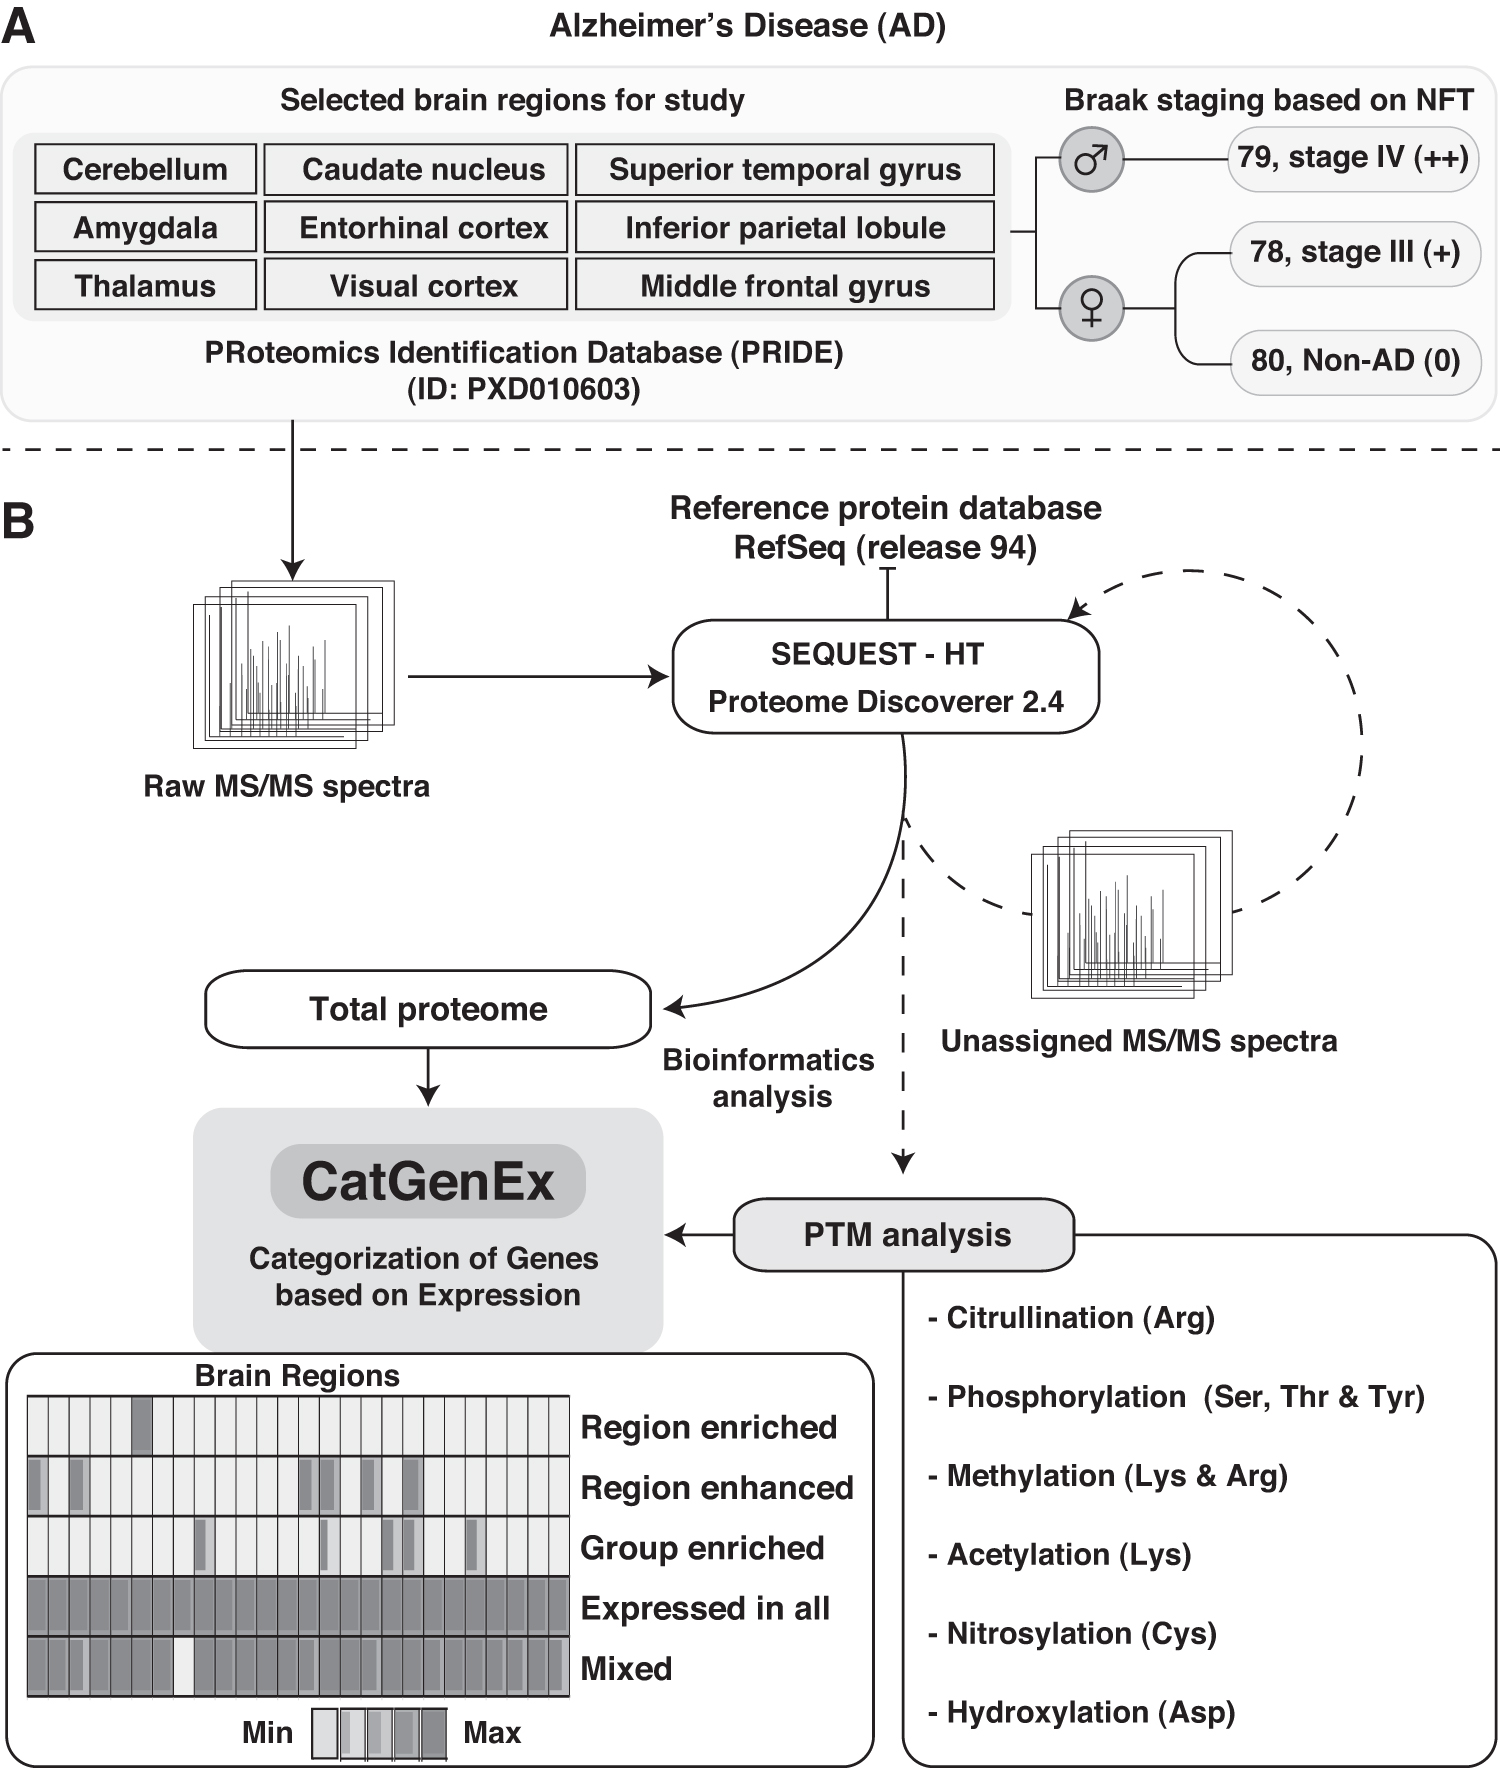
MS/MS data were analyzed in two steps. A routine proteome search was performed against the reference human protein database. The unassigned MS/MS spectra from the previous step were further searched for peptides harboring different types of PTMs. The detailed workflow is depicted in Figure 1B and is further described below.
The MS/MS raw files were searched using SEQUEST-HT integrated on a Proteome Discoverer (version 2.4) software suite (Thermo Scientific, Bremen, Germany) against a Human RefSeq (release 94) protein database obtained from NCBI. Full tryptic specificity with up to one missed cleavage along with static modification of carbamidomethylation of cysteine was specified. Dynamic modification for acetylation of protein N-termini and oxidation of methionine was included. The mass error was set at 10 ppm for precursor ion and fragment ion at 0.05 Da. A false discovery rate of 1% at levels of peptide spectrum match (PSM), peptide, and protein was considered, and the q-value was calculated by Percolator (Kall et al., 2007) integrated within the Proteome Discoverer suite. The resultant unassigned spectra were converted into Mascot Generic Format (MGF) for subsequent searches.
The MGF files were searched against the NCBI Human RefSeq release 94 protein database through SEQUEST-HT using Proteome Discoverer (version 2.4) software suite (Thermo Scientific). Similar to the previous searches, a full tryptic with one missed cleavage was specified. Variable modification was used for phosphorylation of serine, threonine, and tyrosine, citrullination of arginine, methylation of lysine and arginine, hydroxylation of aspartate, oxidation of methionine, nitrosylation of cysteine, and acetylation of lysine. Oxidation of methionine may not be a natural PTM.
Many peptides with this experimental artifact may be missed. Therefore, we included it to identify peptides with other PTMs, which may also have oxidation of methionine. The static modification (carbamidomethylation of cysteine) was kept as mentioned in the previous step. Inbuilt algorithms from the Proteome Discoverer suite were used for estimating the probability of PTM site using ptmRS node (Taus et al., 2011), and q-values were calculated using Percolator node (Kall et al., 2007). An FDR of 1% was applied at the levels of PSM, peptide, and protein.
Bioinformatics analyses
Analyzing and summarizing PTMs
High-confidence PTMs from unassigned spectra were profiled using post-translational modification-profiling (PTM-Pro, version 2.0) tool (Patil et al., 2018). Selected attributes for summarizing PTMs in PTM-Pro were ptmRS site probability ≥75% and site-specific comparison with dbPTM (release 2019) repository. Homo sapiens and NCBI Human RefSeq (release 94) were used as a reference organism and protein database, respectively, in the background. The modified peptides were further classified as ambiguous peptides (≤75% ptmRS site probability) and unambiguous peptides (≥75% ptmRS site probability).
Development of CatGenEx
In multiomics studies, the analysis usually comprises several samples, and the resultant expression matrix of such samples needs categorization into logical categories based on expression patterns. In this regard, there are several statistical packages in R, such as PCA, UMAP to cluster samples. However, enrichment of tissues/samples with these approaches occurs at the sample levels, and rather at the level of gene/features. Categorization of Gene Expression, CatGenEx, was designed as a cross-platform command-line interface tool and developed in PERL scripting language (v5.22.1). This tool incorporates a method to categorize features as described earlier (Uhlen et al., 2015; Wang et al., 2019). The tool is customized for the analysis of data of quantitative or expression studies. A minimum of six samples/columns are required in the matrix for categorization. The source code is freely available for download at GitHub (https://github.com/arunhpatil/CatGenEx).
Differentially expressed proteins
Label-free quantification was performed through an in-house PERL script (Deolankar et al., 2019) for obtaining intensity-based absolute quantification (iBAQ) value. In brief, the abundance of each protein is calculated as the ratio of the sum of intensities of representative PSM to the number of possible theoretical peptides. The iBAQ values were used for determining differentially expressed proteins from intermediate tangles and severe tangles' brain regions by calculating fold change (FC) against regions with no tangles. Biological significance was calculated using FC ratios ≥1.5 for overexpressed proteins and FC ratios ≤0.5 for downregulated proteins, and statistical significance was computed using analysis of variance (ANOVA).
Functional annotation and coexpression analysis
Functional classification and annotation of modified proteins were obtained by Gene Ontology enrichment analysis and visualization tool (GOrilla) (Eden et al., 2009), STRING network and functional analysis database (Szklarczyk et al., 2019), and Kyoto Encyclopedia of Genes and Genomes (KEGG) pathways (Kanehisa and Goto, 2000). These PTMs containing proteins were also compared with the Plasma Proteome Database (Nanjappa et al., 2014) and the Mitochondrial Protein Database (Calvo et al., 2016) for studying the localization of identified proteins. CEMiTool R package from Bioconductor was used for coexpression and interaction analysis (Russo et al., 2018).
Results and Discussion
An average of 1,626,104 unassigned spectra from each brain region was considered to search for multi-PTMs. The unassigned spectra resulted in 13,231 nonredundant peptides with 17,735 PTM sites corresponding to 5033 proteins across nine regions of the brain. The summary of PTMs, peptides, and proteins from each region is listed in Table 1, and region wise identified modification is summarized in Table 2. The proteins identified in this study show a similar trend in number of proteins, that is, maximum from middle frontal gyrus and minimum from caudate nucleus as reported by McKetney et al. (2019). The modified proteins identified in this study compared to McKetney et al. resulted in 27.8% common proteins (Supplementary Data S1, Fig. 1A).
Summary of Post-Translational Modifications and Corresponding Number of Modified Peptides and Proteins Identified in Each Sample from Nine Brain Regions
0, Regions with no tangles; +, regions with intermediate tangles; ++, regions with severe tangles.
A, amygdala; C, cerebellum; CN, caudate nucleus; EC, entorhinal cortex; IPL, inferior parietal lobule; MFG, middle frontal gyrus; NFT, neurofibrillary tangle; PTM, post-translational modification; STG, superior temporal gyrus; TH, thalamus; VC, visual cortex.
Brain Region and Neurofibrillary Tangle Stage Wise Summary of Post-Translational Modifications Across All Nine Brain Regions
0, Regions with no tangles; +, regions with intermediate tangles; ++, regions with severe tangles.
A complete list of PTMs along with the site of modifications, corresponding peptides, and proteins is provided in the Supplementary Table S1. The MS/MS search results are available through ProteomeXchange with identifier PXD026614, and spreadsheets with list of proteins and peptides are available for users to freely download at URL: https://ptm-pro.inhouseprotocols.com/AD_PTM/
Summary of multi-PTMs identified
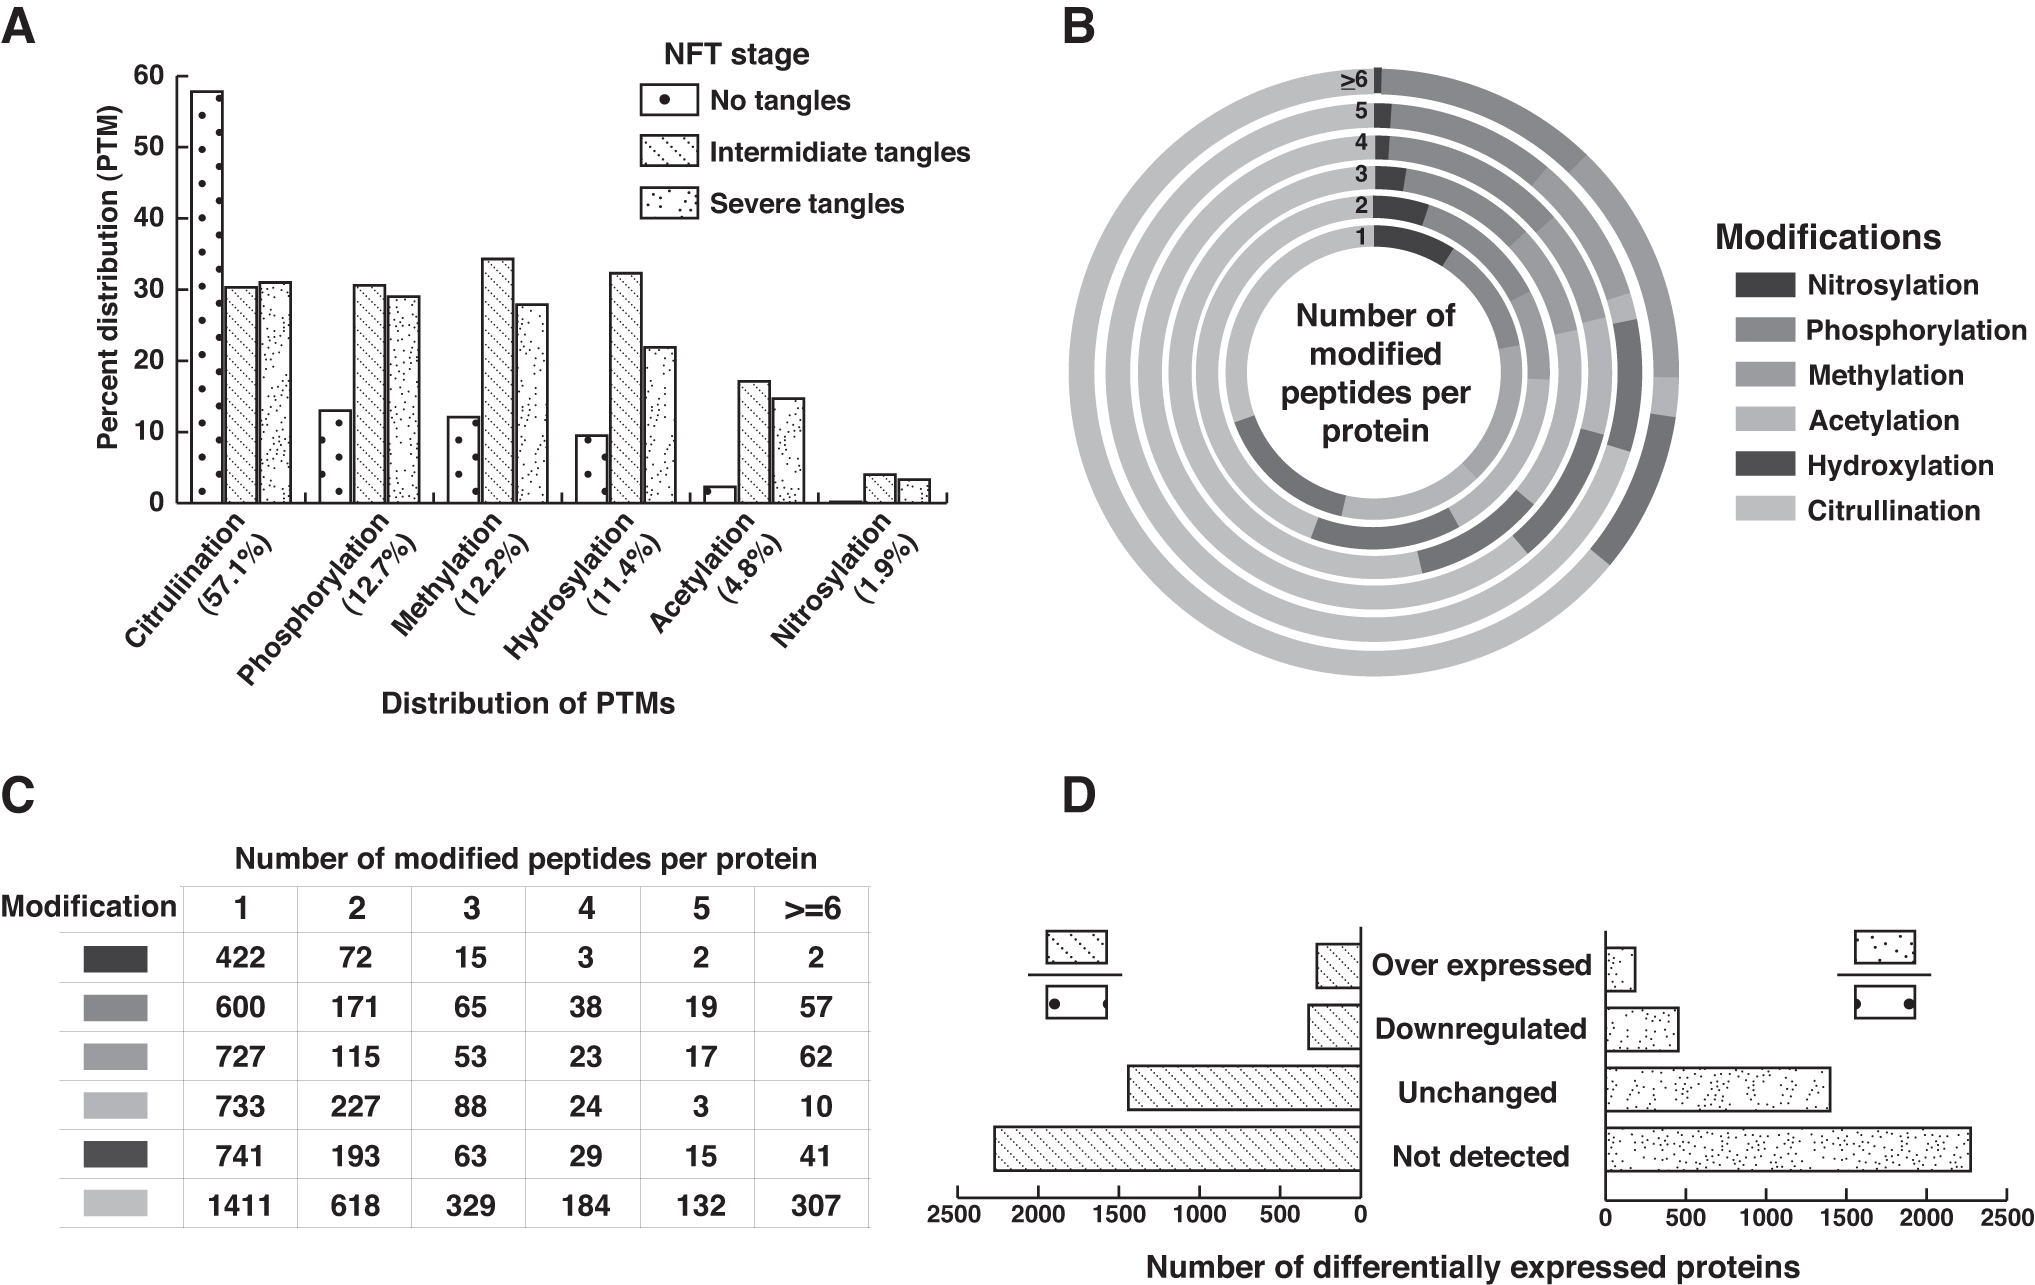
The distribution of identified PTMs across the individual brain regions and the number of peptides per protein with PTM type is represented in Figure 2A–C. Representative spectra for peptide with PTMs are provided in Supplementary Data S2.
Summary of PTM analysis:
Briefly, 10,930 peptides with PTMs corresponding to 4338 proteins from regions with no tangles, 6835 peptides with PTMs corresponding to 2465 proteins from regions with intermediate tangles, and 6987 peptides with PTMs corresponding to 2516 proteins from regions with severe tangles were identified in the analysis. Site-specific comparison of PTMs with experimentally observed and curated PTMs available at the dbPTM (Huang et al., 2019) database yielded 2028 sites (corresponding to 956 proteins) reported in the dbPTM database, while 15,707 sites (corresponding to 4858 proteins) were unique to this study, that is, are not reported in dbPTM database. Furthermore, the PTMs from the current study to our previously published study resulted in 1661 PTMs corresponding to 703 proteins (Supplementary Data S1, Fig. 1B).
High-confidence proteins with PTMs were quantified by iBAQ. The iBAQ analysis resulted in 88 proteins expressed only in regions with no-tangles and is involved in processes leading to cellular, macromolecule, and protein localization. A total of 103 proteins with PTMs were expressed in regions with intermediate and severe tangles. These proteins from AD regions are associated with positive regulation of cellular protein metabolic process and protein modification process. Among the regions from intermediate and severe tangles, 85 proteins are listed as plasma proteins (Nanjappa et al., 2014) and are enriched for neuronal projection and axon guidance pathway (Supplementary Table S2) (Wilson et al., 2019).
We found 30 proteins to be modified with one or the other PTMs and exclusively expressed in brain regions with severe tangles (Supplementary Table S2). When subjected to Gene Ontology analysis, among these 30 proteins, 10 proteins (ATP6V0A1, COL1A1, DNM3, FSD1, GJA1, HBA2, HIST1H1D, HIST1H2BD, NDUFS3, and RAP1GDS1) were found to be the part of a biological process leading to the assembly of protein-containing complexes, which is a major process associated with progression of AD. These 30 proteins with PTMs were also found to be enriched in molecular function associated with tubulin and microtubule binding.
Besides, a recent proteomic study of AD patients by Seyfried et al. (2017) has shown DNM3, NDUFS3, HBA2, and COL1A1 to be differentially expressed (4 among the 30 proteins found in our study) in the frontal cortex. These four proteins were also found to be altered at genomic and transcriptomic levels by others (Patel et al., 2019; Vanni et al., 2018). A list of all proteins with their intensities across nine regions is given in Supplementary Table S2; details regarding PTMs, functions, and FC values of the proteins mentioned in this section are listed in Table 3.
List of Important Post-Translational Modification Containing Proteins from and Their Modification from This Study, Associated Biological Functions, and Differential Expression Fold Change Values Showing Significance with Respect to Proteins from No-Tangle Brain Regions
Presence of modification is marked with highlighted box in respective modification column for corresponding proteins.
Overexpressed proteins with respect to NT.
Downregulated protein expression with respect to NT.
No, protein not differentially expressed for the given condition.
Ac, acetylation; Ci, citrullination; DE, differential expression; FC, fold change; H, hydroxylation; IT, values from intermediate tangles regions; M, methylation; N, nitrosylation; NT, values from no tangle regions; O, oxidation; P, phosphorylation; ST, values from severe tangle regions; w.r.t., with respect to.
Region-specific protein categorizations
To understand the specificity of the proteins with PTMs toward selected regions of the brain, they were categorized based on the iBAQ quantifications into five classes using CatGenEx. The normalized iBAQ values for each of 5085 proteins with PTMs were classified into 1 of 5 categories among the 26 regions of the brain (9 regions—thalamus, caudate nucleus, amygdala, entorhinal cortex, middle frontal gyrus, inferior parietal lobule, superior temporal gyrus, cerebellum, and visual cortex each from “no tangles” and “severe tangles” patient brain, and 8 regions except cerebellum from patients with “intermediate tangles”) based on the method followed similar to Uhlen et al. (2015) and Wang et al. (2019).
The categories include: (1) “Region enriched”—at least a fivefold higher iBAQ level in 1 region compared to all other regions; (2) “Group enriched”—fivefold higher average iBAQ value with expression greater than 60% in a group of 2–7 regions compared to all other regions; (3) “Expressed in all regions”—detected in all 26 regions and does not belong to the category “Group enriched”; (4) “Region enhanced”—at least a fivefold higher iBAQ expression in 1 tissue compared to the average value of all 26 regions and not in “Group enriched”; (5) “Mixed”—the remaining genes detected in 1–25 regions and none of the above categories. Representative figures with each selected category are provided in Supplementary Data S1, Fig. 4A–H).
Interestingly, majority of the modified proteins were region enriched (2322 proteins) in the regions with no tangles compared to regions with intermediate tangles and severe tangles (922 proteins in both). We even observed increased expression of proteins showing group enrichment (935 proteins) in intermediate tangles, and in regions with severe tangles majority of proteins were classified as mixed expression (Supplementary Table S2). The categorization results are in concurrence with earlier reports suggesting widespread damage affecting various neurons from multiple regions of the brain during the advancement of AD (Johnson et al., 2020; Liang et al., 2008; Twine et al., 2011).
Functional analysis of proteins with PTMs
Functional analysis of the proteins with PTMs through the CEMiTool R package available under Bioconductor was performed. The tool was used for identifying protein modules enriched and associated with specific metabolic and signaling pathways from KEGG, Reactome, and MSigDB databases integrated as background. This resulted in identifying 3 enriched modules consisting of 638 proteins with PTMs from nine brain regions (Supplementary Table S3).
The enriched pathways from these modules such as the tricarboxylic acid (TCA) cycle and respiratory electron cycle, detoxification of reactive oxygen species, axon guidance, and so on are known for their function in maintaining neuronal health, while defects in these pathways suggest steps toward AD-related neurodegeneration (Sonntag et al., 2017; Tonnies and Trushina, 2017; Wang et al., 2020) (Supplementary Table S3). Proteins associated with significant pathways are mentioned in Table 3 along with PTMs and FC values.
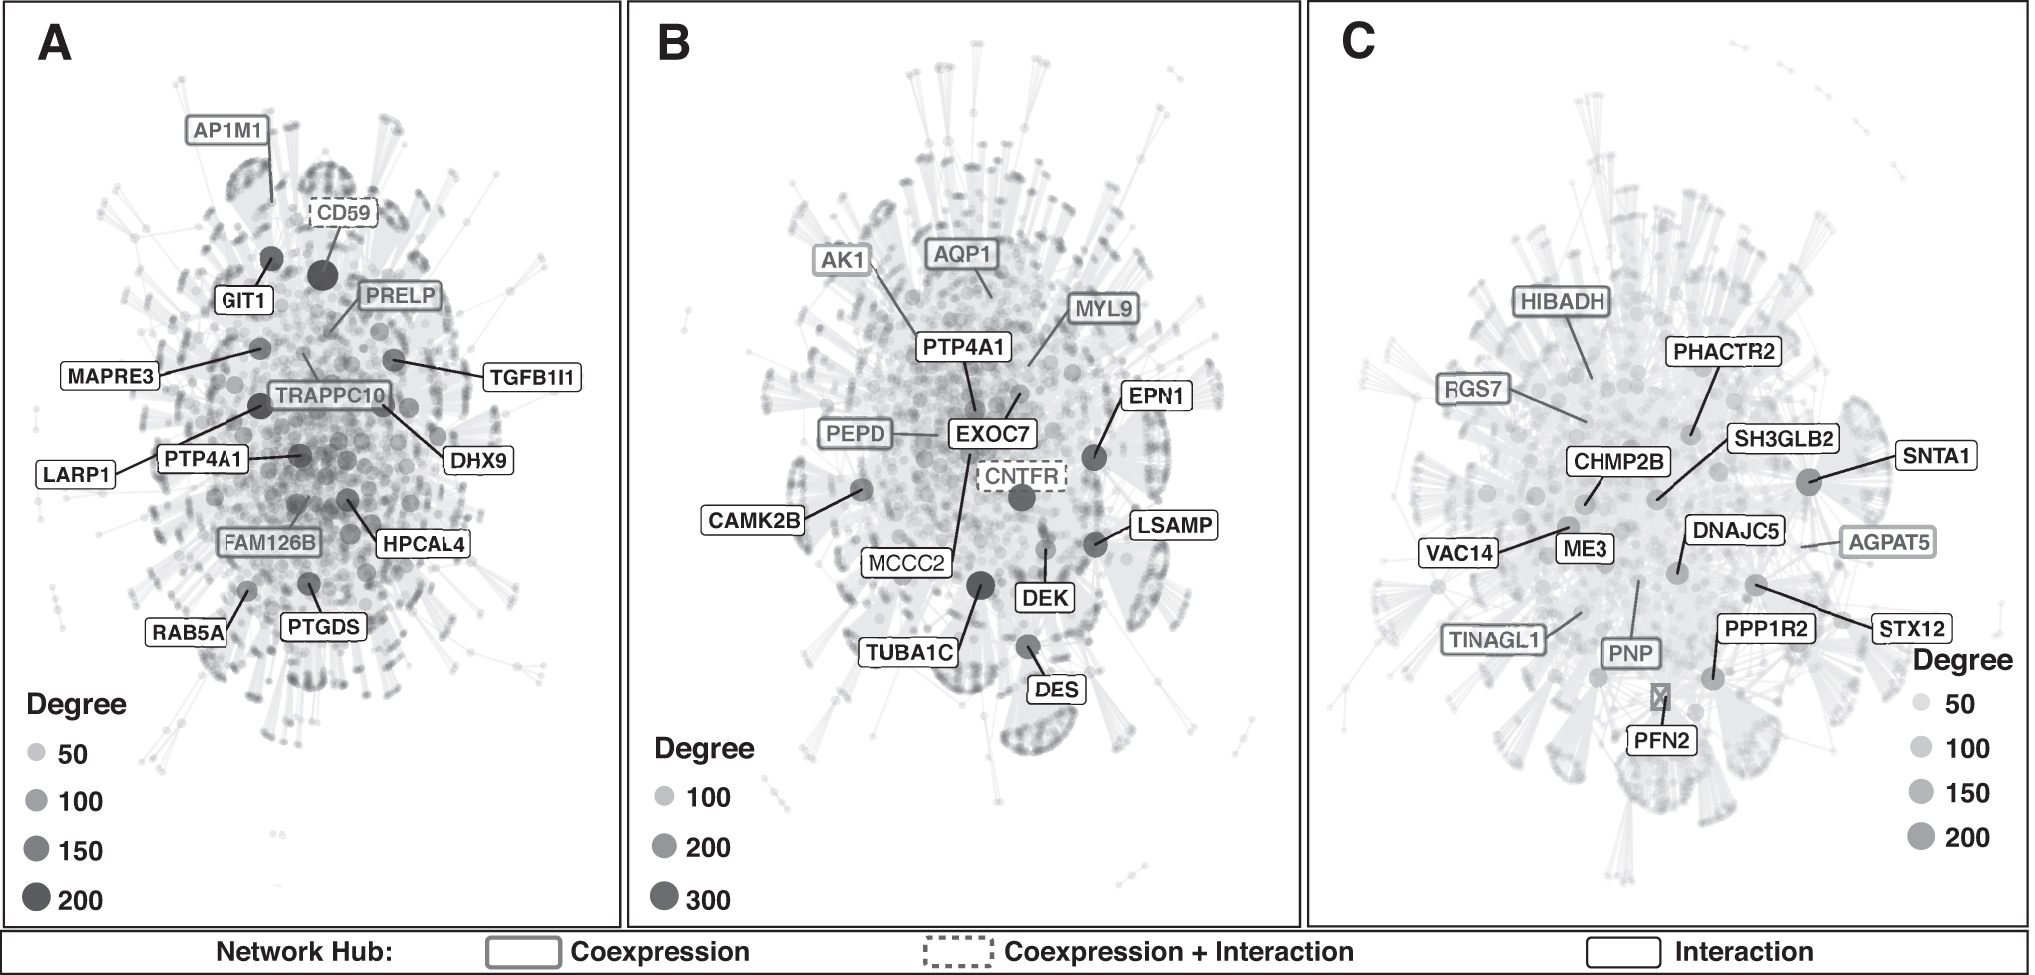
Integration of the obtained results with interactome data from protein–protein interaction identified critical regulators of the resulted modules. Protein network for the highly connected proteins forming a network hub was obtained for (a) proteins with PTMs which are coexpressed and are present in the module, (b) proteins with PTMs forming interactions with the list of inserted proteins as input, and (c) proteins with PTMs which are present in both (a) and (b). The formed network hub for each obtained module and the hub forming proteins in the network with their differential expression pattern and region-specific category are depicted in Figure 3 and Table 4.
CEMiTool analysis for modified proteins for all regions.
List of Proteins Forming Network Hubs with Their Associated Brain Regions Followed by Classification, Differential Expression Pattern, and Modification
0, Regions with no tangles; +, regions with intermediate tangles; ++, regions with severe tangles.
A, amygdala; Ac, acetylation; DR, downregulated; NC, unchanged expression; OE, overexpressed.
Forty-two proteins with PTMs were identified as critical regulators, among which two proteins CD59 glycoprotein and ciliary neurotrophic factor receptor subunit alpha (CNTFR) show coexpression and interaction with a module and inserted protein list. Previous reports on CD59 and CNTFR have suggested the downregulation of these proteins to be associated with Alzheimer's progression. Approaches such as the upregulation of CD59 or external delivery of CNTFR for maintaining neuronal health are proposed in a mouse model with positive results in prolonging neurodegeneration (Garcia et al., 2010; Kolev et al., 2010; Rockenstein et al., 2011; Yang et al., 2000).
Proteins with PTMs exhibit altered expression
To understand proteome level changes associated with the progression of NFTs in AD brain regions, we computed FC ratios between “no tangles” and “regions of tangles,” and significance was calculated using ANOVA. Our analysis identified a greater number of proteins with PTMs to be downregulated (intermediate tangles: 324, severe tangles: 453) than overexpressed (intermediate tangles: 273, severe tangles: 184) among regions with tangles (Fig. 2D and Supplementary Data S1, Fig. 2, and Supplementary Table S2).
The significantly altered proteins resulted in 80 proteins, which were common across three NFTs. We found TLC domain-containing protein 1 (TLDC1) to be most significantly altered (p = 1.77244e−33, PTM: methylation) in severe tangle regions compared to “no-tangle” regions. TLDc families of proteins have been reported as potential therapeutic agents for neurodegenerative diseases as they possess an antioxidant role in neurons (Finelli and Oliver, 2017).
Similarly, coiled-coil domain containing 136 (CCDC136; p = 0.00264, modification: phosphorylation, hydroxylation) and selenium binding protein 1 (SELENBP1; p = 0.00282, PTM: citrullination, hydroxylation, and phosphorylation) were also differentially regulated in severe tangle regions compared to others. SELENBP1 belongs to a class of proteins that perform redox signaling in the brain. Studies using proteomics and transcriptomics approach show its association with various neurological complications with amyloid plaques and early-onset AD (Iridoy et al., 2018), Lewy bodies in Parkinson's disease (Sasuclark et al., 2019), and schizophrenia with copy number variation (Kanazawa et al., 2008) leading to dementia.
Biological significance of differentially expressed proteins with PTMs
To study the functions of these differentially regulated proteins with PTMs STRING network analysis was performed. Proteins overexpressed from intermediate and severe tangle regions were enriched for biological processes involved in “small molecule metabolic process” and “metabolic pathways” (Supplementary Table S4). Studies in recent past have suggested organic impairment of mitochondrion and damage to metabolic pathways associated with mitochondrial function, along with change in oxygen and glucose metabolic rates leading to altered TCA and glycolytic pathway that are causative factors for AD progression [30026371 (MacDonald et al., 2018); 15852400 (Bubber et al., 2005); 33250703 (Yan et al., 2020)]. This is in concurrence to the functional analysis of modified proteins from this study.
Furthermore, pathway enrichment analysis listed six KEGG pathways enriched for proteins with severe tangle regions, among which seven proteins with PTMs (ARHGEF12, COL3A1, FGG, GNAQ, GUCY1B3, ITGB1, MAPK1) were enriched for platelet activation pathway (Table 3 and Supplementary Table S2). Literature from the past two decades suggests the role of activated platelets associated with AD progression and the reliability of potential AD biomarkers from platelets (Ciabattoni et al., 2007; Donner et al., 2016; Jelic et al., 2013; Talib et al., 2012).
Moreover, platelets are also a storage source for small molecules and undergo changes in size following the release of molecules from their storage granules (George, 2000). Platelets are reported to share biochemical similarities with neurons and reflect abnormalities with neuronal disorders (Behari and Shrivastava, 2013; Catricala et al., 2012). Therefore, we hypothesize that these differentially expressed proteins with PTMs may serve as a potential source of plasma-based biomarkers for AD diagnosis and, hence, need further experimental exploration.
Conclusions
In this study, we report a list of PTMs significantly enriched in AD from nine affected regions from brains of AD patients. Although the use of a single data source for the identification of select multi-PTMs is a limitation of this study, it is a major attempt toward the generation of an important dataset for the biomedical community to formulate new hypotheses.
Currently, it is cumbersome to apply such strategies to all published proteomic studies from AD or any other disease due to lack of sophisticated computational infrastructure and time slot in commercial software. However, a series of such efforts can be made to accumulate the data until a time when dedicated efforts or advanced computational platforms will be developed to address this important area of analysis. The study also provides a region-wise classification for the proteins with PTMs along with their differential expression pattern, providing insights into the localization of these proteins upon modification. The catalog of multi-PTMs identified in the context of AD from different brain regions provides a unique platform for setting newer hypotheses in understanding the putative role of specific PTMs in AD pathogenesis.
Footnotes
Acknowledgments
The authors thank the Karnataka Biotechnology and Information Technology Services (KBITS), Government of Karnataka for support to the Center for Systems Biology and Molecular Medicine (CSBMM) at Yenepoya (Deemed to be University), Mangalore under the Biotechnology Skill Enhancement Programme in Multi-omics Technology (BiSEP GO ITD 02 MDA 2017). Dr. A.H.P. has been a BiSEP faculty appointed in this program. S.C.D. and D.A.B.R. are recipients of Senior Research Fellowships from the Indian Council of Medical Research (ICMR), Government of India. The authors also thank Yenepoya for providing research fellowships to S.C.D. and D.A.B.R. before they received ICMR Senior Research fellowships.
Author Disclosure Statement
The authors declare they have no conflicting financial interests.
Funding Information
This study received no funding.
Abbreviations Used
References
Supplementary Material
Please find the following supplemental material available below.
For Open Access articles published under a Creative Commons License, all supplemental material carries the same license as the article it is associated with.
For non-Open Access articles published, all supplemental material carries a non-exclusive license, and permission requests for re-use of supplemental material or any part of supplemental material shall be sent directly to the copyright owner as specified in the copyright notice associated with the article.