




Abstract
Multiple sclerosis (MS) is a demyelinating disorder that affects multiple regions of the central nervous system such as the brain, spinal cord, and optic nerves. Susceptibility to MS, as well as disease progression rates, displays marked patient-to-patient variability. To date, biomarkers that forecast differences in clinical phenotypes and outcomes have been limited. In this context, cell-type-specific interactome analyses offer important prospects and hope for novel diagnostics and therapeutics. We report here an original study using bioinformatic analysis of MS data sets that revealed interaction profiles as well as specific hub proteins in white matter (WM) and gray matter (GM) that appear critical for disease mechanisms. First, cell-type-specific interactome analyses suggested that while interactions within the WM were focused on oligodendrocytes, interactions within the GM were mostly neuron centric. Second, hub proteins such as APP, EGLN3, PTEN, and LRRK2 were identified to be differentially regulated in MS data sets. Lastly, a comparison of the brain and peripheral blood samples identified biomarker candidates such as NRGN, CRTC1, CDC42, and IFITM3 to be differentially expressed in different types of MS. These findings offer a unique cell-type-specific cell-to-cell interaction network in MS and identify potential biomarkers by comparative analysis of the brain and the blood transcriptomics. From a study design and methodology perspective, we suggest that the cell-type-specific interactome analysis is an important systems science frontier that might offer new insights on other neurodegenerative and brain disorders as well.
Introduction
Integration of transcriptomic data with protein–protein interaction (PPI) networks in disease conditions is an emerging area to understand the underlying molecular mechanism of neurodegenerative diseases as a systems biology approach. The main rationale of interactome analysis using high-throughput sequencing data is the ability to infer unique interaction partners from expression fold changes, and to integrate these with PPI networks from proteomic data or PPI databases by analyzing network properties and the degree of each node within the networks.
In addition to interactions within cells, cell-to-cell interaction and communication are also important in the developing and adult nervous systems: a brain interactome study recently identified more than 1700 unique ligand–receptor interactions between various cells in the embryonic brain (Sheikh et al., 2019). Cell-to-cell communication among the cells of the central nervous system (CNS) occurs either through secreted proteins or extracellular vesicles (EVs), or through direct contact between membranes both in health and disease (Paolicelli et al., 2019; Budnik et al., 2016). Microglia interact with neurons during synaptic pruning events (Posfai et al., 2019). Astrocytes and oligodendrocytes affect each other during brain development (Nutma et al., 2020). Oligodendrocytes interact with not only neurons and astrocytes, but also with endothelial cells, microglia, and pericytes (Ohtomo and Arai, 2020).
To date, many studies focused on the nature and mechanism of specific interactions. Recently, neuron–astrocyte interactions were mapped in amyotrophic lateral sclerosis (Mishra et al., 2020). In this study, we specifically explored cell-to-cell interactomes during multiple sclerosis (MS) to identify disease-specific PPIs.
MS is a T cell-mediated autoimmune demyelinating disorder of the CNS (Huseby et al., 2015). T cells, macrophages, and microglia are involved in neuroinflammation, which leads to oligodendrocyte and neuronal death. A thorough understanding of cell-to-cell interactions of these cells in healthy and disease states can help elucidate disease mechanism. In addition, hub proteins, that is, proteins central within the disease state interactions, can be targeted by drugs, and may be exploited as potential biomarkers.
In this study, we generated cell-to-cell interactomes between pairs of neurons, oligodendrocytes, microglia, macrophages, and Th1 cells and used these interactomes to identify possible biomarkers and drug candidates for MS. Secreted and membrane proteins for each cell type were determined and a PPI network was generated. This cell-type-specific interactome analysis suggested that interactions in white matter (WM) were mainly oligodendrocyte centric, with significant interactions occurring between oligodendrocytes and neurons, as well as oligodendrocytes and macrophages or Th1 cells.
On the contrary, interactions within the gray matter (GM) were observed to be mainly neuron centric, with significant interactions occurring to a similar extent between neurons and microglia, oligodendrocytes, and Th1 cells.
We hypothesized that the PPI network hub proteins and related pathways whose expression changed significantly in MS were essential proteins for the disease progression and represent biomarkers and drug targets. We have found that genes involved in processes such as synaptic transmission were upregulated in MS WM data sets, while those involved in glial function were downregulated. In the MS GM data sets, however, most of the upregulated genes were concentrated in immune-related processes, while downregulated genes were mostly related to neuronal function. We identified hub proteins such as the amyloid precursor protein (APP) to be upregulated in WM, but downregulated in GM, data sets, while EGLN3 was downregulated in WM but upregulated in GM. Interestingly, we identified PTEN and LRRK2 to be upregulated in MS WM data sets.
Furthermore, we integrated PPI and transcriptomic data from peripheral blood samples from various MS types (Acquaviva et al., 2020), to identify potential drug candidates and MS-specific biomarkers. This analysis indicated that clinically isolated syndrome (CIS) and secondary progressive MS (SPMS) genes such as NRGN and CRTC1 were upregulated in both peripheral blood samples and brain samples. Likewise, relapsing remitting MS (RRMS) and primary progressive MS (PPMS) contained a common potential biomarker, CDC42.
Analysis has also suggested that potential type-specific biomarkers were upregulated in both brain samples and peripheral blood; for example, IFITM3 was found to be upregulated in CIS; SHMT1, BBS10, and RDH5 were upregulated in RRMS; NR3C2 and PDE4D were upregulated in PPMS; and lastly, CPNE5 and RTN2 were upregulated in SPMS, which could be further investigated as potential stage-specific biomarkers. Thus, we present a comprehensive strategy to generate and analyze cell-to-cell interactomes to identify disease-associated pathways and novel biomarkers.
Materials and Methods
Microarray data sets and transcriptomic analysis
We obtained microarray transcriptomic data sets from the NCBI Gene Expression Omnibus (GEO) database and selected the data sets for MS brain and blood tissue for this study (Barrett et al., 2013; Edgar et al., 2002). In the corresponding study, MS and control brain lesion tissue samples for WM had been obtained from autopsy patients (GEO accession GSE38010) (Han et al., 2012). We obtained the data sets for MS GM brain tissues as well as control samples from the BrainNet Europe gene expression microarray study (GSE accession GSE26927) (Durrenberger et al., 2012, 2015). MS and control peripheral blood mononuclear cell (PBMC) microarray data were obtained from GSE accession GSE136411 (Acquaviva et al., 2020). Detailed information about data sets including sample size is summarized in Supplementary Table S1. The bioinformatic workflow for the analysis of these data sets is shown in Figure 1.
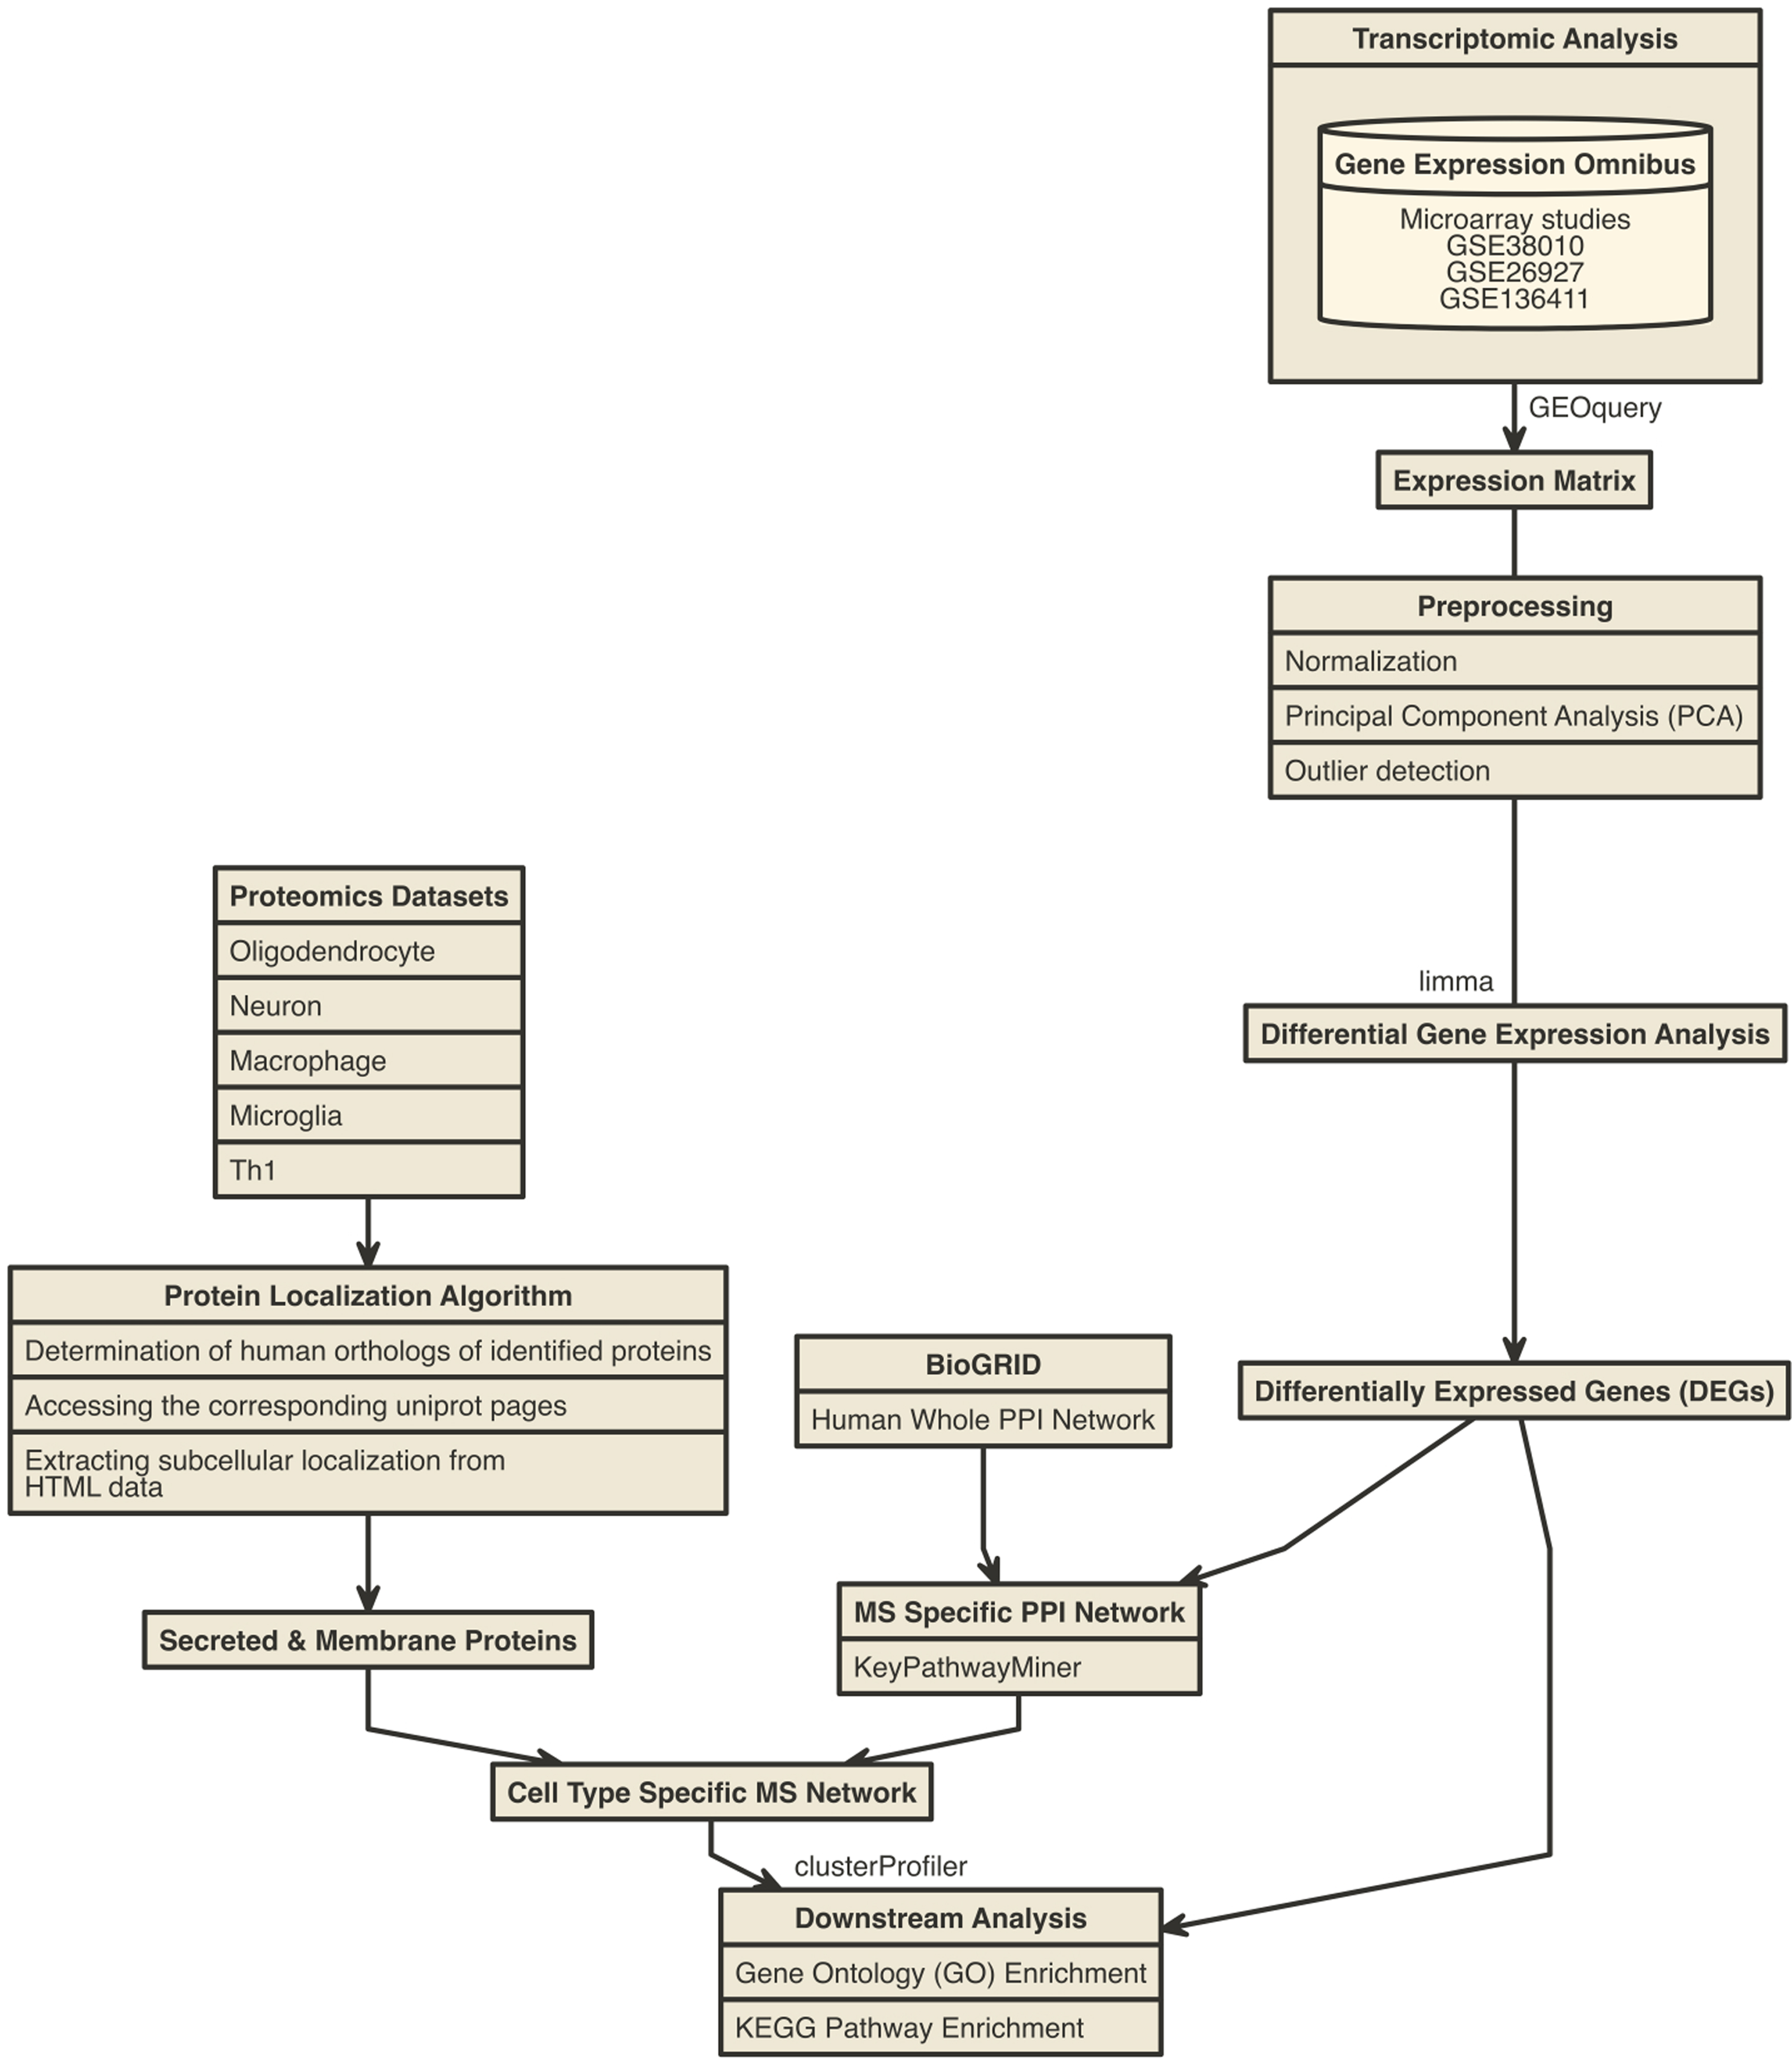
Bioinformatic methodology of transcriptomic analysis and protein–protein inference algorithm. Further details of the figure legends are available from the Materials and Methods section.
Raw or non-normalized expression matrix, which contains gene probes in rows and samples in columns, from selected microarray studies, was analyzed using Bioconductor package GEOquery (Davis and Meltzer, 2007). Briefly, data sets were normalized with quantile normalization and log2 transformation. To determine the quality of MS and control group data and to detect outlier samples, the principal component analysis (PCA) was performed with Bioconductor package pcaMethods (Stacklies et al., 2007). Differential gene expression analysis was performed using the limma package based on linear model test statistics (Ritchie et al., 2015). Differentially expressed genes (DEGs) were determined with Benjamini–Hochberg-adjusted p-value <0.05. Then these DEGs were used to construct MS-specific PPI network and downstream analysis.
We integrated the DEGs of different MS types (CIS, RRMS, PPMS, and SPMS) from the PBMC microarray data set (Acquaviva et al., 2020) with MS WM- and GM-specific PPI network as up- and downregulated genes. We visualized the comparisons as a Venn diagram and selected potential biomarkers with 1.5-fold change (absolute log2-fold change >0.6) and visualized as a Bar plot.
Construction of MS-specific PPI network
For the integration of transcriptomic data with the PPI network so as to construct an MS-specific brain interaction network, we performed de novo pathway enrichment analysis using KeyPathwayMiner (List et al., 2016). We initially obtained the human whole PPI network from the BioGRID database (Release 4.3.195) (Oughtred et al., 2021) and integrated it with DEGs using INES strategy and GREEDY algorithm with node exception three parameter contained in KeyPathwayMiner. We visualized constructed MS-specific subnetworks from human PPI and analyzed them using Cytoscape software (Shannon et al., 2003). We determined hub interaction proteins using the degree of nodes from network analysis.
Proteomic data sets and cell-type-specific interaction network
The proteome data sets of neurons, oligodendrocytes, Th1 cells, microglia, and monocyte-derived macrophages are listed in Supplementary Table S2.
We determined the Homo sapiens orthologs of the mouse-based genes using the PANTHER Gene List Analysis database (www.pantherdb.org); thereafter, we eliminated the duplicated proteins, and assembled the final list.
We determined subcellular localization of the proteins from the Universal Protein Resource (UniProt, www.uniprot.org) by a high-throughput web scraping algorithm (Yurduseven, 2022). Briefly, the algorithm accepts the UniProt IDs of proteins as input, then accesses the UniProt website, obtains the HTML files, and searches for the keywords specified in Supplementary Table S3 in the resulting HTML data. Using this web scraping approach, subcellular localization of the corresponding proteins was obtained for further analysis (Supplementary Data S1). The distribution of obtained membrane and secreted proteins is listed in Supplementary Table S4.
We constructed cell-type-specific MS PPI networks by integration of secreted and membrane proteins for different cell types with MS-specific PPI subnetwork. In this approach, we filtered MS-specific subnetworks with both individual cell-type proteomes and their protein subcellular localizations. Then we visualized networks in Cytoscape.
Functional enrichment analysis
We performed Gene Ontology (GO) and Kyoto Encyclopedia of Genes and Genomes (KEGG) pathway functional enrichment analysis with DEGs from WM and GM brain tissue data sets and also cell-type-specific MS PPI network proteins by using Bioconductor package clusterProfiler (Yu et al., 2012). We determined enriched GO and KEGG terms with Benjamini–Hochberg-adjusted p-value <0.05 and selected study-related term filtration.
Results
DEGs of WM and GM in MS
We initially investigated expression changes between control versus MS WM and GM using data sets given in Materials and Methods section and analyzed DEGs. According to the differential gene expression analysis, 299 upregulated and 332 downregulated genes were observed in the MS GM data set. In the MS WM data set, 2247 upregulated and 1795 downregulated genes were obtained (Supplementary Fig. S1). All DEGs are listed in Supplementary Data S2.
We then performed GO enrichment analysis of DEGs in both WM and GM (Supplementary Fig. S2). The upregulated genes in the MS WM data set in this study were mostly enriched in synaptic transmission-related processes, such as modulation of chemical synaptic transmission, synaptic vesicle cycle, neurotransmitter secretion, or synapse assembly, whereas genes downregulated in MS in WM compared with control were mostly enriched in processes such as gliogenesis, glial cell differentiation, cell chemotaxis, and cell migration and locomotion.
MS-specific PPI network
We generated an MS-specific PPI network from the transcriptomic data set using the KeyPathwayMiner algorithm for both WM and GM (Fig. 2). It is interesting to note that some hub proteins were altered in both WM and GM, while others were unique to either group in MS data sets. For example, the RNA binding protein ELAVL1 was downregulated in both WM and MS GM data sets (Fig. 2A, B). On the contrary, APP was upregulated—although slightly—in WM data sets (Fig. 2A), but downregulated in the GM data set (Fig. 2B). In contrast, EGLN3 is a hub protein that is downregulated in the MS WM data set (Fig. 2A), but upregulated in the MS GM data set (Fig. 2B). All PPI networks are listed in Supplementary Data S3. We manually identified the function and disease association of these major hub proteins (Supplementary Table S5). In validation to our approach, a major hub protein anillin (ANLN) is essential for myelin formation (Erwig et al., 2019) (Fig. 2A).

MS-specific PPI networks inferred from transcriptome data sets of
Among the major hub proteins in MS WM data sets, PTEN, ECT2 LRRK2, and KRAS are upregulated, while CDH1, PHB, ANLN, and HSPD1 are downregulated (Fig. 2A). On the contrary, hub proteins that are upregulated in MS GM data sets include ATXN3, BAG3, and CDK2, and those that are downregulated include HSPA8, HSP90AA1, and SNCA (Fig. 2B). ANLN plays a fundamental role in myelination (Erwig et al., 2019), and hence, its downregulation in MS WM data sets validates the experimental strategy of this study. Other proteins identified in this study were previously reported to have a role in other neurodegenerative disorders (Supplementary Table S5). It will be interesting to further analyze whether these proteins identified can be used as potential biomarkers for MS.
Cell-type-specific PPI networks and neuroglial interactions
The proteome data were compiled from various studies (Supplementary Table S2). Secreted or membrane proteins were identified using a custom Python algorithm. These secreted or membrane proteins were integrated with the PPI network to elucidate cell-to-cell interactions, cell-type-specific interactomes, within WM or GM in MS (Fig. 3). It is not surprising that in MS WM data sets, interactions were centered on oligodendrocytes (Fig. 3A), while in MS GM, interactomes were neuron centric (Fig. 3B). In both MS WM and GM interactomes, the neuronal APP was a significant hub protein in MS-specific interactions as determined by the node size.

Cell-type-specific PPI networks with membrane and secreted proteins in MS brain tissue. Cell-type-specific proteomes were filtered and clustered as membrane and secreted proteins, thereafter integrated with the PPI network of
In the MS WM cell-to-cell interactome, PTEN and APP were among the neuronal hub proteins, and both PTEN and APP were upregulated in MS WM data sets (Fig. 2). In the oligodendrocyte network, LIMA1, ARRB1, CDC42, PSEN1, and RHOA were among the significant hub proteins that were differentially regulated in MS samples, and that engaged in the largest number of interactions with neurons, microglia, macrophages, and Th1 cells. Interestingly, LIMA1, PTEN, ARRB1, PHB, PSEN1, RHOA, and CDC42 also appeared on microglia and Th1 interactomes (Fig. 3A).
When the MS GM cell-to-cell interactome was analyzed, the key hub proteins involved in cell-type-specific interactions were different from those in WM (Fig. 3B). As mentioned above, the interactions were neuron centric with major interactions concentrating on proteins, APP, PKN1, KIT, and LYN. In the oligodendrocyte network, HSP90AA1, VIM, and HSPA8 were prominent, and interestingly these proteins also appeared to be key hub proteins in microglia, macrophages, and Th1 cells (Fig. 3B; Bonam et al., 2019). All cell-type-specific networks are listed in Supplementary Data S4.
When cell-type-specific GO enrichment analysis was performed for MS WM data set, PPIs were found to involve upregulated genes enriched in immune response, neurotransmitter transport, apoptosis, and synaptic signaling processes in oligodendrocytes, microglia, neurons, and Th1 cells, but macrophage-specific biological processes were found to be more narrow, with downregulated genes enriched in neutrophil, myeloid, and humoral immune response processes, modulation of chemical synaptic transmission, and regulation of trans-synaptic signaling. Upregulated genes were enriched in regulation of synaptic plasticity (Fig. 4A).

GO enrichment analysis of cell-type-specific network proteins of
When a similar analysis was performed for MS GM data set, each cell-type-specific process enrichment was found to be different (Fig. 4B). In oligodendrocytes, some genes enriched in immune response-related processes were upregulated, while others were downregulated; in microglia, all immune-related processes were highly enriched, and in neurons and Th1 cells, a similar subset of immune response-related processes were enriched (Fig. 4B). Macrophages had a distinct enrichment profile, with downregulated genes mostly enriched in processes such as cell surface receptor signaling pathway involved in phagocytosis, axonogenesis, and neuron development (Fig. 4B).
Then, we performed KEGG pathway analysis (Supplementary Fig. S3A). A higher number of pathways were enriched in the WM MS data sets than the GM MS data sets. Notably, “pathways of neurodegeneration pathway” was among the enriched pathways in WM MS, and “antigen processing and presentation pathway” was among the enriched pathways in GM MS.
Comparison of peripheral transcriptome profiles of different types of MS with MS-specific PPI networks
To elucidate whether cell-type-specific interactome analysis can reveal potential blood biomarkers, we compared genes identified in WM and GM PPI networks with peripheral blood transcriptomic profiles of MS types and compared the significantly altered DEGs with PPI network of WM and GM (Fig. 5; Supplementary Fig. S4). CIS refers to an early disease stage with neurological symptoms caused by demyelination that may or may not develop into MS (Brochet and Ruet, 2019; Hou et al., 2018). RRMS, the most common type, is characterized by MS attacks (or “relapses”) followed by recovery periods (or “remissions”). In PPMS, neurological functions worsen without relapses or remissions. In contrast, an initial relapsing remitting period is followed by steady worsening of the disease in SPMS. One hundred thirty-five genes overlapped between CIS blood and MS WM data sets (Fig. 5A).
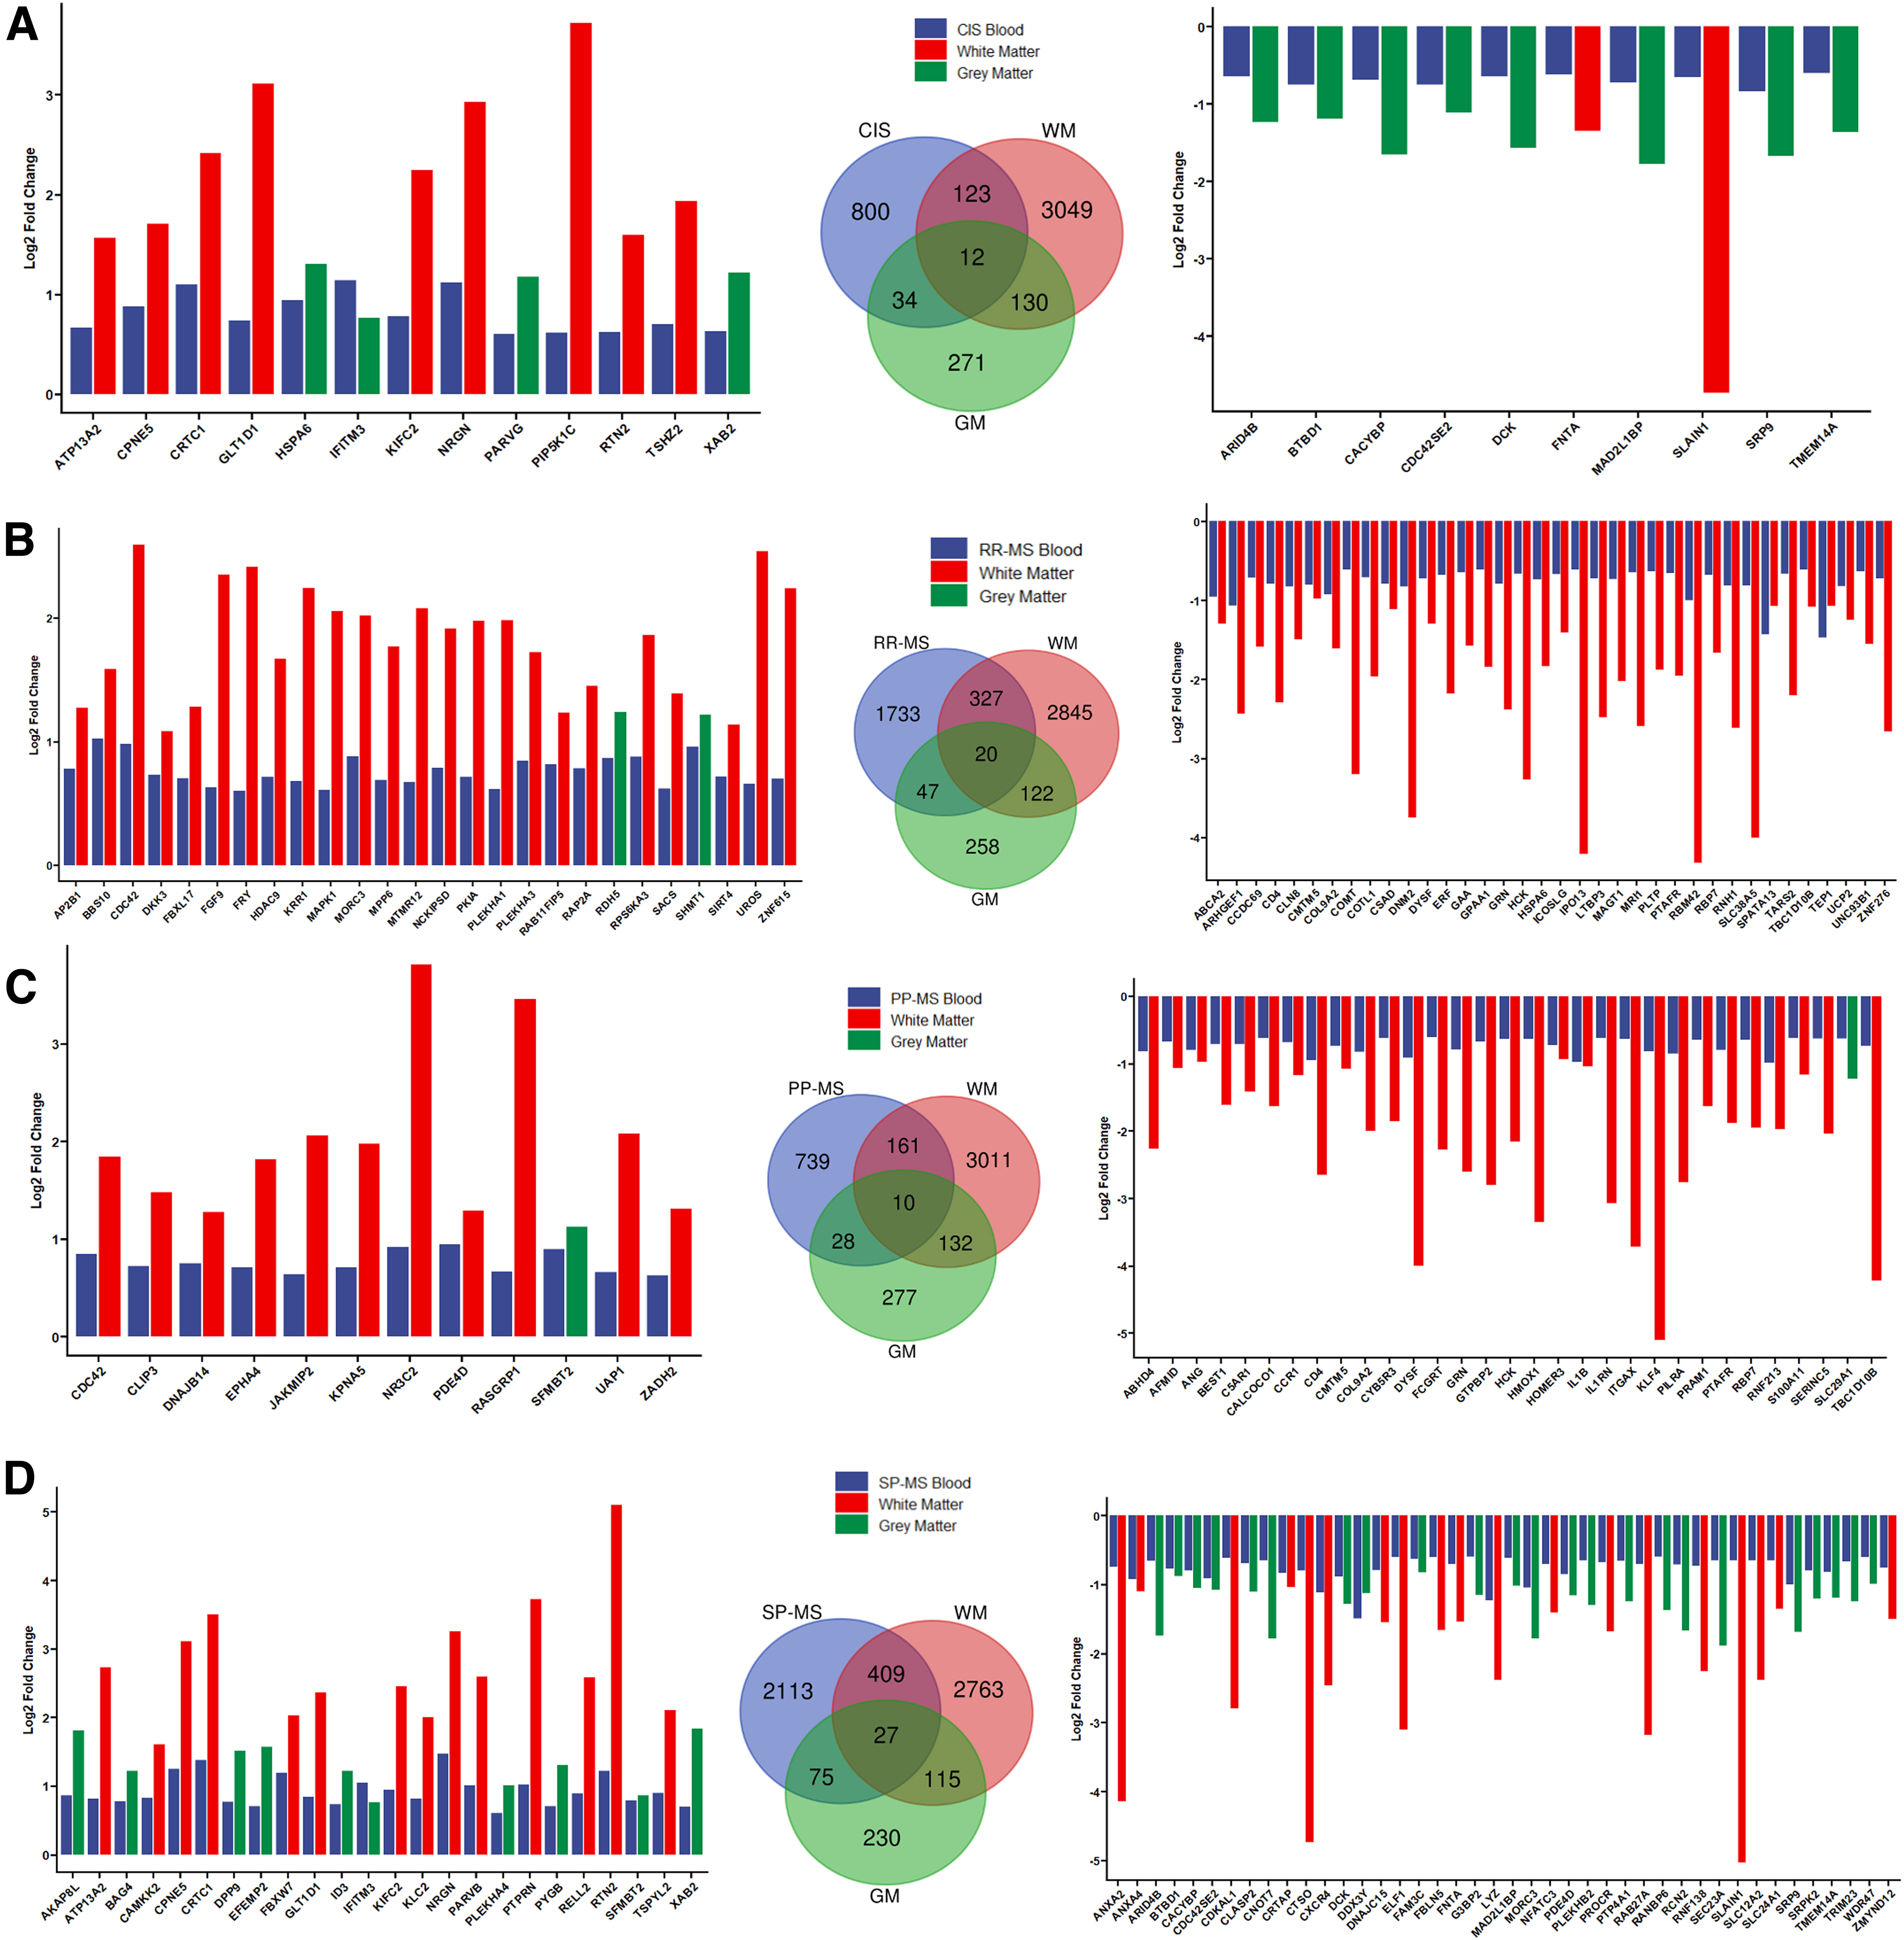
Transcriptomic profiling of PMBCs from patients from different MS types and healthy control:
It is interesting to note that SLAIN1 appears to be among the highly downregulated genes in both CIS and SPMS peripheral blood samples and MS WM data sets; similarly, CRTC1, ATP13A2, and NRGN are among the highly upregulated genes in both CIS and SPMS peripheral blood samples and MS WM data sets (Fig. 5).
CD4 is highly downregulated, while CDC42 is highly upregulated in both RRMS and PPMS samples as well as MS WM data sets. Kinesin motor protein KIFC2 is highly upregulated, and FNTA is highly downregulated in CIS and WM samples (Fig. 5).
HDAC9, FGF9, and MAPK1 were upregulated, while ERF, COMT, HCK, and ZNF276 were highly downregulated in both RRMS and MS WM samples (Fig. 5).
EPHA4 is highly upregulated, and GRN and HCK were highly downregulated in PPMS and WM samples; and lastly, PARVB and RTN2 were highly upregulated, while ANXA2, CTSO, and ELF1 were highly downregulated in SPMS and MS WM samples (Fig. 5).
Very few genes were filtered with the log2FC cutoff for MS GM data set comparisons with all peripheral blood samples (Fig. 5, green bars), but among them IFITM3 was among the highly upregulated genes, while ARID4B, a chromatin protein, was among the highly downregulated genes in both CIS and MS GM data (Fig. 5A, D). No highly downregulated overlapping genes were filtered with this log2FC cutoff for RRMS blood and MS GM data, while only SLC29A1 was found to be highly downregulated in both RRMS and MS GM data (Fig. 5B, C).
Discussion
Neuroglial interactions have long been studied in cell migration, axon sorting, and axon pruning, among many other processes during nervous system development and in homeostasis using model organisms (Edenfeld et al., 2005). Understanding cell-to-cell interactions during demyelination and remyelination is not only important in diseases such as MS, but also in cases of stroke, where for effective remyelination the oligodendrocyte precursor cells (OPCs) as well as mature oligodendrocytes respond to signals secreted from reactive astrocytes, microglia, and macrophages, and further cross talk with vascular endothelial cells and neurons (Itoh et al., 2015). Astrocytes and microglia have been studied in terms of neuroglial interactions in a number of neurological diseases including MS (Meyer and Kaspar, 2017), and secreted factors from astrocytes have further been shown to contribute to B cell survival in MS (Touil et al., 2018).
In an EAE model of MS, astrocyte-specific transcriptomes from various brain regions were the previously identified genes in the cholesterol synthesis pathway to be decreased, while immune pathway gene expression to be increased (Itoh et al., 2018).
In this study, we aimed to construct an MS-specific PPI network between different cell types, based on retrieval of secreted and membrane proteins from the UniProt database. We focused on interactions among neurons, oligodendrocytes, microglia, macrophages, and Th1 because these cells are the major cell types involved in MS. Besides WM, we analyzed cell-specific interactomes in GM, because nearly 30% of MS lesions are in fact located in the cortical GM or WM/GM border, and GM shows extensive lymphocytic infiltration, microglia, and macrophage abundance (Mallucci et al., 2015).
Moreover, understanding cell-to-cell interactions during demyelination and remyelination is not only important in diseases such as MS, but also for stroke, where OPCs as well as mature oligodendrocytes respond to signals secreted from reactive astrocytes, microglia, and macrophages, and further cross talk with vascular endothelial cells and neurons (Itoh et al., 2015).
It should be noted that the UniProt database does not distinguish between plasma membrane and internal membranes: hence, our localization algorithm cannot exclusively identify transmembrane proteins and proteins on the extracellular surface of the plasma membrane. It is possible that some internal proteins were included in the interactomes. Yet, these proteins may still be important interacting proteins because apoptotic cells may expose certain internal membrane segments on their plasma membranes and secrete exocytic vesicles (Franz et al., 2007), and oligodendrocytes communicate with other cells via EVs and exosomes (Meyer and Kaspar, 2017; Reiter and Bongarzone, 2020). In the future, our present cell-specific interactomes can be improved with experimental validation of each PPI.
Both cell-specific interactomes of WM and GM, and comparisons with peripheral blood samples identified genes that were previously shown to be associated with MS, confirming the predictive power of our approach (Fig. 5). Among the differentially regulated genes in both interactome and peripheral blood samples from different MS types, highly upregulated genes FGF9, EPHA4, and RTN2 in WM, and IFITM3 in GM were previously identified as MS-associated genes or potential biomarkers of MS (Hur et al., 2020; Lindner et al., 2015; Manuel et al., 2021; Montenegro et al., 2012; Munro et al., 2013; Yan et al., 2006). CD4, which was identified to be downregulated in RRMS, PPMS, and WM in our study, is associated with MS-activated T cells (Jelcic et al., 2018).
Although FNTA is expressed significantly higher in male MS patients in a previous study (Miller et al., 2012; Taheri et al., 2018), it was downregulated in CIS samples and MS WM (Fig. 5). GRN is highly expressed in cerebrospinal fluid (CSF) of RRMS patients (Vercellino et al., 2011), and identified to be downregulated in PPMS and MS WM samples (Fig. 5). Similarly, ANXA2 was highly downregulated in SPMS and WM MS data sets and was previously identified as a potential biomarker for MS (Iparraguirre et al., 2017) (Fig. 5). Moreover, many of the novel MS-associated genes that were identified in this study are implicated in other neurological or neurodegenerative diseases, such as NRGN in schizophrenia (Cevik et al., 2019; Ohi et al., 2012; Sun et al., 2021), ATP13A2 in Parkinson's disease (Park et al., 2015; Tsunemi et al., 2014; van Ween et al., 2020), and COMT in ADHD (Hong et al., 2015).
In the MS-specific PPI network, novel hub proteins have also found to be associated with other neurological or neurodegenerative diseases: RNA-binding protein ELAVL1, which was downregulated in both WM and MS GM (Fig. 2), and APP, which was upregulated in WM but downregulated in MS GM, were also identified as critical hub proteins in Crohn's disease (Li et al., 2020). HSP90AA1 and HSPA5 were previously shown to play a role in brain ischemia (Ma et al., 2020). A major MS WM hub protein LRRK2 is a known Parkinson-related gene that is also implicated in autoimmune disorders (Witoelar et al., 2017). The upregulated hub protein BAG3 is important in the clearance of Parkinson causative agent, SNCA (Cao et al., 2017). Intriguingly, a downregulated hub protein ANLN is a known regulator of myelination and was identified as an MS-associated protein in this study (Erwig et al., 2019).
There are many different bioinformatic studies that aim to identify MS-specific novel biomarkers and hub proteins. One study integrates transcriptome profiles of blood as well as brain tissues of MS patients and identifies a number of DEGs as well as miRNAs (Islam et al., 2019); however, neither WM/GM-specific data nor MS-type information was integrated. Other studies focused on transcriptome analysis in either brain tissues or peripheral blood samples in treated versus untreated MS patients (Cervantes-Gracia and Husi, 2018; Cordiglieri et al., 2016). To our knowledge, these studies did not focus on cell-type-specific interactions.
In this study, our strategy of identifying secreted and membrane proteins to generate MS-specific cell-to-cell interaction networks identified novel hub proteins important in MS in both WM and GM. We further compared transcriptomic changes between brain and peripheral blood samples from various MS types and identified type-specific combinations of candidate biomarkers. Some of the candidates identified in this study, such as ANXA2 or IFITM3, have previously been shown or implicated in MS or other autoimmune diseases. We believe that the genes identified in this study represent potential novel biomarkers for MS, although more detailed single-cell RNAseq data from WM and GM representing different stages of MS can strengthen the conclusions and better represent the disease progression. We propose that the approach presented in this study can further be improved and expanded to other neurological diseases.
Footnotes
Authors' Contributions
Y.K.B. and K.Y. obtained the data sets, carried out bioinformatic analysis, and generated figures for MS WM and GM analysis, interactome analysis, and peripheral blood analysis. E.C. generated the original cell-type-specific protein data sets and contributed to the cell-to-cell interactome analysis. B.E.K. and I.A.K. contributed to the design of the analysis and oversight of the study. All authors made a significant intellectual contribution to the article drafting and/or revisions.
Acknowledgments
The authors would like to acknowledge members of the Kerman Lab and AxanLab for their valuable discussions. They thank Emre Karakoc, Meltem Eda Omur, and Zeynep Aladag for insightful discussions. They also thank SABITA for technical and equipment support.
Author Disclosure Statement
The authors declare they have no conflicting financial interests.
Funding Information
E.C. and B.E.K. were supported by an Istanbul Medipol University Internal Research Grant (2018/06). B.E.K. was also supported by the Turkish Academy of Sciences-GEBIP.

Abbreviations Used
References
Supplementary Material
Please find the following supplemental material available below.
For Open Access articles published under a Creative Commons License, all supplemental material carries the same license as the article it is associated with.
For non-Open Access articles published, all supplemental material carries a non-exclusive license, and permission requests for re-use of supplemental material or any part of supplemental material shall be sent directly to the copyright owner as specified in the copyright notice associated with the article.
