




Abstract
Bacterial genomes are chimeras of DNA of different ancestries. Deconstructing chimeric genomes is central to understanding the evolutionary trajectories of their disparate components and thus the organisms as a whole in the light of their evolutionary contexts. Of specific interest is to delineate and quantify native (vertically inherited) and alien (horizontally acquired) components of bacterial genomes and also specify genomic fractions that represent different donor sources. An agglomerative clustering procedure that prioritizes grouping of proximal similar genomic segments has previously been invoked for this purpose in conjunction with a recursive segmentation procedure. Surprisingly, however, the relative strengths and weaknesses of different clustering approaches to deciphering bacterial chimerism have not yet been investigated, despite the need to robustly interpret tens of thousands of completely sequenced bacterial genomes and nearly complete genome assemblies available in the public databases. To bridge this knowledge gap and develop more robust approaches, we assessed different clustering methods, including segment order based (proximal) clustering, hierarchical clustering, affinity propagation clustering, and a novel network clustering approach on chimeric genomes modeled after bacterial genomes representing a broad spectrum of compositional complexity. Although segment order-based clustering and network clustering compared favorably with the other approaches in discriminating between native and alien DNA at genome optimized settings, network clustering did consistently better than other methods at parametric settings optimized on all test genomes together. Segment order-based clustering and hierarchical clustering outperformed other methods in alien DNA identification while preserving donor identity in the genomes. Our study highlights the strengths and weaknesses of different approaches and suggests how this can be leveraged to achieve a more robust deconstruction of bacterial chimerism.
Introduction
Frequent horizontal gene transfer (HGT) among prokaryotes renders their genomes chimeric, with each such genome a collection of vertically transmitted and horizontally acquired genes (Abby et al, 2012; Dagan et al, 2008; Ochman et al, 2000). Deconstructing prokaryotic chimerism provides insights into the plasticity of prokaryotic genomes, which is driven by the propensity of prokaryotes to acquire and assimilate foreign genomic elements from different lineages and thus gain new traits to adapt to changes in the environment.
One of the first steps in this direction is to identify evolutionarily distinct segments in genomes. Because these disparate segments represent different genomic contexts, that is, the contexts of their source genomes, methods that invoke compositional disparity, for example, biases in (oligo)nucleotide composition or codon usage, have been developed to delineate compositionally distinct segments in genomes.
These methods use a moving window scan, gene-by-gene analysis, or a recursive segmentation approach to delineate disparate segments in genomes (Azad and Lawrence 2012; Azad et al, 2007; Braun and Muller 1998; Karlin 1998; Karlin et al, 1998; Ravenhall et al, 2015; Waack et al, 2006; Zhang and Zhang 2004). In addition to detecting the boundaries of distinct segments, methods that relate segments originating from the same source, based on their shared composition, have also been developed (Azad and Li 2013; Boys and Henderson 2004; Gionis and Mannila 2003; Keith 2006; Nicolas et al, 2002).
A combination of recursive segmentation and agglomerative clustering was demonstrated to be the most efficient among all assessed methods in recovering segments originating from different sources in chimeric genomes (Azad and Li 2013). Using this method, a genome is first recursively segmented into compositionally distinct fragments (Fig. 1A). Distinct segment types, representing potentially different sources, are identified via an agglomerative clustering procedure to group compositionally similar segments (Fig. 1B) (Azad and Li 2013; Jani and Azad 2019; Jani et al, 2016).

This step is critical for partitioning the genome into core (native, vertically inherited) and accessory (horizontally acquired) components, with the accessory further partitioned into groups with each representing a distinct donor source. The current approach prioritizes the grouping of proximal segments or clusters of segments. This is based on the premise that the DNA segments from a donor source are likely to be localized to a region and therefore could be more robustly grouped via “proximal” clustering. Although this assumption may not always hold, this approach, referred to as segment order-based clustering henceforth, has been implemented with promising results (Azad and Li 2013; Jani and Azad 2019).
In the current implementation of segment order-based clustering, segments are assessed from 5′-end to 3′-end of a given genome sequence and compositionally similar segments are grouped recursively following this sequential order of the segments along the genome (Fig. 1B). One of the limitations of this approach is that once segments or clusters are merged, they are “frozen” that is, never changed even after the retrieval of more information to refine clustering in the latter rounds of clustering. Any erroneous mergers could have cascading effects of more erroneous groupings of segments or clusters as the clustering progresses.
This could lead to sub-optimal clusters or a clustering configuration that does not adequately represent the inherent compositional structure of the genome. In an extensive benchmarking using a variety of test datasets, this approach still yielded better results than other methods, including those based on optimization techniques (Azad and Li 2013; Jani and Azad 2019). Although it compared well with other methods designed to perform similar tasks, comparisons were not performed with other clustering approaches and therefore whether the segment order-based clustering is the best approach in practice—so far as deconstructing chimeric genomes is concerned—is yet to be established.
In this study, we aimed at bridging the knowledge gaps in the usage of clustering approaches in reconstructing evolutionarily disparate components in chimeric genomes. We compared the performance of the segment order-based clustering approach with hierarchical clustering, where the grouping of two most similar segments or clusters takes precedence in a recursive process, regardless of segment locations within a genome (Fig. 1C), and with network clustering, where a network of segments (nodes representing the segments and edges signifying compositional disparity between the segments) is partitioned into clusters or modules (Fig. 1D).
Note that unlike agglomerative clustering (segment order based or hierarchical) where clusters are built bottom-up beginning with single segment clusters, network clustering is a top-down approach that partitions the network into clusters or modules (Fig. 1D). Affinity propagation, a popular clustering method often compared with network clustering (Frey and Dueck 2007; Moschopoulos et al, 2011; Vlasblom and Wodak 2009), was also tested.
In the context of deciphering genome chimerism, these clustering approaches could have strengths and weaknesses. Segment order-based clustering is expected to recover well the proximal segments originating from a source; however, its effectiveness may be diminished by its sensitivity (SN) to the segment order, as mentioned earlier. Hierarchical clustering addresses the issue of segment order by giving precedence to the most similar segments regardless of their locations in the recursive segment grouping; however, the reconstruction by this approach may be confounded by the presence of segments from phylogenetically proximal donors in a genome of interest, not a rare instance considering that preferential donors to a recipient could more likely be phylogenetically proximal than distant.
These acquired segments from phylogenetically proximal donors could be compositionally similar and may confound reconstruction by hierarchical clustering. The proposed network clustering method was designed to address the limitations of both, segment order-based clustering and hierarchical clustering, namely, the segment order issue with segment order-based clustering, and the issue with bottom-up, segment-by-segment analysis that is intrinsic to both. Previous studies have shown the effectiveness of top-down approach that can simultaneously analyze genes or segments of large structures such as genomic islands, and the network clustering is based on this premise—first construct a segment network and then partition the network in a top-down manner.
This proposed approach, and affinity propagation that generates clusters through search for “exemplars” or representative examples for the clusters, appears promising in concepts; however, their effectiveness in deciphering genome chimerism needs to be demonstrated, and further benchmarked against the segment order-based and hierarchical clustering approaches.
Assessment of the clustering methods was performed using artificial chimeric genomes constructed within a generalized hidden Markov model framework as described in Azad and Lawrence (2005). In the absence of real genomes with evolutionary events known with certainty, artificial genomes serve as a valid test platform for benchmarking different clustering approaches. Artificial chimeric genomes comprised segments with a known evolutionary history and, therefore, have been used in the past to properly assess the performance of competing algorithms (Azad and Lawrence 2005).
As real genomes are often complex with varying levels of heterogeneity, we generated artificial chimeric genomes to mimic prokaryotic genomes with varying degrees of presumed horizontal transfer events. The comprehensive set of simulated genomes, thus, provided an ideal testing platform for assessing clustering methods at different parameter settings.
In what follows, we describe clustering methods evaluated in this study and their performance on a set of artificially chimeric genomes of varying complexity. Each clustering method was tested for its ability to reconstruct segments originating from different sources in artificial chimeric genomes. The effects of parameterization were also investigated, as it is important to understand the SN of a method at different parametric settings to genome heterogeneity given that the vertically inherited and horizontally acquired fractions may vary considerably across chimeric genomes.
Materials and Methods
Genome segmentation and first-pass clustering
Segmentation of genomes is based on the usage of a generalized information-entropic measure, Markovian Jensen-Shannon divergence (MJSD), to recursively partition a sequence into compositional homogeneous segments as described (Arvey et al, 2009; Thakur et al, 2007). MJSD of order m, Dm(p1,p2), quantifies the difference between probability distributions p1 and p2 estimated from respective DNA sequences and is defined as:
where  is the Shannon entropy function for Markov model of order m, x denotes the nucleotide succeeding oligonucleotide w of length m, P(x|w) is the probability of x given the preceding oligonucleotide w, and P(w) is the probability of oligonucleotide w.
  ≡ {A,T,C,G}. πi is the weight associated with pi, π1 + π2 = 1.
Given a genomic sequence S of length L to be segmented into subsequences S1 and S2 of lengths l1 and l2 respectively, pi in Dm(p1,p2) represents the distributions P(w) and P(x|w) in Si, which are estimated using the frequencies of oligonucleotides w and wx in Si. When the weight πi is equal to li/L, MJSD between S1 and S2 can be written as:
where S = S1⨁S2, and ⨁ denotes concatenation. Hm(S) or Hm(Si) is computed using probability distributions P(w) and P(x|w) in S or Si as described earlier. The statistical significance of a value of this measure is assessed based on the probability distribution of this measure that was shown to approximate chi-square distribution
Given a sequence S of length L, the split point in S that results in maximum value of Dm(S1,S2) between resulting subsequences S1 and S2 is identified. The position with maximum Dm value, denoted
where
If the p-value for
Hyper-segmentation is allowed at a relaxed stringency to identify segment boundaries with precision (PR). This generates additional splits of otherwise homogeneous segments, and therefore to remedy this, grouping of similar adjacent segments is performed within the same statistical hypothesis testing framework (Azad and Li 2013). If the p-value for MJSD between two adjacent segments is lower than an established significance threshold for contiguous segment merger, the segments are deemed significantly different; otherwise, they are merged, that is, the boundary between them is purged.
This procedure is performed recursively until no two segments sharing a boundary are deemed similar (Azad and Li 2013). Note that oligonucleotide frequencies for a cluster with multiple segments were obtained by averaging the frequencies in these segments for each oligonucleotide, and the size was obtained as the mean of segment lengths.
Markov model of order 2 (m = 2) was used in all variants of the segmentation-clustering algorithm, as parameters for statistical hypothesis testing have already been determined for the 2nd order model and previous studies have shown promising results with 2nd order model algorithms (Arvey et al, 2009; Azad and Li 2013; Jani and Azad 2019; Jani et al, 2016; Thakur et al, 2007). Both recursive segmentation and first-pass clustering were performed at the significance threshold of 0.05. This threshold was established based on our assessment on artificial chimeric genomes, as described next.
Segment order-based clustering
Location-dependent clustering has been previously implemented in several MJSD-based genome segmentation-clustering programs (Azad and Li 2013; Jani and Azad 2019; Jani et al, 2016). This approach is based on the premise that the horizontally acquired sequences from a source are often localized in a chimeric genome and therefore sequential clustering, based on the order of segments, could reconstruct such structure as this prioritizes grouping of proximal similar segments, thus minimizing the effects of potential cross-clustering of apparently similar segments from different sources.
Given N segments, this algorithm begins with N clusters containing one segment each. Beginning with the first cluster (at the 5′-end of the genome sequence), it is compared with the next cluster in order (5′-end to 3′-end) along the sequence and their compositional difference is assessed using MJSD within the same statistical framework as used for the segmentation and first-pass clustering. If the p-value for this difference is less than a preset significance threshold, the clusters are deemed compositionally distinct; otherwise, they are merged. This is performed recursively until no two clusters can be merged further, that is, the p-value for MJSD between any two clusters is less than the significance threshold.
Hierarchical clustering
Hierarchical clustering was performed to group N clusters containing a single segment each. In a pairwise manner, the compositional difference between clusters in each possible pair was assessed using MJSD. The pair of clusters with minimum MJSD was identified; if the p-value for MJSD was less than a preset significance threshold, then the clusters were deemed compositionally distinct, otherwise these clusters were merged into a single cluster resulting in total N − 1 clusters.
This procedure was followed recursively until no two clusters can be merged further. Hierarchical clustering had previously been implemented to perform clustering of genes based on codon usage patterns to localize putative alien genes in prokaryotic genomes (Azad and Lawrence 2007; Azad and Lawrence 2012).
Markov clustering algorithm-based network clustering
A network of segments was constructed, with nodes representing segments and edges signifying compositional disparity between segments. This followed segmentation of a genome and then first-pass clustering at a significance level of 0.05, as described earlier. An edge connecting nodes was established for each node pair. To each edge was associated a weight based on p-value for MJSD between nodes (segments) connecting the edge. The MJSD p-values for all node (segment) pairs were first computed and were then renormalized to represent weights on edges connecting the nodes. The weight
where
Expansion corresponds to the random walking within the graph, establishing transition probabilities between all nodes. Inflation exaggerates these probabilities by raising all probabilities to a specified value (inflation), followed by a scaling step to ensure that the resulting matrix remains stochastic, with the eventual goal of highlighting clusters (van Dongen 2000). The mcl version 14–137 suite of software was employed for this task (https://www.micans.org/mcl/index.html?sec_software).
Tab-delimited (.abc) file containing each node pair and associated edge weight was inputted to the program that performed clustering with the “mcl” command. Clustering granularity was controlled via the inflation (-I) parameter, with tested values ranging from 1.1 to 30 in 0.1 increments. As this value is increased, the number and the specificity of clusters also increase, that is, more granular cluster configuration appears with increasing inflation parameters (van Dongen and Abreu-Goodger 2012). The output was converted to the recommended native network format of mcl using the “mcxload” and “mcxdump” commands.
Affinity-propagation clustering
A matrix of similarity values based on the p-values for MJSD between segments was constructed for use with the affinity propagation clustering method (Bodenhofer et al, 2011; Frey and Dueck 2007). The similarity matrix contained the complement of p-values for MJSD between segments for all segment pairs, resulting from segmentation and first-pass clustering at the significance level of 0.05. The similarity matrix was inputted to the affinity propagation clustering program (“apcluster” package v1.4.8 through R v4.0.0) that generated clusters of similar segments (Bodenhofer et al, 2011). The performance of the apcluster function is controlled by two primary parameters, “p” and “q,” which control the likelihood of each data sample to become a cluster representative.
By default, apcluster initializes exemplar preferences, determined by the diagonal of the matrix, for all data points. When the p parameter is unspecified, exemplar preferences are set to the quantile assigned by q, with q = 0.5 representing the median and therefore leading to default behavior (Bodenhofer et al, 2011). Although unique preferences can be set for each data point by providing a vector to the p parameter, each segment was considered equally important and the p parameter thus remained unassigned for this benchmark. In all cases, the damping factor was set to 0.90, with the “maxits” and “convits” parameters set to 10,000 and 1000, respectively.
Construction of artificial chimeric genomes
Artificial genomes for assessing the performance of clustering methods were constructed using a generalized hidden Markov model framework, as previously described (Azad and Lawrence 2005). An artificial genome was modeled after a core genome comprised a set of core (native) genes in the genome, which were extracted based on a model selection criterion algorithm at a conservative setting. To model genic variation within a core genome, the core gene set was partitioned into gene classes with distinct mutational biases using a k-means clustering algorithm with relative entropy as the distance metric.
Gene models trained on distinct gene classes were incorporated within the framework of generalized hidden Markov model to generate an artificial genome modeled after the real core genome. Artificial chimeric genomes were constructed by simulating transfer of randomly sampled genes or clusters of genes from a pool of donor artificial genomes into recipient artificial genomes. Complexity of chimeric genomes resulted from both the number of donors and the proportion of horizontally acquired genes.
For this study, 35 artificial genomes modeled after the respective prokaryotic genomes were used (Supplementary Table S1, see tab “Genome Key”). The compositions of 11 artificial chimeric genomes constructed for assessment of clustering methods are also documented in Supplementary Table S1. The artificial chimeric genomes and clustering tools used in this study have been made available at https://github.com/djburks/SGM-Clustering-Programs.
Benchmarking of clustering methods
For each clustering method, the entire parameter space was explored to find the optimal parametric setting that yields the best performance of the method. For segment order based and hierarchical clustering, the significance threshold was varied from 0.999 to 10−15. For MCL clustering, inflation parameter threshold was varied from 1.1 to 30 in 0.1 increment. For affinity propagation clustering, the q-parameter threshold was varied from 0.001 to 0.999 in 0.001 increment.
The accuracy metrics, namely, SN, PR, and F1-score (F1), were computed at each threshold setting for each clustering method. Since the vertically inherited genes are the most numerous in a prokaryotic genome, the native genome component (backbone) is identified by the largest cluster, whereas the alien component is identified by segments in the remaining smaller clusters. We established the optimal threshold settings for both, identifying native component and identifying alien component, based on F1, which is a harmonic mean of SN and PR, computed as follows:
In terms of identifying the native component, true positives (TP), false negatives (FN), and false positives (FP) refer to the number of native nucleotides correctly identified as native (TP), number of native nucleotides incorrectly identified as alien (FN), and number of alien nucleotides incorrectly identified as native (FP), respectively, by a method. In terms of identifying the alien component, TP, FN, and FP refer to the number of alien nucleotides correctly identified as alien (TP), number of alien nucleotides incorrectly identified as native (FN), and number of native nucleotides incorrectly identified as alien (FP), respectively.
One aspect in deconstructing a chimeric genome is the identification of native and alien components of the genome. Without multiple genome comparison, the segmentation coupled with clustering infer these components in a single genome. The success hinges on reconstructing the backbone, which has to be recovered in a single cluster by the method, and thus the native and alien components are inferred based on the cluster size—the largest being native and the rest being alien. Note that native segments often group into two or more distinct clusters and attempts to merge them by relaxing the stringency may result in undesirable mergers.
We, therefore, assessed different clustering methods on their ability to merge native clusters and thus identify the native component robustly. At the algorithmic parameter setting where F1 of a clustering method in identifying the native component was maximized, we further assessed the ability of the method in segregating segments from different sources (native and different donors).
For each source, the clusters that contain majority of their nucleotides from the source were identified; the nucleotides within these clusters were labeled positives and all the remaining nucleotides negatives and TP, FP, and FN (with respect to the source) were computed to assess SN, PR, and overall accuracy (F1) of a method in identifying the source. We performed source-level assessment also at the algorithmic parameter setting, where F1 of a clustering method in identifying the alien component was maximized.
Results
Comparative assessment of clustering methods in native (core) genome isolation
Rationale for native genome identification
Identifying the native or core component of a genome is an important goal in evolutionary genomics as it enables reconstructing the tree of life based on vertically inherited genetic information, specifically the microbial clades where such signals may be obfuscated by frequent horizontal gene exchange. Using compositional bias to identify the core genome may circumvent some limitations of comparative genomics approaches that rely on the sequenced genomes of close relatives to infer the core genome.
Depending on the genomes and criteria considered, the core genome may vary significantly, and therefore using additional information such as composition in conjunction with genome comparison may help in robust extraction of core genome. For example, a native gene that displays sporadic presence in close relatives due to gene loss may gain a support for inclusion in the native group based on its compositional similarity with other (well-supported) native genes. Since the evolutionary history of nucleotides is known with certainty in artificial chimeric genomes, we assessed different clustering methods for their ability to reconstruct the core components of artificial chimeric genomes.
Parametrization for segmentation and first-pass clustering
Markov model of order 2 (m = 2) was used for both segmentation and first-pass clustering, as described in the Materials and Methods section. Note that the core genome was assembled from the segments resident in the largest cluster after segmentation and clustering (see the Materials and Methods section). Both the recursive segmentation and the first-pass clustering to group similar adjacent segments outputted by segmentation were implemented at the significance level of 0.05. This threshold was established based on extensive experiments on artificial chimeric genomes. A significance threshold of 0.05 was observed to yield fragments that consistently match well with distinct segments in artificial chimeric genomes.
Performance of each clustering method at its genome-wise optimal setting
The clustering threshold at which the overall accuracy (F1) in identifying the core component of a genome was maximized was determined for each artificial chimeric genome, for each method. The values of SN, PR, and F1 in identifying core genomes at the optimal settings are provided in Table 1 and the values of SN, PR, and F1 in identifying each source (recipient and different donors) at these settings are provided in Supplementary Table S2.
Sensitivity, Precision, and F1 Score Values in Identifying Native Nucleotides in Test Genomes by Different Clustering Methods at the Genome-Specific Optimal Parameter Settings Where F1 Scores Are Maximal
F1, F1-score; MCL, Markov clustering algorithm; PR, precision; SN, sensitivity.
All clustering methods except affinity propagation clustering attained F1 over 90% across all test genomes (Table 1). Segment order-based clustering and network clustering produced th highest overall accuracy (F1 averaged over 11 test genomes: 0.972); average F1 values for hierarchical clustering and affinity propagation clustering were 0.969 and 0.609, respectively. In genome-wise assessment, segment order-based clustering was found to have maximum F1 for 6 of 11 genomes, followed by networking clustering (three genomes) and hierarchical clustering (two genomes).
As expected, we found that the optimal performance varies with genome composition. Although all clustering methods except affinity propagation clustering did well on genomes with substantial contribution from each of fewer donors (e.g., Artificial Chimeric Genome 1 in Supplementary Table S1), the performance declined with increasing complexity, particularly with increasing number of donors with fewer gene contributions by each (e.g., Artificial Chimeric Genome 7 in Supplementary Table S1).
Trend in overall performance of each clustering method across its entire threshold range and determination of threshold yielding maximal overall accuracy
In our aforementioned assessment, we observed that performance was optimized at different thresholds for different genomes by each method. Thus, a default threshold that can work well across genomes of different compositions cannot be established. However, it could still be possible to determine a threshold or a threshold range where the overall performance is acceptable across genomes of different compositions. We, therefore, computed the performance metrics averaged over all test genomes at each threshold (varied from 10−15 to 0.999 for segment order-based clustering and hierarchical clustering, from 1.1 to 30 (inflation) for network clustering, and 0.001 to 0.999 (q-value) for affinity propagation clustering).
The overall accuracy as assessed by F1 measure is shown as a function of threshold for each method (Fig. 2). As expected, the best performance of both segment order-based clustering and hierarchical clustering was attained when the significance threshold was close to 0 (toward the rightmost end of F1 plots in Fig. 2: 0.019 for the former and 0.002 for the latter; thresholds are represented here as a percentage of the maximum allowable threshold (complement of significance level for hierarchical and segment order clustering)).
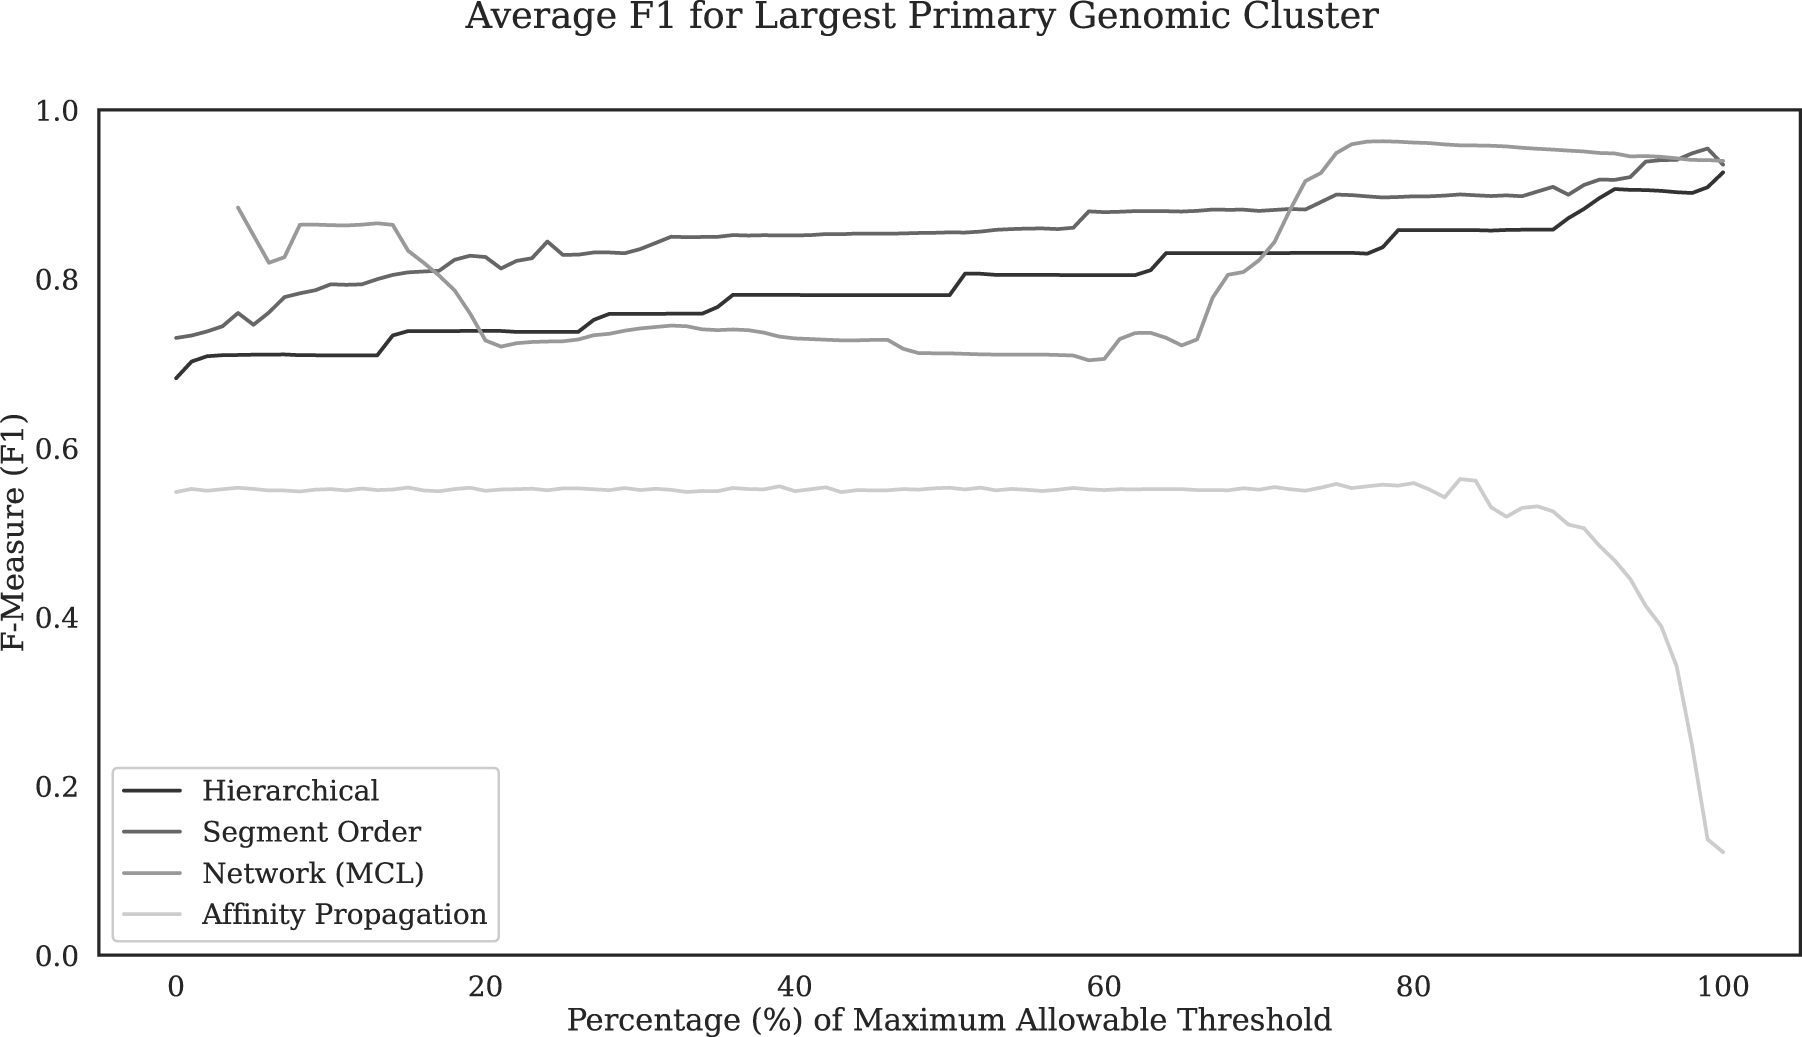
Overall accuracy (F1 averaged over all test genomes) in identifying native (core) nucleotides for each clustering method at increasing thresholds. The network clustering threshold (MCL inflation parameter) is represented as the percentage of the maximum allowable threshold of 30. The affinity propagation threshold is represented as a percentage of the maximum allowable threshold of 1. Agglomerative clustering (hierarchical and segment order) thresholds are represented here as a percentage of the maximum allowable threshold of 1–10−15 (complement of significance level). F1, F1 score; MCL, Markov clustering algorithm.
These are more relaxed stringencies for clustering, allowing the merger of multiple native clusters into a single native cluster. This is apparent in the SN plot (Supplementary Fig. S1), which shows that relaxing stringency (lower p-values) continually increases SN as the significance threshold approaches 0 (toward the rightmost end in Supplementary Fig. S1); however, the PR declines remarkably as alien clusters begin to coalesce with the native cluster as the stringency is successively relaxed (PR plot, Supplementary Fig. S2).
The overall performance of hierarchical clustering was on average lower than that of segment order-based clustering across the entire threshold range (Fig. 2), though this difference becomes much smaller at a significance threshold 0.001 or lower (Fig. 3). Notably, the F1 varied in a stepwise manner with a threshold for both these clustering approaches, more so with hierarchical clustering (Fig. 2). F1 varied in steps because of the fact that a significant increase in recall happened only when a threshold value was reached where small native cluster(s) merged with the largest cluster.
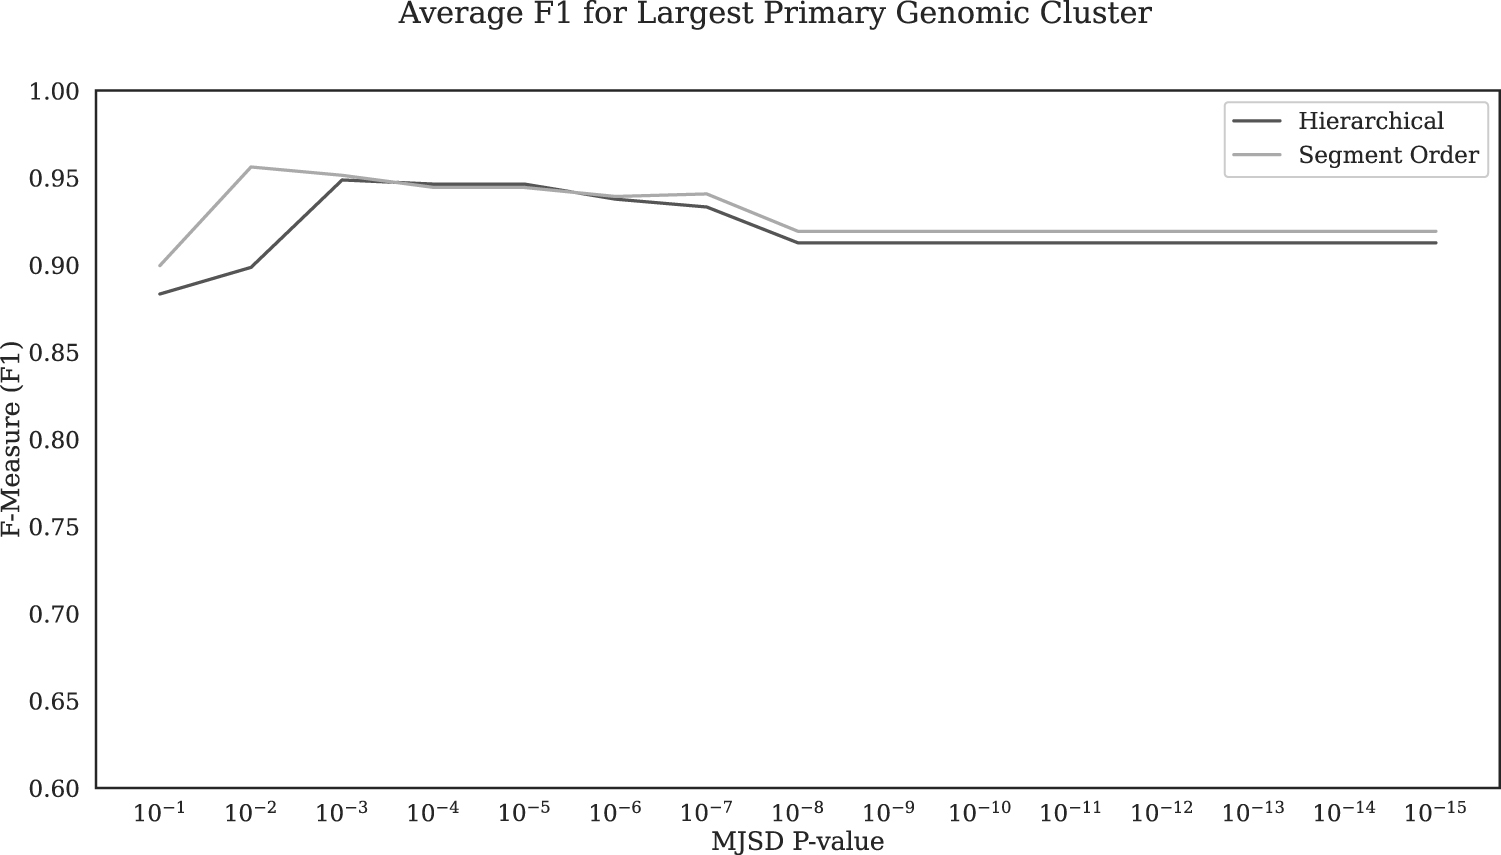
Overall accuracy (F1 averaged over all test genomes) in identifying native (core) nucleotides for the hierarchical and segment order-based clustering methods at MJSD significance level range of 10−1 to 10−15. MJSD, Markovian Jensen-Shannon divergence.
The stepwise pattern is more pronounced with hierarchical clustering where the largest (native) cluster remains invariant over longer threshold intervals until a smaller native cluster merges as the stringency is successively relaxed. The “punctuated” native cluster merger resulting in a ladder step pattern is less apparent with segment order-based clustering, where proximal native segments or clusters are continually merged as encountered from 5′ to 3′ end, recursively (Supplementary Fig. S1).
In contrast, network clustering displayed a different pattern of F1 variation with threshold compared with agglomerative (segment order based or hierarchical) clustering (Fig. 2). In contrast to gradual stepwise variation in F1 with threshold in agglomerative clustering, the F1 variation with inflation parameter is shaped like a bucket with a rather abrupt transition from high to low or low to high F1. The optimal performance (maximal F1) was observed at inflation parameter values between 20 and 23 for artificial chimeric genomes.
Unlike agglomerative clustering where typically a single large native cluster is formed after successive rounds of cluster merger, analysis of cluster formation by network clustering revealed concurrent formation of at least two large native clusters that coalesce at the optimal threshold (typically between 20 and 23), yielding maximal F1.
All methods except for affinity propagation attained high average F1 (>0.9) in identifying native nucleotides, with network clustering with maximal average F1 of 0.963 at threshold 23.3 slightly outperforming segment order-based clustering and hierarchical clustering that attained maximal average F1 of 0.957 and 0.950 at significance thresholds 0.019 and 0.002, respectively (Fig. 2, Table 2). The maximal average F1 of affinity propagation was achieved with the q parameter set to 0.831, but it was much lower than those of the other three methods at only 0.574.
Sensitivity, Precision, and F1 Score Values in Identifying Native Nucleotides in Test Genomes by Different Clustering Methods, Generated at the Optimal Parametric Setting of Each Method Where the F1 Score Averaged Over All Test Genomes Was Maximal
For agglomerative and network clustering, high performance in identifying native DNA was attained at a threshold range that allowed the merger of several native clusters into a single native cluster without incurring undesirable mergers (none or very few alien and native cluster mergers); these were inflation parameter range 20–23 for network clustering and significance level range 0.01–0.001 for agglomerative clustering. This was not the case for affinity propagation, where although the PR remained high across all tested thresholds (>0.9) (Supplementary Fig. S2), the SN was consistently low (< 0.54) and declined sharply after reaching a maximal average of 0.538, resulting in a similar trend observed with F1 (Supplementary Fig. S1).
Genome-wise performance shows that the overall accuracies of the methods declined (Table 2, Supplementary Table S3) compared with the performance at genomic-specific optimal settings (Table 1, Supplementary Table S2), as expected. Network clustering produced maximum F1 for 8 out of 11 genomes, outperforming other methods (Table 2). Segment order-based clustering, hierarchical clustering, and affinity propagation clustering produced maximum F1 for 2, 1, and 0 genome(s), respectively (Table 2).
In Supplementary Table S3, we provide average SN, PR, and F1 in identifying sources (recipient and different donors) at the same threshold setting that yielded maximal average F1 in identifying native DNA for each method (Fig. 2). Network clustering whose maximal average F1 in identifying native DNA was highest among all four methods identified sources more robustly than other methods (identified 71 sources with F1 > 0.7, whereas the hierarchical, segment order-based, and affinity propagation clustering methods identified 69, 68, and 59 sources, respectively, with F1 > 0.7).
Notably, F1 for native source was greater for the former compared with the latter three clustering approaches. This demonstrates that a better discrimination of native from alien is attained via robust grouping of segments from different sources, particularly by robustly grouping the native segments into a single large native cluster in this particular instance.
Comparative assessment for alien genome identification
Rationale for alien genome identification
Quantifying alien component of prokaryotic genomes is central to understanding how prokaryotes evolve through HGT and acquire novel traits, for example, virulence, antibiotic resistance, or novel metabolic capabilities that help them adapt to new conditions or environments. Robust delineation and aggregation of alien segments is critical to achieving this goal. Therefore, similar to native DNA identification, we compared the four clustering methods to determine the approach and algorithm parameter setting that yield the maximal overall accuracy in alien DNA identification. Note that the approach and parameter setting that yielded maximal overall accuracy in native DNA identification may not necessarily represent the optimal framework for alien DNA identification as well.
Performance of each clustering method at its genome-wise optimal setting
First, at each threshold setting, the largest cluster was identified as native and the remaining clusters as alien (the native nucleotides being most numerous coalesce into a large cluster whereas the alien nucleotides coalesce into several small clusters each representing a distinct donor source, consistent with the composition of prokaryotic genomes previously reported). SN, PR, and F1 for alien nucleotide detection were computed and the values for each artificial chimeric genome at the optimal setting (where F1 was maximized) were tabulated (Table 3).
Sensitivity, Precision, and F1 Score Values in Identifying Alien Nucleotides in Test Genomes by Different Clustering Methods at the Genome-Specific Optimal Parameter Settings Where F1 Scores Are Maximal
Network clustering produced the highest F1 in identifying alien nucleotides for 5 of 11 artificial chimeric genomes, displaying a better performance than the other clustering approaches; the average F1 of 0.928 by segment order-based clustering was, however, ∼0.003 higher than network clustering with the highest alien nucleotide F1 for 4 of 11 artificial chimeric genomes. This is primarily due to the performance discrepancy between network clustering and segment order-based clustering in detecting alien nucleotides in Artificial Chimeric Genome 1, the chimeric genome with the least amount of alien nucleotides (5%).
Hierarchical clustering with average F1 of 0.914 generated the highest alien nucleotide F1 for 2 of 11 artificial chimeric genomes; affinity propagation clustering with average F1 of 0.517 was outperformed by the other methods on both aggregate and individual genome tests. The values of these metrics in identifying nucleotides from each source (recipient and different donors) within the same optimized settings are provided in Supplementary Table S4. The percentages (and relative percentages) of native and donor nucleotides in each cluster at these and other optimal settings are illustrated in Supplementary Figures S3–S6.
Trend in overall performance of each clustering method across its entire threshold range and determination of threshold yielding maximal overall accuracy
Similar to the analysis for native nucleotide identification, we also assessed the F1 for alien DNA identification averaged over all test genomes at each threshold for each method (Fig. 4). SN, PR, and F1 for each genome at the setting where average F1 for alien DNA identification was maximized is provided in Table 4 for each method and the values of these metrics for each source in test genomes at the same setting are provided in Supplementary Table S5. At its optimal setting, network clustering generated F1 (averaged over 11 genomes) of 0.903 outperforming other clustering methods (average F1 for the segment order-based, hierarchical, and affinity propagation clustering methods were 0.881, 0.864, and 0.499, respectively; Table 4).

Overall accuracy (F1 averaged over all test genomes) in identifying alien nucleotides for each clustering method at increasing thresholds. The network clustering threshold (MCL inflation parameter) is represented as the percentage of the maximum allowable threshold of 30. The affinity propagation threshold is represented as a percentage of the maximum allowable threshold of 1. Agglomerative clustering (hierarchical and segment order) thresholds are represented as a percentage of the maximum allowable threshold of 1–10−15 (complement of significance level).
Sensitivity, Precision, and F1 Score Values in Identifying Alien Nucleotides in Test Genomes by Different Clustering Methods, Generated at the Optimal Parametric Setting of Each Method Where the F1 Score Averaged Over All Test Genomes Was Maximal
Although these values are less than those from a genome-wise optimal setting (Table 2) as expected, they are still close and just within 3% for network clustering highlighting its ability to provide a stable parametric setting for application to genomes of variable composition in identifying the alien nucleotides. Notably, network clustering was found to have maximum F1 for 9 of 11 genomes.
Assessment of the clustering methods in inferring alien DNA sources
Although identifying alien nucleotides could serve well the purposes of some studies, the goal of deciphering clusters arising from different donor sources may not be well served if the focus is on only native and alien discrimination. For example, a method may allow alien clusters from different sources to merge native clusters to achieve maximal F1 in alien nucleotide identification. Therefore, in our second way in assessment, we evaluated the ability of the clustering methods in inferring alien DNA sources by identifying clusters that harbor segments from each donor source.
If DNA sequences from a source organism were assigned to multiple clusters, only those clusters with majority of resident nucleotides belonging to the source were deemed as representing the source organism. As artificial genomes are modeled after core genomes, we expect a method to generate as many clusters as sources contributing to an artificial chimeric genome. Therefore, we selected the largest cluster among clusters representing a source organism, and we then computed SN, PR, and F1 in identifying each donor source for each artificial chimeric genome.
The values of these metrics, averaged over the donors, indicate the ability to identify alien DNA in a genome while preserving the identity of the donors in the process. These values at the optimal settings of clustering methods are provided for each genome in Table 5, and the respective values for each source in each genome are provided in Supplementary Table S6. Note that in the event that a donor was not identified as the majority representative of a single cluster, the F1 for that particular donor was considered zero.
Sensitivity, Precision, and F1 Score Values in Identifying Alien Nucleotides While Preserving Donor Identity in the Test Genomes by Different Clustering Methods, Generated at the Optimal Parametric Setting of Each Method Where the F1 Score Averaged Over All Test Genomes Was Maximal
The cluster representing each donor is the largest cluster harboring segments primarily of that donor.
Segment order-based clustering produced the highest F1 scores for a majority of genomes (6 of 11 genomes), whereas hierarchical, network, and affinity clustering methods produced highest F1 on 4, 1, and 0 genome(s) respectively. The values of F1 averaged over 11 genomes were similar for segment order-based clustering and hierarchical clustering (0.662 and 0.665, respectively), and they were higher than those for network clustering (0.619) and affinity propagation clustering (0.609). Further, we computed SN, PR, and F1, averaged over all genomes, at different threshold settings for each method (Fig. 5, Supplementary Figs. S7 and S8).
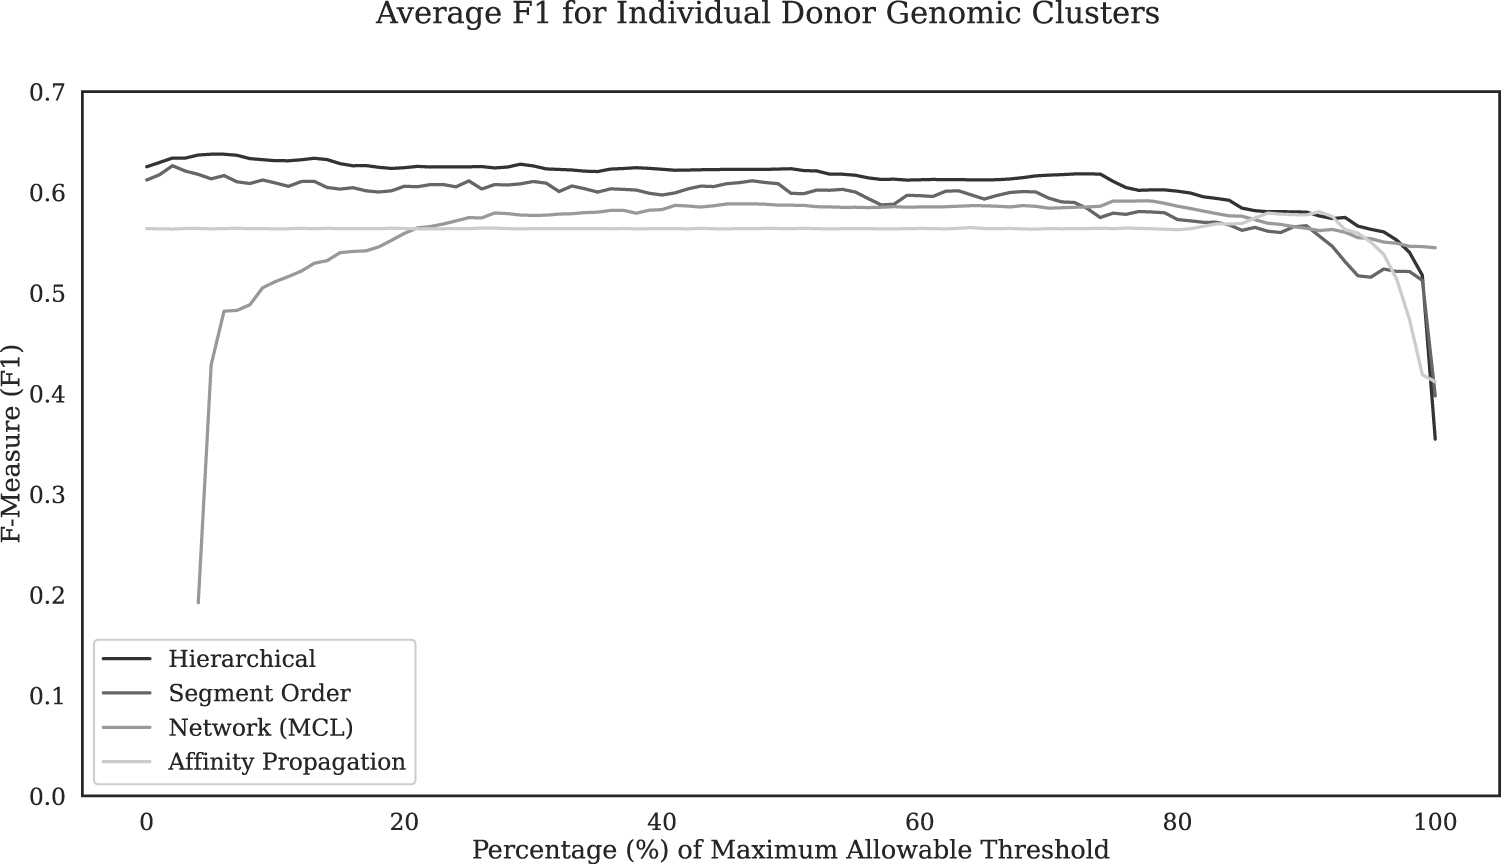
Overall accuracy (F1 averaged over all test genomes) in identifying alien nucleotides while preserving donor identity in the genomes for each clustering method at increasing thresholds. The network clustering threshold (MCL inflation parameter) is represented as the percentage of the maximum allowable threshold of 30. The affinity propagation threshold is represented as a percentage of the maximum allowable threshold of 1. Agglomerative clustering (hierarchical and segment order) thresholds are represented as a percentage of the maximum allowable threshold of 1–10−15 (complement of significance level). The cluster representing each donor is the largest cluster harboring segments primarily of that donor. For donors that did not make up the majority of nucleotides in any cluster, the values of metrics SN, PR, and F1 were deemed zero. PR, precision; SN, sensitivity.
F1 of all four methods varied within 5% for over 90% of their threshold range (Fig. 5). The maximal average F1 values were 0.623, 0.615, 0.576, and 0.563 for hierarchical clustering, segment order-based clustering, network clustering, and affinity propagation clustering, respectively. Thus, overall, agglomerative clustering methods outperformed other clustering approaches in alien DNA identification while preserving donor identity in the genomes.
Notably, the thresholds that yielded maximal F1 in native and alien DNA detection differ noticeably for agglomerative clustering methods; in contrast, there was an overlap of the optimal threshold ranges for native and alien DNA detection by network clustering. Affinity propagation clustering, as with native genome isolation, performed worse than the other methods.
Discussion
Our analysis highlights the promises and challenges of different clustering approaches in unraveling bacterial chimerism. Although segment order-based clustering was introduced as a part of an integrative approach to segment and cluster bacterial DNA sequences, it is for the first time that hierarchical, network, and affinity propagation clustering techniques were assessed along-side segment order-based clustering in this context. Although hierarchical clustering was earlier employed for gene clustering to identify compositionally atypical genes (Azad and Lawrence, 2007), it was not tested on variable length genomic fragments outputted by a recursive segmentation program.
Diametrically opposite to agglomerative clustering is network clustering; it partitions the network to identify clusters rather than builds bottom up as with agglomerative clustering. Network clustering brought a new perspective in addressing this problem, as this is conceptually different from often invoked agglomerative clustering. The top-down approach that performs partitioning or segmentation of an organized dataset (e.g., a genome or a network) was earlier found to be more effective in localizing horizontally acquired regions in bacterial genomes in comparison to bottom-up methods such as agglomerative clustering (Arvey et al, 2009).
The horizontally acquired genomic segments were earlier identified by assessing the atypicality of each segment against the genome background (Arvey et al, 2009). Later studies showed that clustering after segmentation yields even more promising results; however, only the agglomerative clustering approach was tested (Azad and Li, 2013). The problem with the bottom-up (agglomerative) approach is that members of earlier formed clusters are not allowed to be reassigned at later rounds of clustering (except for the merger of two clusters into a new cluster) when additional information emerges that may rectify any past misassignments.
If clusters are not refined at successive steps, impurities in the clusters may only amplify as clustering proceeds. Both segment order-based and hierarchical clustering approaches are prone to be affected by this. Although reassignment is itself a non-trivial problem, another issue that afflicts segment order-based clustering is that clustering configuration varies by how the grouping is initiated (i.e., from 5′-end or 3′-end of a genome). This is not unexpected, as earlier rounds of clustering dictate the later rounds and thus the directionality impacts the clustering. Hierarchical clustering, however, proceeds independent of directionality.
Deciphering the underlying structure using agglomerative clustering has its pitfalls; however, this may still yield reasonably good outcomes. This was realized while probing genomic islands in bacterial genomes by previous studies that led to the development of a top-down, recursive partitioning approach that allowed assessment of entire information content to successively generate compositionally homogeneous segments (Arvey et al, 2009). Here, we explored whether a top-down rather than a bottom-up approach could again be invoked to more efficiently reconstruct the chimeric structure of bacterial genomes after segmentation.
We posited that this could be feasible within a network framework that will allow partitioning the network of segments into modules or clusters of similar segments. Implementation of networking clustering and comparative assessment revealed its promising aspects; at the same time, it also highlighted the complementarity of different approaches.
Agglomerative clustering performed well in discriminating between native and alien DNA at genome optimized thresholds, whereas the optimal threshold settings varied among genomes. Considering that optimizing a clustering program on a just sequenced, anonymous genome may not be feasible, we assessed the clustering methods for their performance averaged over the test genomes across the entire threshold range for each method. Our intent was to identify a threshold range for each method where its maximal or close to maximal overall performance could be attained. We observed the network clustering's overall performance maximizing within a certain inflation parameter range (averaging 25.7 ± 3.7 for native and 25.1 ± 3.7 for alien DNA identification, Figs. 2 and 4 and Tables 1, 2), reaching a maximal higher than by other methods for both native and alien identification.
This demonstrates that top-down partitioning post-segmentation, indeed, yields a better outcome. However, the accuracy is lower over a large range than agglomerative clustering before it begins to spike toward maximal that appeared more stable with native than alien DNA identification. Agglomerative clustering's performance is relatively less variable over the entire threshold range and reaches the maximal at low p-values as expected (right end of hierarchical clustering and segment-order clustering curves in Figs. 2 and 4).
These results highlight the strengths and weaknesses of different approaches, and future studies could focus on exploiting the complementary strengths of different clustering approaches to develop an integrative method for native and alien DNA identification. For example, as agglomerative clustering's performance is less variable and is optimal in low p-value range, one can first use agglomerative clustering to get a cue of cluster structure inherent to a genome of interest and then follow up with network clustering to “fine-tune” to optimal or nearly optimal cluster configuration.
This will help exploit the benefits of the network approach while obviating low accuracy risk as could occur within certain inflation parameter ranges with network clustering (Figs. 2 and 4). This is supported by our observation that with network clustering, the merger of large native clusters happened within the inflation parameter range of 16–23 across all artificial chimeric genomes yielding maximal F1, and therefore fine tuning can be performed within this range.
Identifying native component of a genome is an important goal, and the alternative approach suggested here will complement the frequently used comparative genomics approach in establishing backbone genomes in different taxa (Chung et al, 2018; Daubin et al, 2002; Na et al, 2018; Segata and Huttenhower 2011). Our results showed that the overall accuracy (F1) in identifying native DNA in an ensemble of artificial chimeric genomes could reach up to 0.972, with network clustering as the best overall performer.
Genome-wise optimal performers for native DNA identification varied among agglomerative and network clustering methods. Using both in concert, as suggested earlier, may enhance the reliability of clustering in inferring the core component of bacterial genomes. In addition to estimating native and alien nucleotides in bacterial genomes, estimating donors is another problem where the power of clustering can be leveraged upon. Clustering methods may be expected to group segments from each donor within a unique cluster but a donor genome may be chimeric and therefore multiple clusters may also be expected for a donor.
Here, as we used genomes modeled after the respective cores of the bacterial genomes, we expect methods to group segments from a donor into a single cluster. Note that the genomes were modeled on cores that were obtained by removing compositionally atypical genes; a core, thus, represents the mutational proclivity of the recipient genome with the composition shaped by the directional mutational pressure specific to that genome. Because of the superior performance of agglomerative clustering in identifying alien DNA while preserving donor identities in the major clusters of the donors, one can use this for more reliably estimating the donors.
It must also be emphasized that the performance of clustering methods exploiting compositional disparity in delineating native and alien DNAs declines with increasing complexity of chimeric genomes. For example, when the number of donors for the artificial chimeric Escherichia coli genome was increased to 34, with each contributing ∼1.5% resulting in the recipient E. coli genome comprising ∼50% alien DNA (Artificial Chimeric Genome 7 in Tables 1–5), the overall accuracy (F1) declines in general.
This is expected as a lower number of donors with greater contribution by each will provide substantial proportion of DNA by each and thus a better statistics aiding alien DNA quantification by the clustering methods. Note that even when challenged with test genomes of a high level of complexity, the best performing clustering methods (agglomerative/network) could still attain overall accuracy in ∼68–92% range for native or alien DNA identification (Tables 1–4), indicating their potential utility in interpreting even complex bacterial genomes.
In summary, agglomerative and network clustering approaches possess complementary strengths that can be exploited to understand the different facets of genome chimerism, which may not be possible with any single method. Future efforts could focus on integrating different approaches toward the goal of still better interpretation of bacterial genomes.
Footnotes

References
Supplementary Material
Please find the following supplemental material available below.
For Open Access articles published under a Creative Commons License, all supplemental material carries the same license as the article it is associated with.
For non-Open Access articles published, all supplemental material carries a non-exclusive license, and permission requests for re-use of supplemental material or any part of supplemental material shall be sent directly to the copyright owner as specified in the copyright notice associated with the article.
