
Abstract
Satellite noncoding RNAs (ncRNAs) are a new frontier of cancer biology research and biomarkers. While the knowledge on ncRNAs in human cancers is still limited, studies in other species can be informative to guide future translational research and development for cancer molecular targets and diagnostics. In this context, FA-SAT is the major satellite DNA of the cat genome, which is also present in humans, being transcribed in both species. In this study, we report new insights on FA-SAT (DNA and RNA) profile in feline mammary tumors, using disease-free tissues from the same animals as reference. We quantified the FA-SAT DNA and RNA levels (long and small transcripts) by real-time quantitative polymerase chain reaction (qPCR) and RT-qPCR. The comparison of the FA-SAT DNA and RNA levels with clinicopathological parameters revealed several associations, such as (1) the FA-SAT DNA levels' positive relation with lymphovascular invasion, (2) the FA-SAT long RNA negative correlation with Ki-67 index, and its positive association with Estrogen Receptor status, and (3) the FA-SAT small RNA level positive correlation with tumor size and skin ulceration. Also, FA-SAT long RNA is correlated with ERBB2 and c-MYC RNA levels. These data collectively suggest that FA-SAT ncRNA offers prospects as a potential cancer biomarker in cats. Further studies in humans are also needed to decipher the emerging role of ncRNAs in cancer biology and precision medicine fields. This work brings new information on the relation of FA-SAT ncRNAs with the oncogenic process, uncovering a new potential cancer biomarker.
Introduction
Satellite DNA (satDNA) sequences were considered, for many years, transcriptionally repressed due to their major location at the genome heterochromatic regions (Ferreira et al, 2015; Plohl et al, 2008). However, it has been shown that satDNAs are transcribed, yielding satellite noncoding RNAs (satncRNAs) with important cellular functions, which have also been described as cancer key players (reviewed in Ferreira et al, 2015).
Although the exact function of satncRNAs in cancer is unclear, different works described their association with genomic instability (Brown et al, 2012), with different cancer-related proteins (Crea et al, 2014; Ferreira et al, 2019a; Frescas et al, 2008; Kononenko et al, 2014; Zhu et al, 2011) and their overexpression in cancer (Arutyunyan et al, 2012; Bersani et al, 2015; Frescas et al, 2008; Tilman et al, 2012; Ting et al, 2011; Zhu et al, 2011). In fact, the overexpression of specific satncRNAs has been suggested as a useful/valuable cancer biomarker (Kondratova et al, 2014), which has been neglected over the years (Ferreira et al, 2015; Kondratova et al, 2014; Ting et al, 2011).
FA-SAT is the major satDNA of Felis catus (FCA, domestic cat) genome (Fanning, 1987), with a primary location at the telomeres and a secondary location at the centromeres of some chromosomes (Modi et al, 1988; Santos et al, 2004). Recently, Chaves et al. (2017) showed that FA-SAT is also distributed in an interspersed manner using an in silico approach on the cat whole genome sequencing data. Besides the cat genome, the presence of FA-SAT DNA and RNA was already observed in other species' genomes (such as human) (Chaves et al, 2017; Ferreira et al, 2019a) and its transcription was described in tumor (Ferreira et al, 2019a; Ferreira et al, 2019b) and in nontumor cells (Chaves et al, 2017; Ferreira et al, 2019a; Ferreira et al, 2019b).
Furthermore, through the analysis of FA-SAT DNA and RNA (long and small transcripts) and the DNA methylation status in tumor cells (a cat tumor cell line and feline mammary tumors (FMT)) and nontumor cells, it was proposed that DNA methylation is involved in its regulation, but in cancer, other mechanisms may influence its transcriptional status (Ferreira et al, 2019b). In addition, these FA-SAT noncoding RNAs (ncRNAs) showed to be an important PKM2 interactor in the cross-talk between proliferation and apoptosis events (Ferreira et al, 2019a), which are frequently unsettled in tumor cells (Gutschner and Diederichs, 2012; Hanahan and Weinberg, 2011).
As FA-SAT is the major repetitive sequence of the cat genome, this is the obvious model for a comparative study in tumor cells. Moreover, cat is an excellent model, specifically for the study of the biology of mammary tumors and for translational cancer therapeutics (Adega et al, 2016; Cekanova and Rathore, 2014), as naturally occurring mammary tumors in cat present a high level of clinical and biological similarities to human breast cancer (Cekanova and Rathore, 2014).
To understand the clinical significance of FA-SAT and its relation with other cancer-related genes, we analyzed FA-SAT DNA and RNA (long and small) variation in 27 FMT and in the correspondent disease-free tissue (DFT) (from the same individual). This analysis revealed that FA-SAT DNA is not amplified and only the FA-SAT small RNA is overexpressed in these samples. The integration of the FA-SAT profile data with other tumor parameters (morphological, cellular, and molecular) resulted in interesting correlations, such as the positive relation between FA-SAT DNA levels and lymphovascular invasion, FA-SAT long RNA and estrogen receptor status, FA-SAT small RNA and tumor size and skin ulceration, and the negative association between FA-SAT long RNA and Ki-67 index.
Previously studied in this set of tumors was the ERBB2, (Ferreira et al, 2019d) and PKM2 and c-MYC RNA levels (Ferreira et al, 2019c). Thus, an analysis of their correlation with FA-SAT levels was performed and an association was found between FA-SAT long RNA and ERBB2 and c-MYC RNA levels. This work brings new information on the relation of FA-SAT ncRNAs with the oncogenic process, uncovering a new potential cancer biomarker.
Materials and Methods
Mammary tissue collection and characterization
The 27 mammary malignant tumors and the corresponding DFTs collected from female cats were received from different veterinary hospitals and private practices, with the owner's consent and in accordance with the EU Directive 2010/63/EU and with ARRIVE guidelines. The research ethics approval was (Faculty of Veterinary Medicine, University of Lisbon) in the frame of a project from the Science and Technology Foundation (FCT) from Portugal, with the reference PTDC/CVT-EPI/3638/2014.
The tumors were histologically classified according to the World Health Organization (WHO) criteria for canine and feline mammary neoplasms, with the Elston & Ellis (EE) grading system (Elston and Ellis, 2002) and the Mills grading system (adapted for FMC) (Dagher et al, 2019) used to determine the malignancy grade. The cats were from different breeds and age ranged from 7 to 17 years; their mammary glands and regional lymph nodes were clinically/physically examined. The DFTs were collected from another mammary gland, with a histopathological confirmation for the absence of preneoplastic alterations.
The following clinicopathological parameters were recorded when possible: size of the tumor (T1 < 2 cm; T2 > 2 cm and <3 cm; T3 > 3 cm), reproductive status, administration of oral contraception, mastectomy accompanied by ovariohysterectomy (OVH), presence of multiple tumors, lymph node metastasis, necrosis, lymphovascular invasion, lymphocytic inflammation, and skin ulceration.
Tumors and normal mammary tissues were surgically excised and immediately preserved in an RNA stabilization solution (RNA Later Tissue Collection, Ambion) at −80°C to prevent RNA degradation. A part of the sample was formalin fixed and paraffin embedded for the immunohistochemistry (IHC) analysis, and a sample of blood of each animal was collected for serum analysis. Clinical staging was performed using the TNM system and animals were classified in four stages (Sorenmo et al, 2013).
All the animals were followed up after the tumor removal for survival, recurrence, and type of recurrence data collection. The IHC detection and quantification analysis of HER2 (Human Epidermal growth factor Receptor 2), Ki-67 (i.e., a proliferation marker protein), PR (Progesterone Receptor), ER (Estrogen Receptor), and CK5/6 (Cytokeratin 5/6) in the mammary tumors were performed according to Soares et al. (2016b). The analysis of these proteins allowed to obtain the molecular classification of tumors, applying the St. Gallen International Expert Consensus panel (Goldhirsch et al, 2013; Soares et al, 2016a).
Genomic DNA and total and small RNA extraction
Genomic DNA extraction was performed using the Quick-Gene DNA Tissue Kit S (Fujifilm Life Science) following the manufacturer's instructions. Both fractions of RNA (long and small) were isolated with the mirVana™ miRNA Isolation Kit (Ambion, Life Technologies) as described by the manufacturer. The long RNA fraction samples were submitted to DNA degradation with the TURBO DNA-free Kit (Ambion, Life Technologies).
FA-SAT copy number quantification
FA-SAT copy number quantification (primers in Supplementary Table S1) was performed using the standard curve method, as described in Chaves et al. (2017). The copy number quantification of each DNA sample was obtained by interpolating its CT-value against the standard curve. In the PCR reaction, 5 ng of genomic DNA were used for the FA-SAT DNA quantification. The MeltDoctor HRM Master Mix, which employs the SYTO9 dye (Applied Biosystems, Thermo Fisher Scientific), was used in the reactions, following the recommendations of the manufacturer.
These experiments were performed in a StepOne real-time PCR system (Applied Biosystems, Thermo Fisher Scientific). The samples were exposed to an initial denaturation at 95°C (10 min), and then to 40 cycles at 95°C for 15 sec followed by 59°C for 45 sec and 72°C for 1 min. At the end, a melt curve was performed to evaluate the primer specificity. All reactions made in triplicate and negative controls (without DNA) were also included. The StepOne software (version 2.2.2, Applied Biosystems, Thermo Fisher Scientific) was used to create the standard curve (parameters in Supplementary Table S2) and for data analysis. The absolute quantification was transformed in fold changes using the standard curve equation and always in comparison with the respective control sample.
RNA expression analysis by real-time RT-qPCR
The standard curve method described in Chaves et al. (2017) was used for FA-SAT RNA quantification (primers in Supplementary Table S1). The absolute quantification of RNA for each sample was obtained by interpolating its CT-value against the standard curve (parameters in Supplementary Table S2). Verso 1-Step RT-qPCR kit, SYBR Green, ROX (Thermo Fisher Scientific), was used, following the recommendations of the manufacturer and using 80 ng of RNA in all the PCR reactions, which were carried out in a 48-well optical plate (StepOne real-time PCR system, Applied Biosystems, Thermo Fisher Scientific) at 50°C for 15 min and 95°C for 15 min, followed by 40 cycles of 95°C for 15 sec, 59°C for 45 sec, and 72°C for 1 min. Subsequently, a melt curve was performed to evaluate the primer specificity.
All reactions were made in triplicate, and negative controls (without RNA and without Reverse Transcriptase) were also included in the plate. The data were analyzed using the same parameters and the StepOne software (version 2.2.2, Applied Biosystems, Thermo Fisher Scientific).
Statistical analysis
The statistical software SPSS (Statistical Package for the Social Sciences, version 17.0), the GraphPad Prism 6 (version 6.01), and the R software (The R Foundation for Statistical Computing, 3.3.1 version) were used in the statistical analysis. The Student's t-test (two tailed) was used for the analysis of the variation of DNA copy number and expression data between the FMT and the DFT. The Chi-square test and the Fisher's exact test were used to compare categorical variables. Analysis of variance (ANOVA) test was used for analyzing continuous variables with categorical variables.
The Pearson's correlation coefficient calculation was performed to verify the presence of a correlation between continuous variables. As the RNA quantification data did not present a Gaussian distribution, the values were transformed with the log function to normalize the value distribution. The correlogram was made with GraphPad Prism 6 (version 6.01) and R software's (The R Foundation for Statistical Computing, 3.3.1 version). All values are expressed as mean ± SD (standard deviation). The exceptions are the data presented in the box-plot graphics that represents the median, quartiles, and extreme values within a category. In all statistical comparisons, p ≤ 0.05 was established as representing significant difference.
Results
FA-SAT DNA is not amplified and only FA-SAT small RNA is overexpressed in FMT
Different satDNA sequences were described as being amplified in tumor cells (Bersani et al, 2015; Savelyeva et al, 1994), including FA-SAT (Ferreira et al, 2019b; Santos et al, 2006). In this study, we analyzed the DNA copy number of this sequence in 26 FMTs and in the respective DFT. Interestingly, as can be observed in Figure 1a (Supplementary Table S3), the majority of tumors (50%) presented the decrease of FA-SAT DNA copies (cutoff ≥twofold), the amplification only observed in about 8% of tumor collection analyzed.
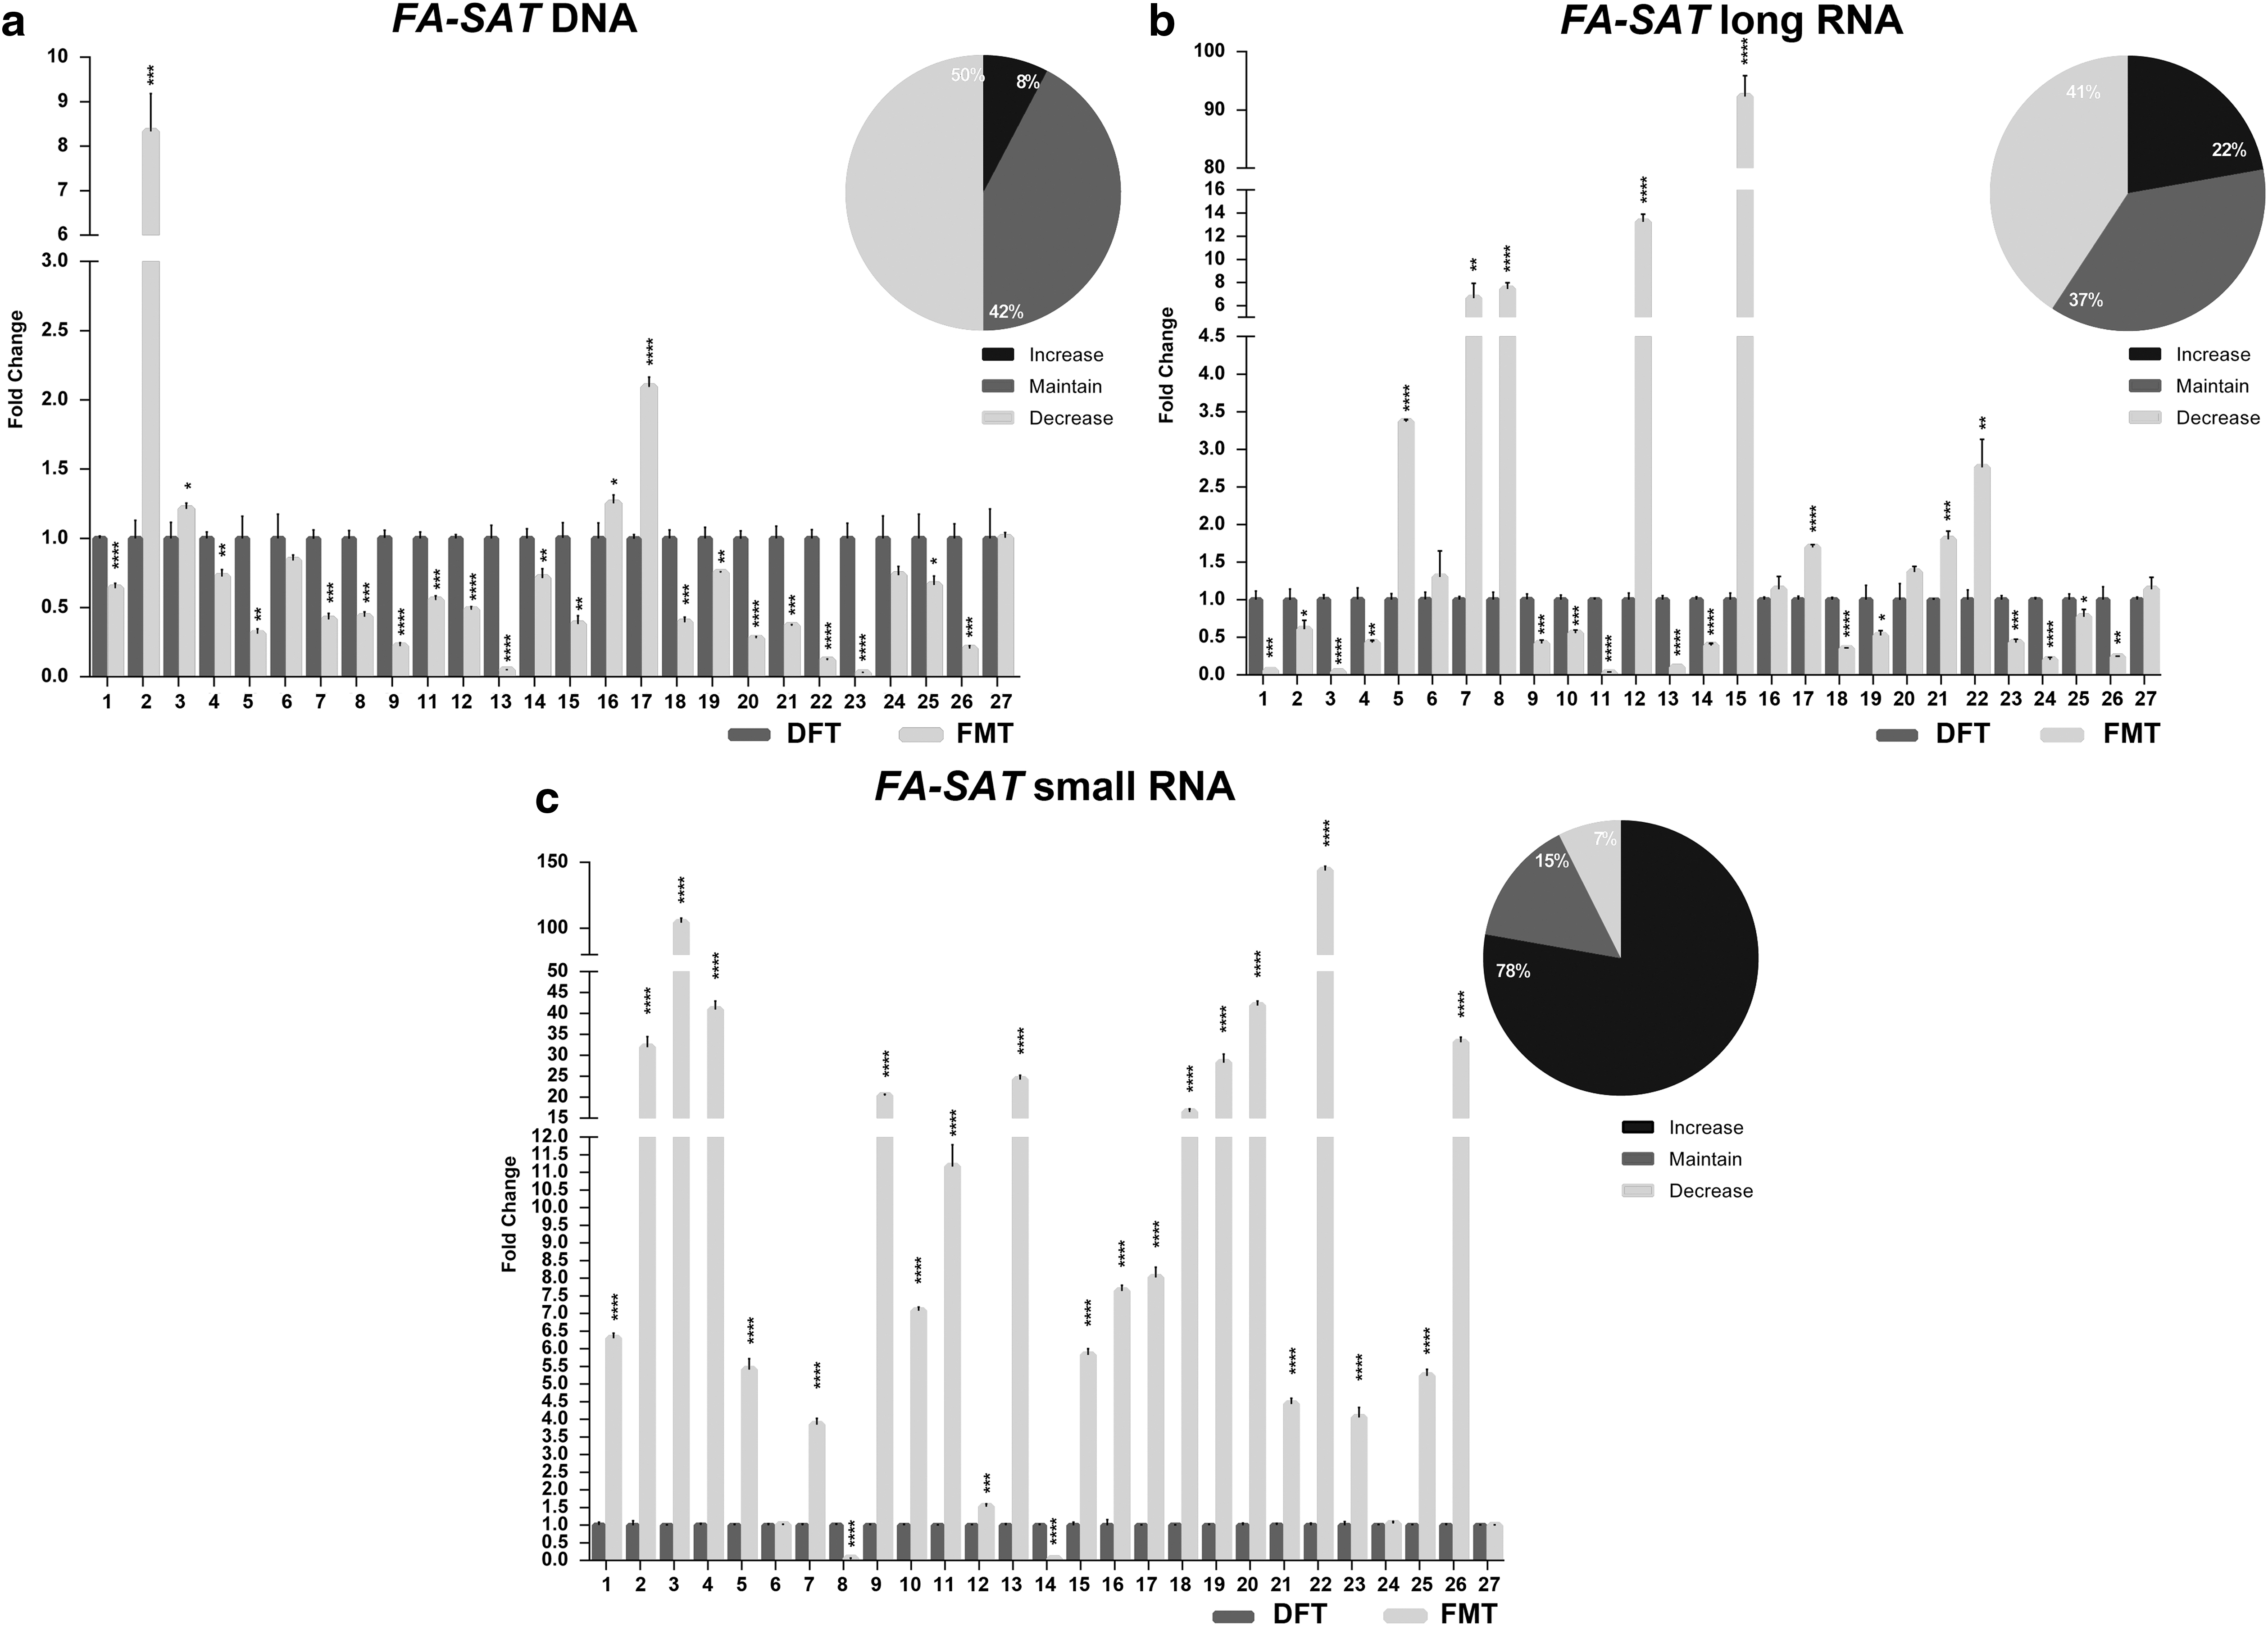
FA-SAT DNA and RNA profiling in FMT.
Regarding FA-SAT ncRNA, small and long transcripts were found in cat tumor and nontumor cells (Ferreira et al, 2019b). For that reason, the presence of FA-SAT long and small transcripts was investigated in the 27 FMT samples here in analysis. Figure 1b (and Supplementary Table S3) demonstrates that the majority of tumors presented a decrease (41%) or maintenance (37%) of FA-SAT long RNAs. On the other hand, FA-SAT small RNA (Fig. 1c, Supplementary Table S3) showed to be overexpressed in the great majority of the tumors analyzed (78%).
Comparing FA-SAT DNA and RNA status, it is possible to detect a statistical association between FA-SAT DNA and FA-SAT long RNA levels (p = 0.014, n = 26) (Supplementary Table S4). However, when the samples that showed DNA amplification were individually analyzed, the FA-SAT long RNA levels are maintained and when the FA-SAT long RNA is overexpressed, DNA amplification is not observed.
FA-SAT DNA and RNA are related with clinicopathological parameters
As this FMT panel is fully characterized at different clinicopathological parameters, we further investigated its putative association with FA-SAT DNA and RNA (using one-way ANOVA), and some interesting results were found (Table 1).
FA-SAT DNA and Long and Small RNA Association with Several Clinicopathological Parameters
This analysis was performed using one-way ANOVA.
ANOVA, analysis of variance; EE, Elston & Ellis; ER, estrogen receptor; HER2, HER2 type; LA, luminal A; LB, luminal B; LBHER2, luminal B HER2 positive; OVH, ovariohysterectomy; PR, progesterone receptor; TN basal, triple negative/basal like; TN, triple negative.
Concerning FA-SAT DNA copy number variation, a positive association with the lymphovascular invasion was verified, that is, the amplification of this satDNA positively relates with the presence of this cancer feature (p = 0.017, n = 26) (Fig. 2a, Table 1).
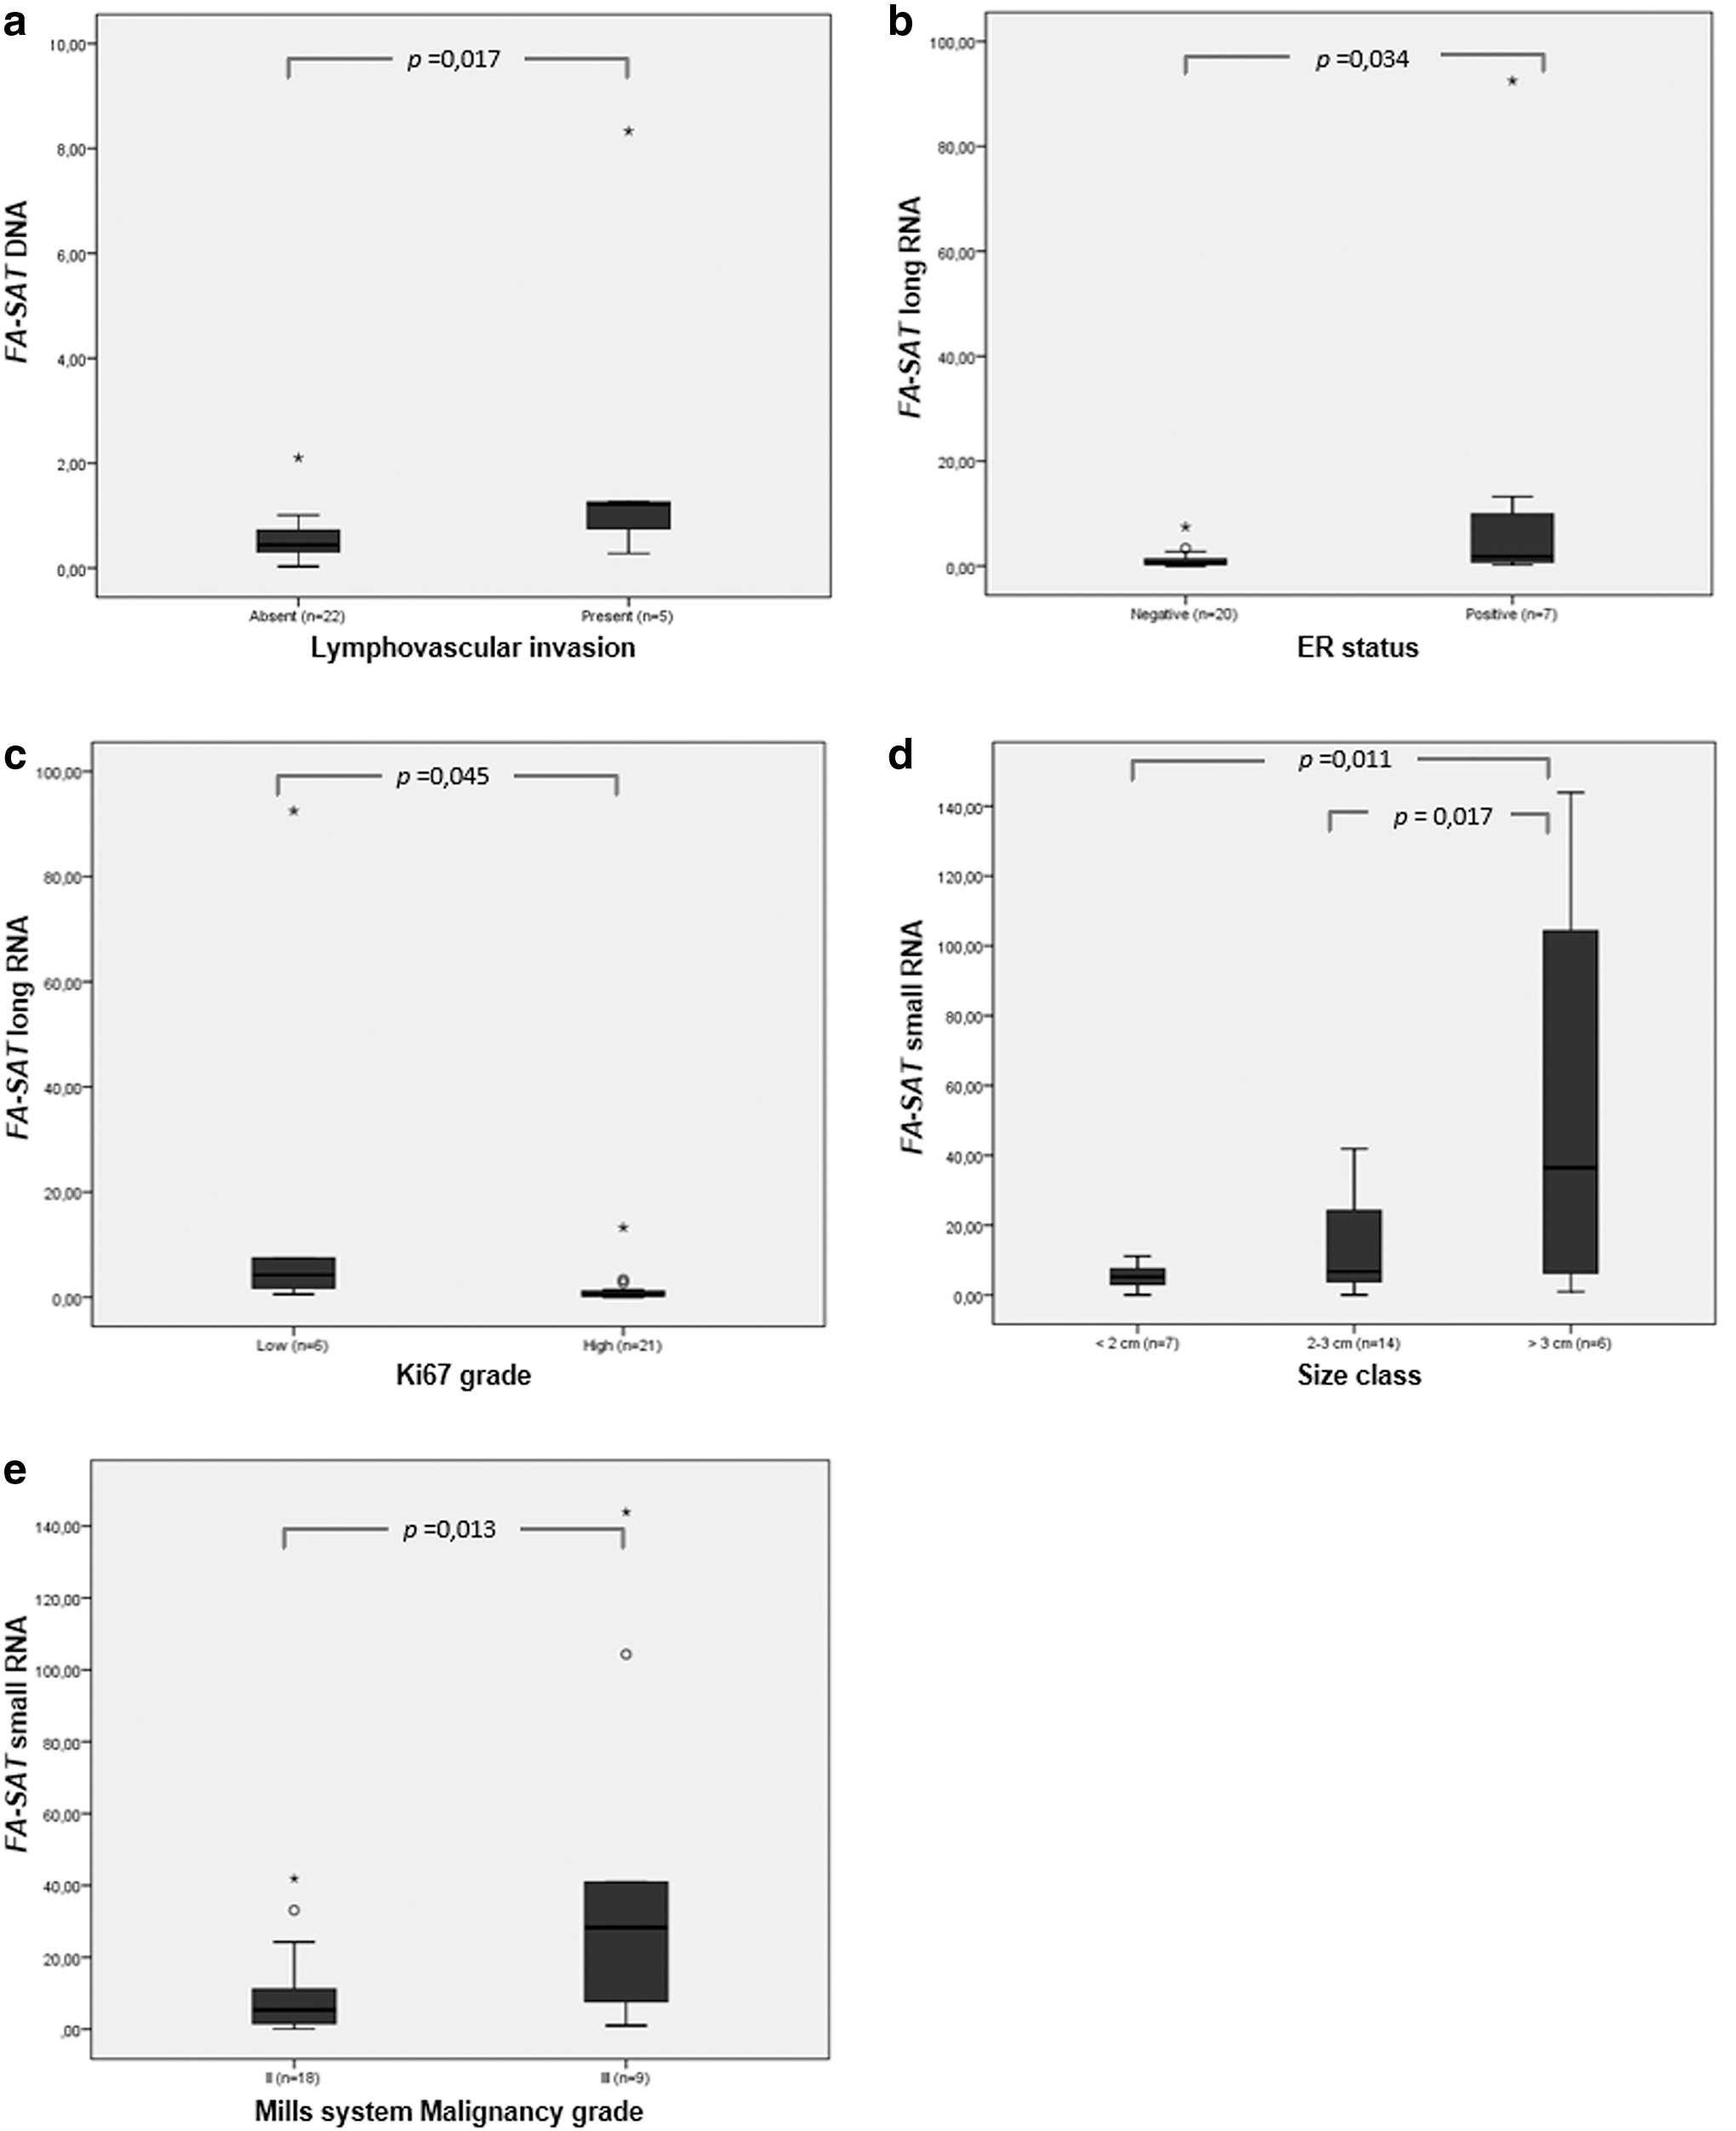
FA-SAT DNA and RNA relation with several clinicopathological parameters.
The analysis of the association of these parameters with FA-SAT long RNA levels revealed a negative association with the EE system (Elston and Ellis, 2002) malignancy grade (p < 0.001, n = 27) (Table 1). However, more samples displaying malignancy grade I and II should be included to further validate this association. The FA-SAT long RNA levels also showed correlation with the ER status (p = 0.045, n = 27) and ki67 index (p = 0.034, n = 27) (Fig. 2b, c, respectively, and Table 1). Indeed, an overexpression of FA-SAT long RNA was detected in the samples exhibiting the lower ki67 index and in the ones positive to the ER marker.
Finally, FA-SAT long RNA showed to be differentially expressed depending on the molecular classification of tumors (p < 0.001, n = 27) (Table 1). In fact, the tumor classified as LA (Luminal A) is the one showing the highest expression of FA-SAT. Also, the LBHER2 (Luminal B/HER2 positive) also showed to be overexpressing FA-SAT long RNA, while the triple negative (TN) presented underexpression. Notwithstanding, more tumor samples of each molecular classification must be included in this analysis to further realize if FA-SAT long RNA can be used for distinguishing different subtypes of mammary tumors.
Regarding FA-SAT small RNA, a significant positive association was found with the tumor size (Fig. 2d and Table 1) (p = 0.008, n = 27), being the transcripts' amount higher in larger tumors. The malignancy grade by the Mills system (published for FMTs (Dagher et al, 2019)) presented a positive association with the levels of FA-SAT small RNA (Fig. 2e and Table 1) (p = 0.013, n = 27). Also, the presence of skin ulceration (p = 0.014, n = 27) and the absence of OVH with mastectomy (p = 0.008, n = 12) seem to be related with the overexpression of small FA-SAT RNA (Table 1).
FA-SAT long RNA is related with c-MYC RNA levels in tumor cells
PKM2 is a moonlight protein (Harris et al, 2012; Tamada et al, 2012) with a protein kinase activity in c-MYC oncogene transcriptional complex (Yang et al, 2011; Yang et al, 2012a; Yang et al, 2012b). As FA-SAT ncRNA was previously related with PKM2 (as its interactor) and c-MYC (its silencing results in the decreased levels of this oncogene) (Ferreira et al, 2019a) and the RNA levels of these cancer-related genes were previously reported in this same panel of FMTs (Ferreira et al, 2019c), we decided to integrate all these data. When analyzing the categorized FA-SAT long RNA levels (if is increased, maintained, or decreased in tumor cells) with those of c-MYC RNA, a positive association was observed (p = 0.002, n = 26) (Fig. 3, Supplementary Table S5).
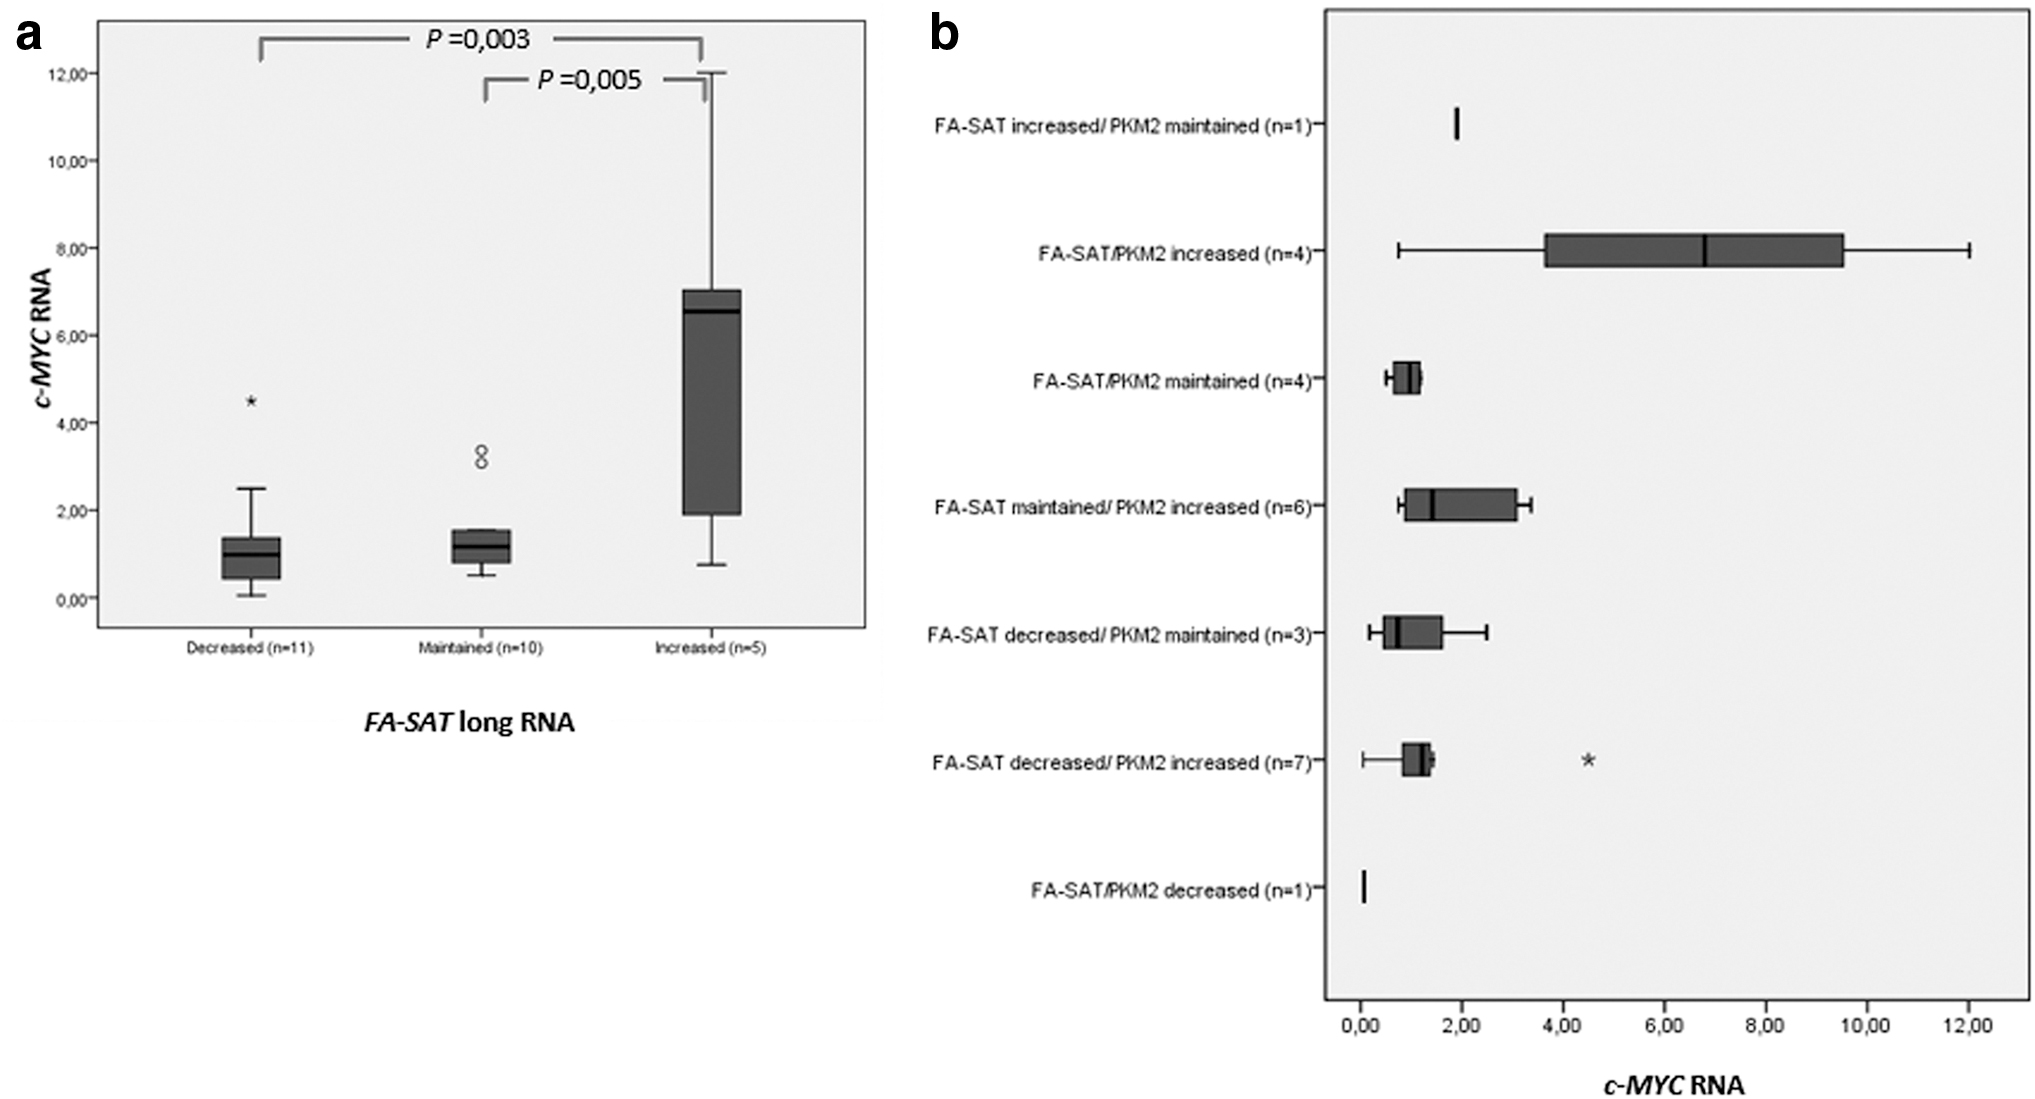
c-MYC relation with FA-SAT long RNA and FA-SAT RNA/PKM2 RNA.
Furthermore, as FA-SAT ncRNA complexes with PKM2 (Ferreira et al, 2019a), both transcripts, FA-SAT long RNA and PKM2 RNA, were also categorized in relation to each other (shown as FA-SAT RNA/PKM2 RNA) to analyze its possible influence on the expression of c-MYC and a positive association was, in fact, observed (p = 0.015, n = 26) (Fig. 3 and Supplementary Table S5). The samples presenting increased levels of both FA-SAT and PKM2 RNAs corresponded to the ones exhibiting c-MYC overexpression, with the opposite (its underexpression) also observed.
FA-SAT long RNA is correlated with ERBB2 and c-MYC RNA
As the ERBB2 DNA and RNA (Ferreira et al, 2019d) and c-MYC and PKM2 RNA levels (Ferreira et al, 2019c) were previously determined in this same set of FMTs, its possible correlation with FA-SAT levels was investigated. As it is possible to observe in the correlogram presented in Figure 4, FA-SAT DNA is highly and positively correlated with ERBB2 DNA (r = 0.9, p < 0.0001, n = 25). Regarding FA-SAT long RNA, this seems to be positively correlated with ERBB2 intracellular domain (ICD) (r = 0.60, p = 0.0004, n = 27) and extracellular domain (ECD) RNA (r = 0.63, p = 0.0008, n = 27) and c-MYC RNA (r = 0.66, p = 0.0003, n = 26).
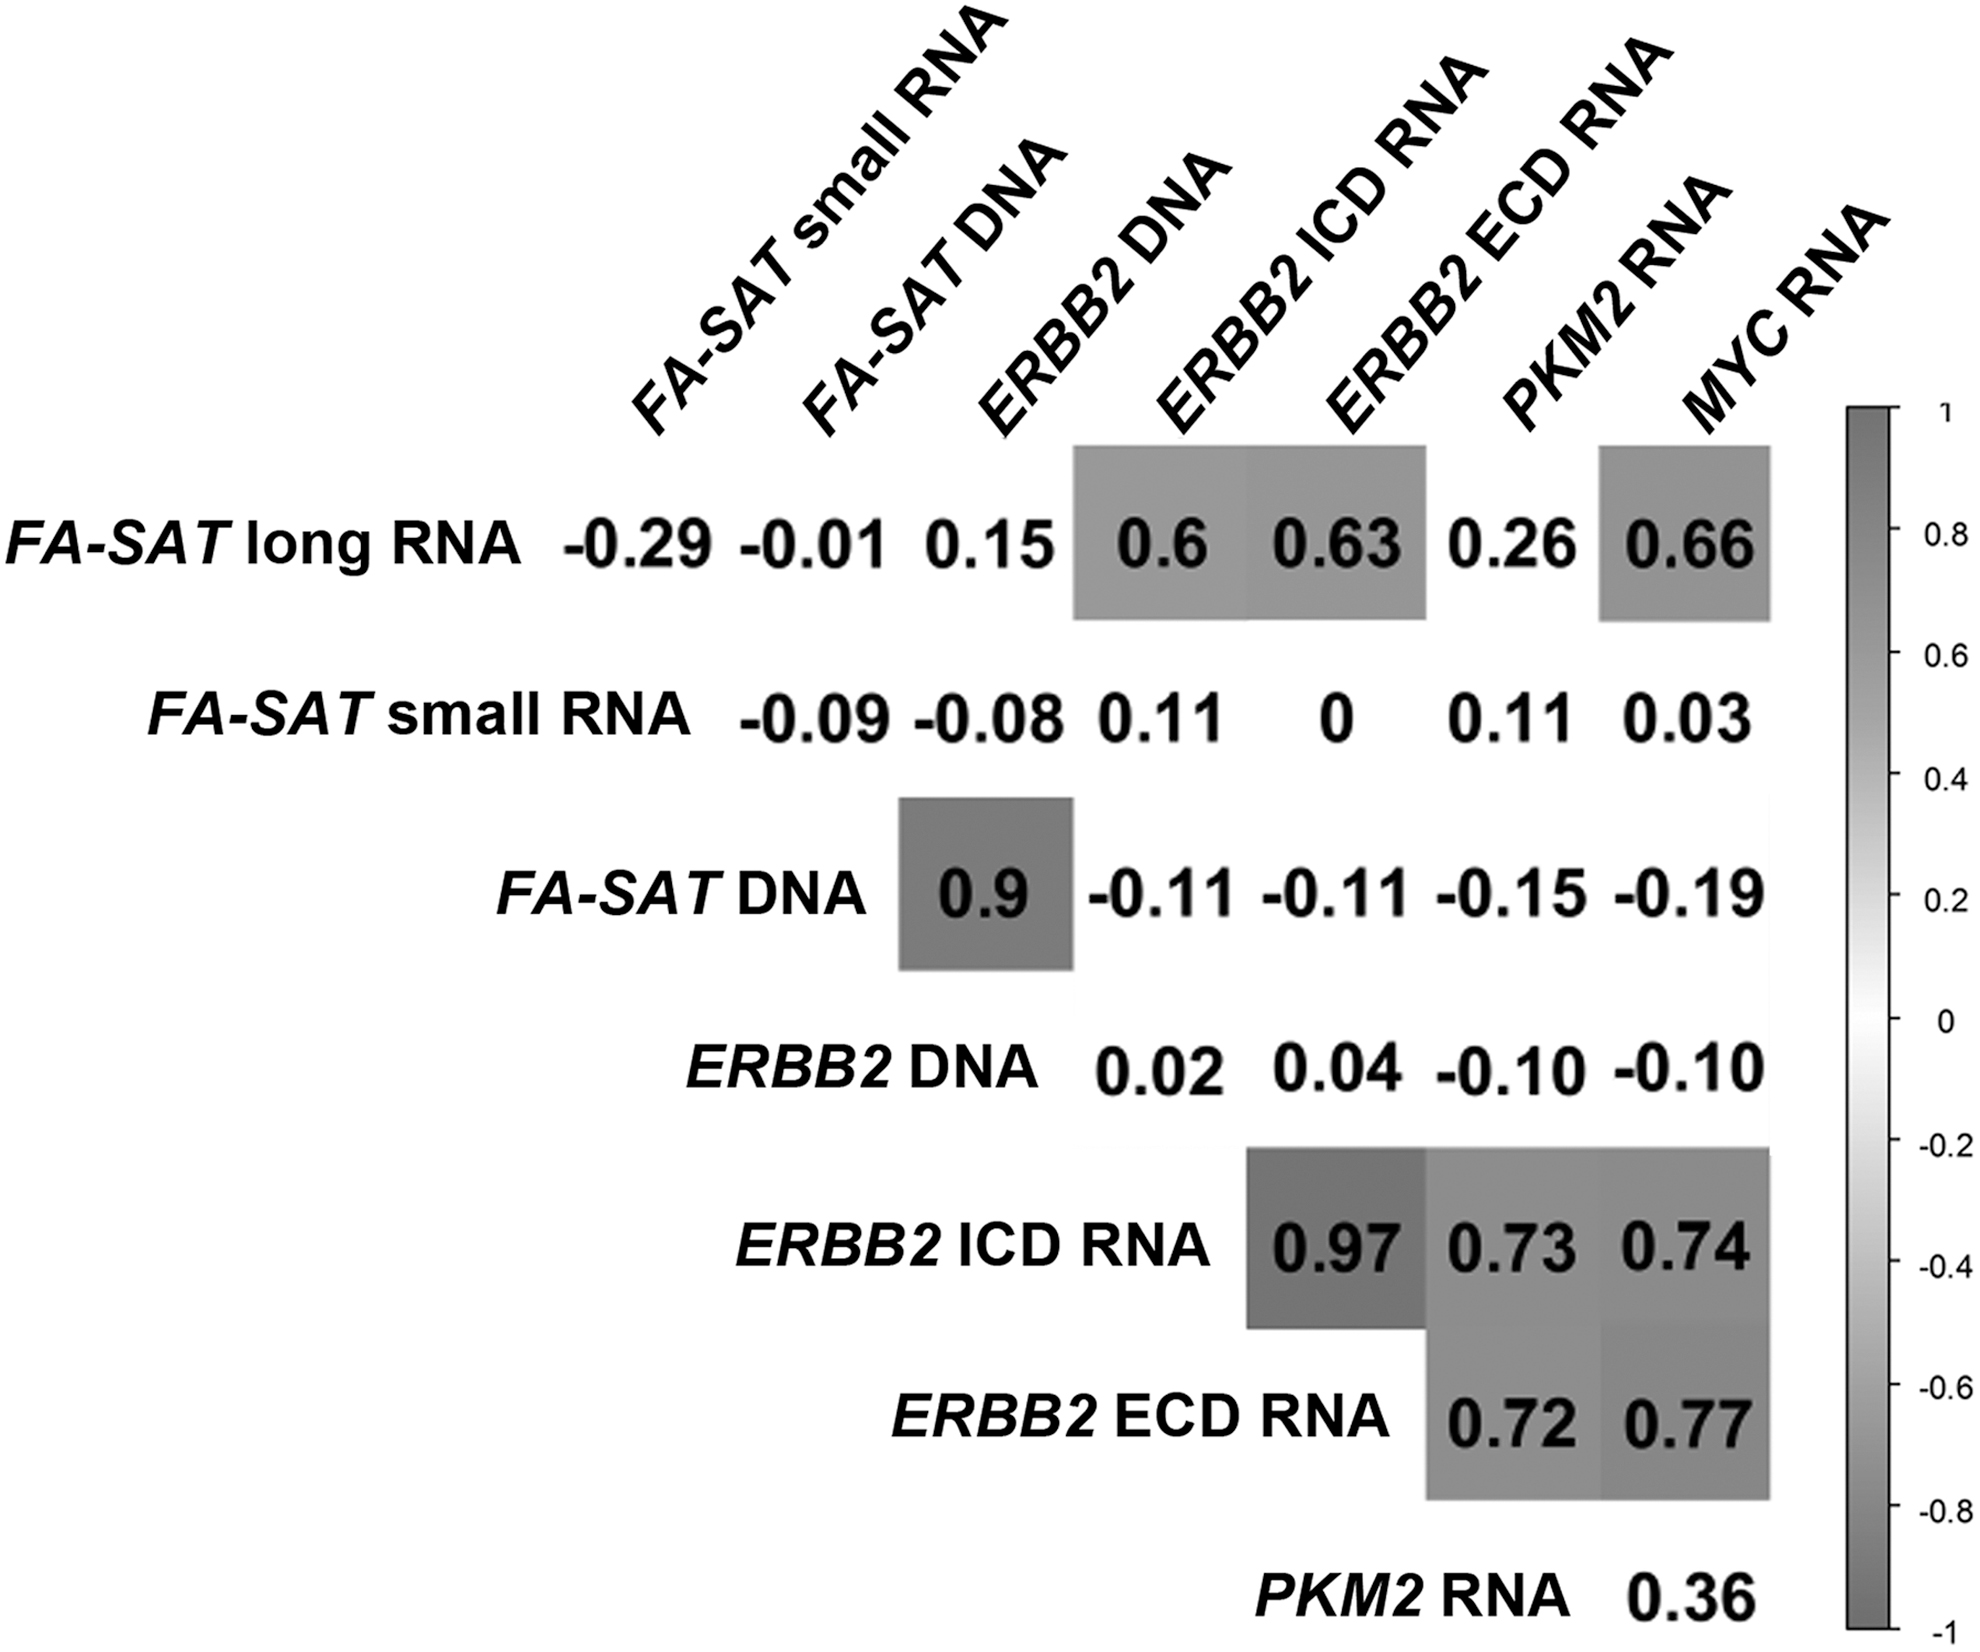
FA-SAT DNA and RNA correlation analysis. Correlation among FA-SAT DNA and RNAs (long and small) with ERBB2 (DNA and ICD and ECD RNA), PKM2, and c-MYC RNAs. This correlogram was obtained using the R software. As some sets of FMT present a different “n,” the data were simultaneously analyzed in GraphPad software and the r-values were substituted/corrected by the GraphPad values. ECD, extracellular domain; ICD, intracellular domain.
Discussion
Many studies have shown the importance of satncRNAs in tumorigenesis. However, its value as cancer biomarkers has been neglected, with few works describing a putative use of satncRNAs in the diagnosis or prognosis and even as suitable molecules for targeting therapy (Ferreira et al, 2015). FA-SAT ncRNAs are present in the cat genome, and although the number of transcripts is higher in this species when compared with human (Chaves et al, 2017), these molecules display the same function in both genomes (Ferreira et al, 2019a).
In this work, we inspected the FA-SAT status in a collection of FMTs to evaluate its potential as cancer biomarker. FA-SAT DNA and RNAs (long and small) were quantified in 27 FMTs, always using the DFT from the same animal, as reference. In line with personalized health care and therapy thinking, the use of the tumor and DFT samples from the same patient provides a more accurate and realistic scenario.
The quantification of FA-SAT DNA showed that it is not amplified in the great majority of tumors analyzed. This is a different scenario from other satDNAs (Bersani et al, 2015; Savelyeva et al, 1994) or even with FA-SAT DNA in other studies (Ferreira et al, 2019b; Santos et al, 2006), which presents amplification. The scrutiny of FA-SAT DNA association with clinicopathological parameters revealed a positive association with the existence of lymphovascular invasion. The presence of this type of invasion in animals with mammary tumors is indicative of a poor prognosis, presenting a lower overall survival (Deger et al, 2015; Liu et al, 2016; Song et al, 2011).
In the future, the analysis of FA-SAT DNA levels in cfDNA (cell-free DNA) samples from animals with and without tumors will be an interesting approach, which can give us new data about the influence of this satDNA in tumorigenesis. Many authors revealed the presence of different satDNA in cfDNA from patients with different types of cancer (reviewed in Ugarković et al [2022]). Furthermore, our preliminary data showed the presence of FA-SAT DNA in human cell-free DNA samples (cell-free DNA extracted from blood of healthy donors). These studies should be extended to human samples of cfDNA from cancer patients.
Our data also revealed a strong correlation between levels of FA-SAT DNA and the cancer biomarker ERBB2 DNA (Ferreira et al, 2019d). ERBB2 DNA amplification in mammary tumors is a determinant for poor prognosis, presenting these individuals less overall survival (Iqbal and Iqbal, 2014; Peiro et al, 2007; Slamon et al, 1987). However, how the FA-SAT DNA is highly correlated with ERBB2 DNA is a question that remains unanswered.
When analyzing the transcription of this satDNA, most FMTs presented a decrease or maintenance of FA-SAT long transcripts, but the contrary was observed regarding FA-SAT small RNAs, which were increased, corroborating previous observations in a feline mammary tumor cell line (FkMTp) (Ferreira et al, 2019b). The accumulation of these small transcripts in the tumor cells led us to hypothesize that they may result from the processing or turnover of longer transcripts, as suggested in a prior study (Ferreira et al, 2019b). Furthermore, it was also verified that the amplification of FA-SAT DNA is not related with its overexpression, these results are in accordance with previously described data (Ferreira et al, 2019b).
The analysis of FA-SAT long RNA correlation with the clinicopathological data revealed some interesting findings. The long transcripts of this satncRNA are negatively correlated with the malignancy grade (using the EE grading system). The samples presenting the lower malignancy grade (I and II) are the ones presenting the higher values of FA-SAT long RNA levels. However, it should be noted that the majority of tumors analyzed in this work showed high malignancy grade, as FMTs are frequently aggressive. Also, FA-SAT long RNA is overexpressed in tumors exhibiting a low Ki-67 index and a positive ER status. In fact, the relation between the Ki-67 index and ER status is inverse in these tumors, what has also been described by other authors (Nishimura et al, 2010; Wiesner et al, 2009). Moreover, the Ki-67 index has been positively correlated with high grades of malignancy, indicating poor prognosis (Nishimura et al, 2010).
Moreover, FA-SAT long RNA also showed to be associated with the molecular classification of tumors, with the Luminal A tumor showing the higher FA-SAT overexpression. In other reports, this type of tumor showed low Ki-67 indexes (Nishimura et al, 2010; Soliman and Yussif, 2016) and a good prognosis (Soliman and Yussif, 2016), which is in accordance with our data. Furthermore, increased FA-SAT long RNA levels were also detected in the LBHER2 (Luminal B HER2). The TN tumors are the ones showing underexpression of FA-SAT long RNA. This can mean that the quantification of this satncRNA may be useful to differentiate ambiguous results in the molecular classification of tumors. These data, together with the malignancy grade association, suggest that the overexpression of FA-SAT long RNA could be a good prognostic marker.
FA-SAT long RNA was shown to be positively correlated with ERBB2 ICD and ECD RNA (Ferreira et al, 2019d). ERBB2 overexpression was previously associated, by some authors, with a bad clinical outcome (De Maria et al, 2005; Iqbal and Iqbal, 2014; Peiro et al, 2007); however, Santos et al. (2013) showed that the overexpression of ERBB2 in FMTs is correlated with a better clinical outcome. Furthermore, as FA-SAT long RNA is negatively associated with the malignancy grade, and positively correlated with ERBB2 RNA levels, our results are in accordance with the ones described by Santos and colleagues (Santos et al, 2013).
These data may be a starting point to use the quantification of this satncRNA as a co-adjuvant marker in clinical molecular classification or a prognostic factor due to its correlation with the ERBB2 status. Regarding the analysis with c-MYC RNA levels (Ferreira et al, 2019c), a positive correlation with FA-SAT long RNA was obtained. Also, the categorized levels of FA-SAT RNA/PKM2 RNAs allowed to verify that the increase of both RNAs corresponded to the tumors showing a higher amount of c-MYC transcripts, with the reverse also observed. Thus, the tumors exhibiting underexpression of FA-SAT long RNA, which are correlated with lower ERBB2 and c-MYC RNA levels, present a worse clinical outcome than the tumors with overexpression.
In regard to FA-SAT small RNA and the clinicopathological features, an association was found between this satncRNA and the size of the tumor, overexpressed in larger tumors. If the FA-SAT small RNA is in fact the result of the processing or turnover of longer transcripts, this means that the larger the tumor, the more FA-SAT RNA processing or turnover occurs. Moreover, its overexpression is also positively related with the presence of skin ulceration, absence of OVH with mastectomy, and malignancy grade (by Mills grading system).
Integrating all these data, it is possible to conclude that FA-SAT RNA, more specifically, its longer transcripts, may be a potential cancer biomarker due to its association with clinical tumor parameters and with the transcription of proto-oncogenes as ERBB2 and c-MYC. Moreover, FA-SAT long ncRNA levels may be a malignancy grade indicator, being a putative biomarker for cancer prognosis. Considering the value of FMT as a model for breast cancer research together with the fact of FA-SAT be highly conserved regarding its sequence and function in cat and human species, our results deserve to be validated in future studies in human breast cancer.
The satncRNA role in tumorigenesis and its real value as cancer biomarkers have been neglected by the scientific community over the years. In this study, we presented, for the first time, a highly conserved satncRNA as a potential cancer biomarker—FA-SAT ncRNA. Also, the correlation with an important cancer biomarker like ERBB2 highlights its influence in tumorigenesis. These findings are not only significant for FMT research and future clinical application but also pave the way toward further studies of FA-SAT in human cancers for its use as diagnostic, prognostic, or monitoring biomarkers. We hope that this may lead to novel parameters in diagnosis and treatment strategies. As we know more about tumorigenesis, cancer cellular pathways and their key players, we will be able to design new approaches and treatments to fight this disease.
Footnotes
Acknowledgments
This work is not published previously in any journal or in any other format, except the PhD thesis of Dr. Daniela Ferreira at University of Trás-os-Montes and Alto Douro.
Authors' Contributions
Conceptualization, R.C.; methodology, all the authors; validation, D.F. and R.C.; formal analysis, D.F.; investigation, all the authors; resources, F.F. and R.C.; data curation, D.F. and M.S.; writing—original draft preparation, D.F.; writing—review and editing, M.S., J.C., F.A., F.F., and R.C.; supervision, R.C.; and project administration and funding acquisition, R.C.
Author Disclosure Statement
The authors declare they have no conflicting financial interests.
Funding Information
This work was funded by the PulmaGENE project, reference no. NORTE-01-0247-FEDER-033533, financed by the European Regional Development Fund (ERDF) through NORTE 2020 (Regional Operational Programme North 2014–2020) and LISBOA 2020 (Lisboa Operational Programme 2014–2020). The authors are grateful for the support of BioISI projects (reference nos. UIDP/04046/2020 e UIDB/04046/2020), financed from the Science and Technology Foundation (FCT) of Portugal.
Abbreviations Used
References
Supplementary Material
Please find the following supplemental material available below.
For Open Access articles published under a Creative Commons License, all supplemental material carries the same license as the article it is associated with.
For non-Open Access articles published, all supplemental material carries a non-exclusive license, and permission requests for re-use of supplemental material or any part of supplemental material shall be sent directly to the copyright owner as specified in the copyright notice associated with the article.