




Abstract
For precision in clinical oncology practice, detection of tumor-derived peptides and proteins in urine offers an attractive and noninvasive alternative for diagnostic or screening purposes. In this study, we report comparative quantitative proteomic profiling of urine samples from patients with gastric cancer and healthy controls using tandem mass tags-based multiplexed mass spectrometry approach. We identified 1504 proteins, of which 246 were differentially expressed in gastric cancer cases. Notably, ephrin A1 (EFNA1), pepsinogen A3 (PGA3), sortilin 1 (SORT1), and vitronectin (VTN) were among the upregulated proteins, which are known to play crucial roles in the progression of gastric cancer. We also found other overexpressed proteins, including shisa family member 5 (SHISA5), mucin like 1 (MUCL1), and leukocyte cell derived chemotaxin 2 (LECT2), which had not previously been linked to gastric cancer. Using a novel approach for targeted proteomics, SureQuant, we validated changes in abundance of a subset of proteins discovered in this study. We confirmed the overexpression of vitronectin and sortilin 1 in an independent set of urine samples. Altogether, this study provides molecular candidates for biomarker development in gastric cancer, and the findings also support the promise of urinary proteomics for noninvasive diagnostics and personalized/precision medicine in the oncology clinic.
Introduction
Gastric cancer is one of the salient life-threatening diseases with the annual incidence of over 1 million (Sung et al., 2021). It is the fifth most common malignancy and fourth leading cause of cancer-related deaths worldwide (Sung et al., 2021). The incidence of gastric cancer is higher in Asian countries like China, India, and Japan (Sung et al., 2021). Gastric cancer is influenced by various risk factors, including diet, age, smoking, alcohol consumption, family history of gastric cancer, exposure to cement, and mineral dust (Yusefi et al., 2018).
Detecting gastric cancer at an early stage is challenging as it is asymptomatic and often detected at the advanced stages. Among the many approaches to diagnose gastric cancer, endoscopy with pathological interpretation from biopsy is the current gold standard detection test. It is not only invasive but also unsuitable for mass screening. In such a case, therefore, it is necessary to develop a noninvasive diagnostic test for gastric cancer, which can be used for mass screening in a larger population.
Biofluids such as serum, plasma, and gastric juice have been used so far to identify the potential biomarkers for detection of gastric cancer (Huang et al., 2021; Subbannayya et al., 2015; Zhou et al., 2020). Numerous diagnostic and prognostic biomarkers in gastric cancer have been proposed and the blood-based markers that are commonly used in clinical setup include carbohydrate antigen (CA)19-9, carcinoembryonic antigens, and CA72-4 (Herrera-Pariente et al., 2021; Ishigami et al., 2001; Matsuoka and Yashiro, 2018; Yin et al., 2015). Other protein biomarkers like trefoil factor 3 (TFF3), vascular endothelial growth factor (VEGF), metalloproteinase domain-containing protein 8 (ADAM8), and serum pepsinogen Ⅰ and II (PGI, PGII) have demonstrated the potential for screening gastric cancer (Aikou et al., 2011; Miki, 2006; Tong et al., 2016).
Although serum and plasma have emerged as a good source for promising novel and minimally invasive markers for various diseases, they have complex proteomes and require laborious sample preparation techniques (Luque-Garcia and Neubert, 2007). In addition to serum and plasma, urine is another biospecimen that has been used to study the biomarkers for the diagnosis of diseases, including cancer (Arnaudova and Romansky, 1989; Fernandez et al., 2005; Han et al., 2005). Urine as a noninvasive source, is advantageous for disease marker discovery due to its easy accessibility and potential for repeat sampling in unlimited volumes. With its less complex protein content than serum or plasma, urine is a convenient specimen for clinical research (Kalantari et al., 2015).
Our group has previously carried out a comprehensive study on human urinary proteome and reported 1823 proteins in normal human urine (Marimuthu et al., 2011). Urinary proteomics has been performed in many disease conditions like diabetic nephropathy, kidney disorders, and urinary tract infections (Lee and Choi, 2015; Vitko et al., 2020). Furthermore, there are Food and Drug Administration (FDA)-approved urine-based biomarker assays for the diagnosis and surveillance of bladder cancer, which include nuclear matrix protein 22 (NMP22) and bladder tumor antigen assay (BTA) (Sugeeta et al., 2021). Urinary protein biomarkers have also been reported in kidney cancer, endometrial cancer, and prostate cancer, among others (Morrissey et al., 2010; Njoku et al., 2020; Schiffer et al., 2012).
Mass spectrometry has been used to identify differentially expressed proteins from tumor tissues, serum, plasma, and gastric juice in gastric cancer. Li et al. (2021) demonstrated the association of four proteins pepsinogen C, hemopexin, NAD(P)H-hydrate epimerase, and D-dopachrome tautomerase with the risk of gastric lesion progression using mass spectrometry and validated their findings based on immunohistochemistry and The Cancer Genome Atlas data. In another study, the authors reported increased expression of proteins like integrin alpha-4 (ITGA4), aromatic-L-amino-acid decarboxylase (DDC), and carnitine O-palmitoyltransferase 1 (CPT1A), which are strongly associated with the development and progression of gastric cancer and are potential diagnostic markers (Dhondrup et al., 2022).
Recently, our team employed mass spectrometry-based approach to demonstrate distinctive proteomic signatures, which included gremlin1 (GREM1), bcl-2-associated athanogene 2 (BAG2), olfactomedin 4 (OLFM4), thyroid hormone receptor-interacting protein 6 (TRIP6), and melanoma-associated antigen 9 (MAGE-A9), between diffuse and intestinal subtypes of gastric cancer and were further validated using IHC (Singh et al., 2021). Most of these studies have used tumor tissue samples and/or serum for the proteomics analysis. To the best of our knowledge, there are limited studies that have elucidated protein markers associated with gastric cancer in urine.
In this study, we carried out a mass spectrometry-based proteomic analysis of urine from patients with gastric cancer for identification of novel noninvasive biomarkers. We performed tandem mass tags (TMT) 10-plex labeling for multiplexing of urine samples from control and gastric cancer groups. This comparative analysis of urine samples revealed significant changes at the proteomic level. We validated a subset of proteins by deploying SureQuant, a recently developed targeted mass spectrometry approach. We believe that identifying urine-based proteomic signatures associated with gastric cancer will provide significant boost in screening general population for gastric cancer.
Materials and Methods
Samples
The urine samples from gastric cancer patients (n = 5) and apparently healthy controls (n = 5) were recruited from the study site at the Kidwai Memorial Institute of Oncology, Bangalore. The study was approved by the Institutional Review Board and Medical Ethics Committee of Kidwai Memorial Institute of Oncology, Bangalore, India (KMIO/MEC/021/24). A written informed consent was obtained from all individuals. The study was conducted according to the guidelines of the Declaration of Helsinki. The diagnosis of gastric cancer and the healthy control status were ascertained through patient history, basic laboratory testing, and clinical examination by a physician at Kidwai Memorial Institute of Oncology, Bangalore, India.
The discovery set included five gastric cancer patients (diagnosed with grade 3 adenocarcinoma) and five healthy control individuals with age ranging from 40 to 60 years. The validation set included 19 urine samples from gastric cancer patients (diagnosed with grade 2 or grade 3 adenocarcinoma) and 12 urine samples from healthy controls with age ranging between 30 and 60 years. The urine samples were collected from patients with gastric cancer before any chemotherapy. The demographic details of patients and controls included in the study are shown in Supplementary Table S1.
Thirty to 50 mL of urine was collected from each patient as well as healthy individuals. Samples were immediately kept on ice and transported to the laboratory for further processing. These urine samples were then centrifuged at 1500 g for 10 min at 4°C. The supernatant was filtered using 0.22 μm filter (Millipore, Billerica, MA). Thirty milliliters of filtered urine was concentrated using 3 KDa cutoff filters (Millipore, Billerica, MA). The retentate (concentrated urine) was stored immediately at −80°C until further use.
Sample preparation for quantitative proteomics
The protein concentration of concentrated urine samples was estimated using bicinchoninic acid protein estimation kit (Thermo Scientific Pierce). An aliquot of 250 μg of protein from each sample was taken for further proteomic sample preparation. Samples were then reduced using 5 mM dithiothreitol at 60°C for 30 min followed by alkylation using 10 mM iodoacetamide for 30 min in dark at room temperature. Digestion of proteins was carried out by treating samples with Promega Lys-C (Mass Spec Grade) in the ratio of 1:50 (enzyme: protein) and samples were incubated at 37°C for 4 h. This was followed by digestion with Sequencing Grade Trypsin (Promega) in the ratio of 1:20 (enzyme: protein) and incubating the samples at 37°C overnight. Samples were then acidified by 1% formic acid (FA) and desalted using Sep-Pak C18 Cartridges (Waters). Eluted samples were dried under vacuum and then stored at −20°C until further use.
All dried samples were reconstituted in 100 μL of 100 mM TEAB (Triethyl Ammonium Bicarbonate) and the peptide amount was estimated using Pierce Quantitative Colorimetric Peptide Assay (Thermo Scientific) kit. Equal peptide amount (∼100 μg) from each sample was labeled using TMT 10-plex (TMT) as per the manufacturer's instructions (Catalog no. 90110; Thermo Fisher Scientific). Briefly, the equal amounts of peptides from each sample were aliquoted and labeled separately with the TMT 10-plex labels in the ratio of 1:2 (peptide: label).
The labeling reaction mixture was incubated at room temperature for an hour and quenched using 8 μL of 5% hydroxylamine solution with incubation for 15 min at room temperature before pooling. The pooled labeled sample was dried using speed vac and fractionated into 24 fractions using basic pH reversed-phase liquid chromatography. The fractions obtained were desalted using C18 stage tips and dried under vacuum. Samples were stored at −80°C until further analysis.
Liquid chromatography-mass spectrometry (MS)/MS analysis
Proteomic data acquisition for 24 fractions of urine samples was carried out on Thermo Scientific Orbitrap Fusion Tribrid mass spectrometer (Thermo Fisher Scientific, Bremen, Germany) interfaced with Thermo Scientific EASY-nLC 1000 (Thermo Fisher Scientific). Peptides were reconstituted in 0.1% FA and loaded on to a trap column (Thermo Scientific Acclaim PepMap 100 C18 LC Column, 75 μm × 2 cm). Peptides were then resolved on an analytical column at a flow rate of 300 nL/min using an optimized linear gradient of 8–90% acetonitrile over 90 min.
Mass spectrometry analysis was carried out in a data-dependent mode from 350 to 1600 m/z range with full scans acquired using orbitrap mass analyzer at a mass resolution of 120,000 at 200 m/z. The automatic gain control (AGC) target for precursor ion acquisition was set as 4 × 10⁵ and ion filling time set to 50 ms. Top 15 most intense precursor ions from a survey scan were selected for fragmentation using higher-energy collision dissociation with 34% normalized collision energy and detected at a mass resolution of 50,000 at m/z 200. The AGC target for mass spectrometry (MS)/MS was set as 1 × 10⁵ and ion filling time set to 100 ms. The ions selected for fragmentation were excluded for 30 sec.
Data analysis
The MS/MS raw data were analyzed using Sequest search algorithm in Proteome Discoverer 2.1 (Thermo Fisher Scientific) against Human RefSeq protein database (Ver. 89). The workflow used for the searches included spectrum selector, SEQUEST search nodes, and peptide validator. The search parameters included carbamidomethylation at cysteine residues (+57.021 Da), TMT 10-plex (+229.163 Da) modification at N-terminus of peptide, and C-terminus of lysine as fixed modifications, while oxidation of methionine (+15.995 Da) was set as a dynamic modification.
MS and MS/MS mass tolerances were set to 10 ppm and 0.05 Da, respectively. Trypsin was specified as protease and a maximum of two missed cleavage were allowed. A false discovery rate (FDR) of 1% was applied as a cutoff value for reporting identified peptides. To determine the differentially expressed proteins in gastric cancer, we carried out two sample t-test using Perseus software at the significance level of ≤0.05. The fold change cutoff of 1.5 was applied to the proteomic data. Significantly dysregulated proteins were considered for further data analysis.
Bioinformatics analysis
To assess the functional profile of differentially expressed proteins, gene ontology and functional enrichment analysis was performed using DAVID (https://david.ncifcrf.gov/) online tool. Various biological processes and cellular components were enriched in the analysis. To evaluate the translocation of proteins, we carried out the signal peptide and transmembrane domain analysis for the dysregulated proteins using SignalP and TransMembrane prediction tools using Hidden Markov Models, respectively.
Peptide synthesis for targeted analysis
After analyzing the discovery data set, 19 potential proteins were selected for validation, which showed significant overexpression in gastric cancer in our TMT-10 plex experiment. Thirty isotope-labeled peptides were synthesized for use as internal standards (ISs) corresponding to 19 proteins for targeted quantitative analysis. These peptides were synthesized using fluorenylmethoxycarbonyl protecting group (FMOC) solid-phase technology with the following specifications: Crude purity and synthetic isotope-labeled c-terminal lysine (K) or arginine (R). The crude peptides after synthesis were dissolved in 0.1% FA in 30% (v/v) acetonitrile/water and stored at −20°C. Each heavy isotope-labeled peptide was resuspended in 0.1% FA and subjected to nano-liquid chromatography (LC)/MS-MS analysis in data-dependent mode to determine the intensity response of 30 peptides. A final heavy peptide mixture was prepared by increasing the concentration of the low-intensity heavy peptides in the mixture before injecting and spiking into the samples.
Targeted mass spectrometry of selected peptides
Targeted mass spectrometry analysis in SureQuant mode was carried out for 31 urine samples (19 gastric cancer and 12 control samples), which were processed in similar manner up to trypsin digestion, as described above for data-dependent acquisition analysis. These samples were analyzed on an Orbitrap Eclipse mass spectrometer (Thermo Scientific) coupled to UltiMate 3000 RSLC Nano LC system (Dionex).
An injection of 1 μg peptide digest of urine sample spiked in with heavy isotope-labeled peptides was loaded onto a 15 cm column (Pepsep) with a column oven temperature of 50°C. Peptides were eluted at a flow rate of 500 nL/min across a linear gradient consisting of 0.1% FA (buffer A) and 100% acetonitrile in 0.1% FA (buffer B). The gradient was as follows: 5–35% B from 4 to 40 min, 35–90% B from 40–45 min and maintained at 90% for the next 5 min, and changed to 3% B for column equilibration for 10 min.
Peak area of endogenous peptides and corresponding heavy IS peptides was exported from Skyline, and peptides were filtered according to the following criteria: First, only IS peptides with an integrated peak area >0 for n ≥ 5 product ions were considered. Of these remaining targets, only endogenous targets with an integrated peak area >0 for n ≥ 3 product ions were considered. For quantification, the peak area values of the three product ions present for both the light/heavy peptides were summed, and the ratio of endogenous to heavy IS peptide signal was taken across samples. Student t-test was done to calculate the p-value of proteins in SureQuant analysis.
Performance assessment using receiver operating characteristic analysis
Receiver operating characteristic (ROC) curve was generated to assess the performance of the potential protein candidate(s) from SureQuant analysis. Individual and paired ROC curves were plotted and area under the curve (AUC) was calculated using the pROC package in R (Robin et al., 2011).
Data availability
The mass spectrometry proteomics data have been deposited to the Proteome Xchange Consortium using the PRIDE partner repository with the dataset identifier: PXD040956.
Results and Discussion
We carried out TMT-based quantitative proteomic profiling to compare the expression of proteins in the urine from gastric cancer patients and age- and sex-matched control individuals without a diagnosis of any cancer. The workflow deployed for proteomic analysis is illustrated in Figure 1.
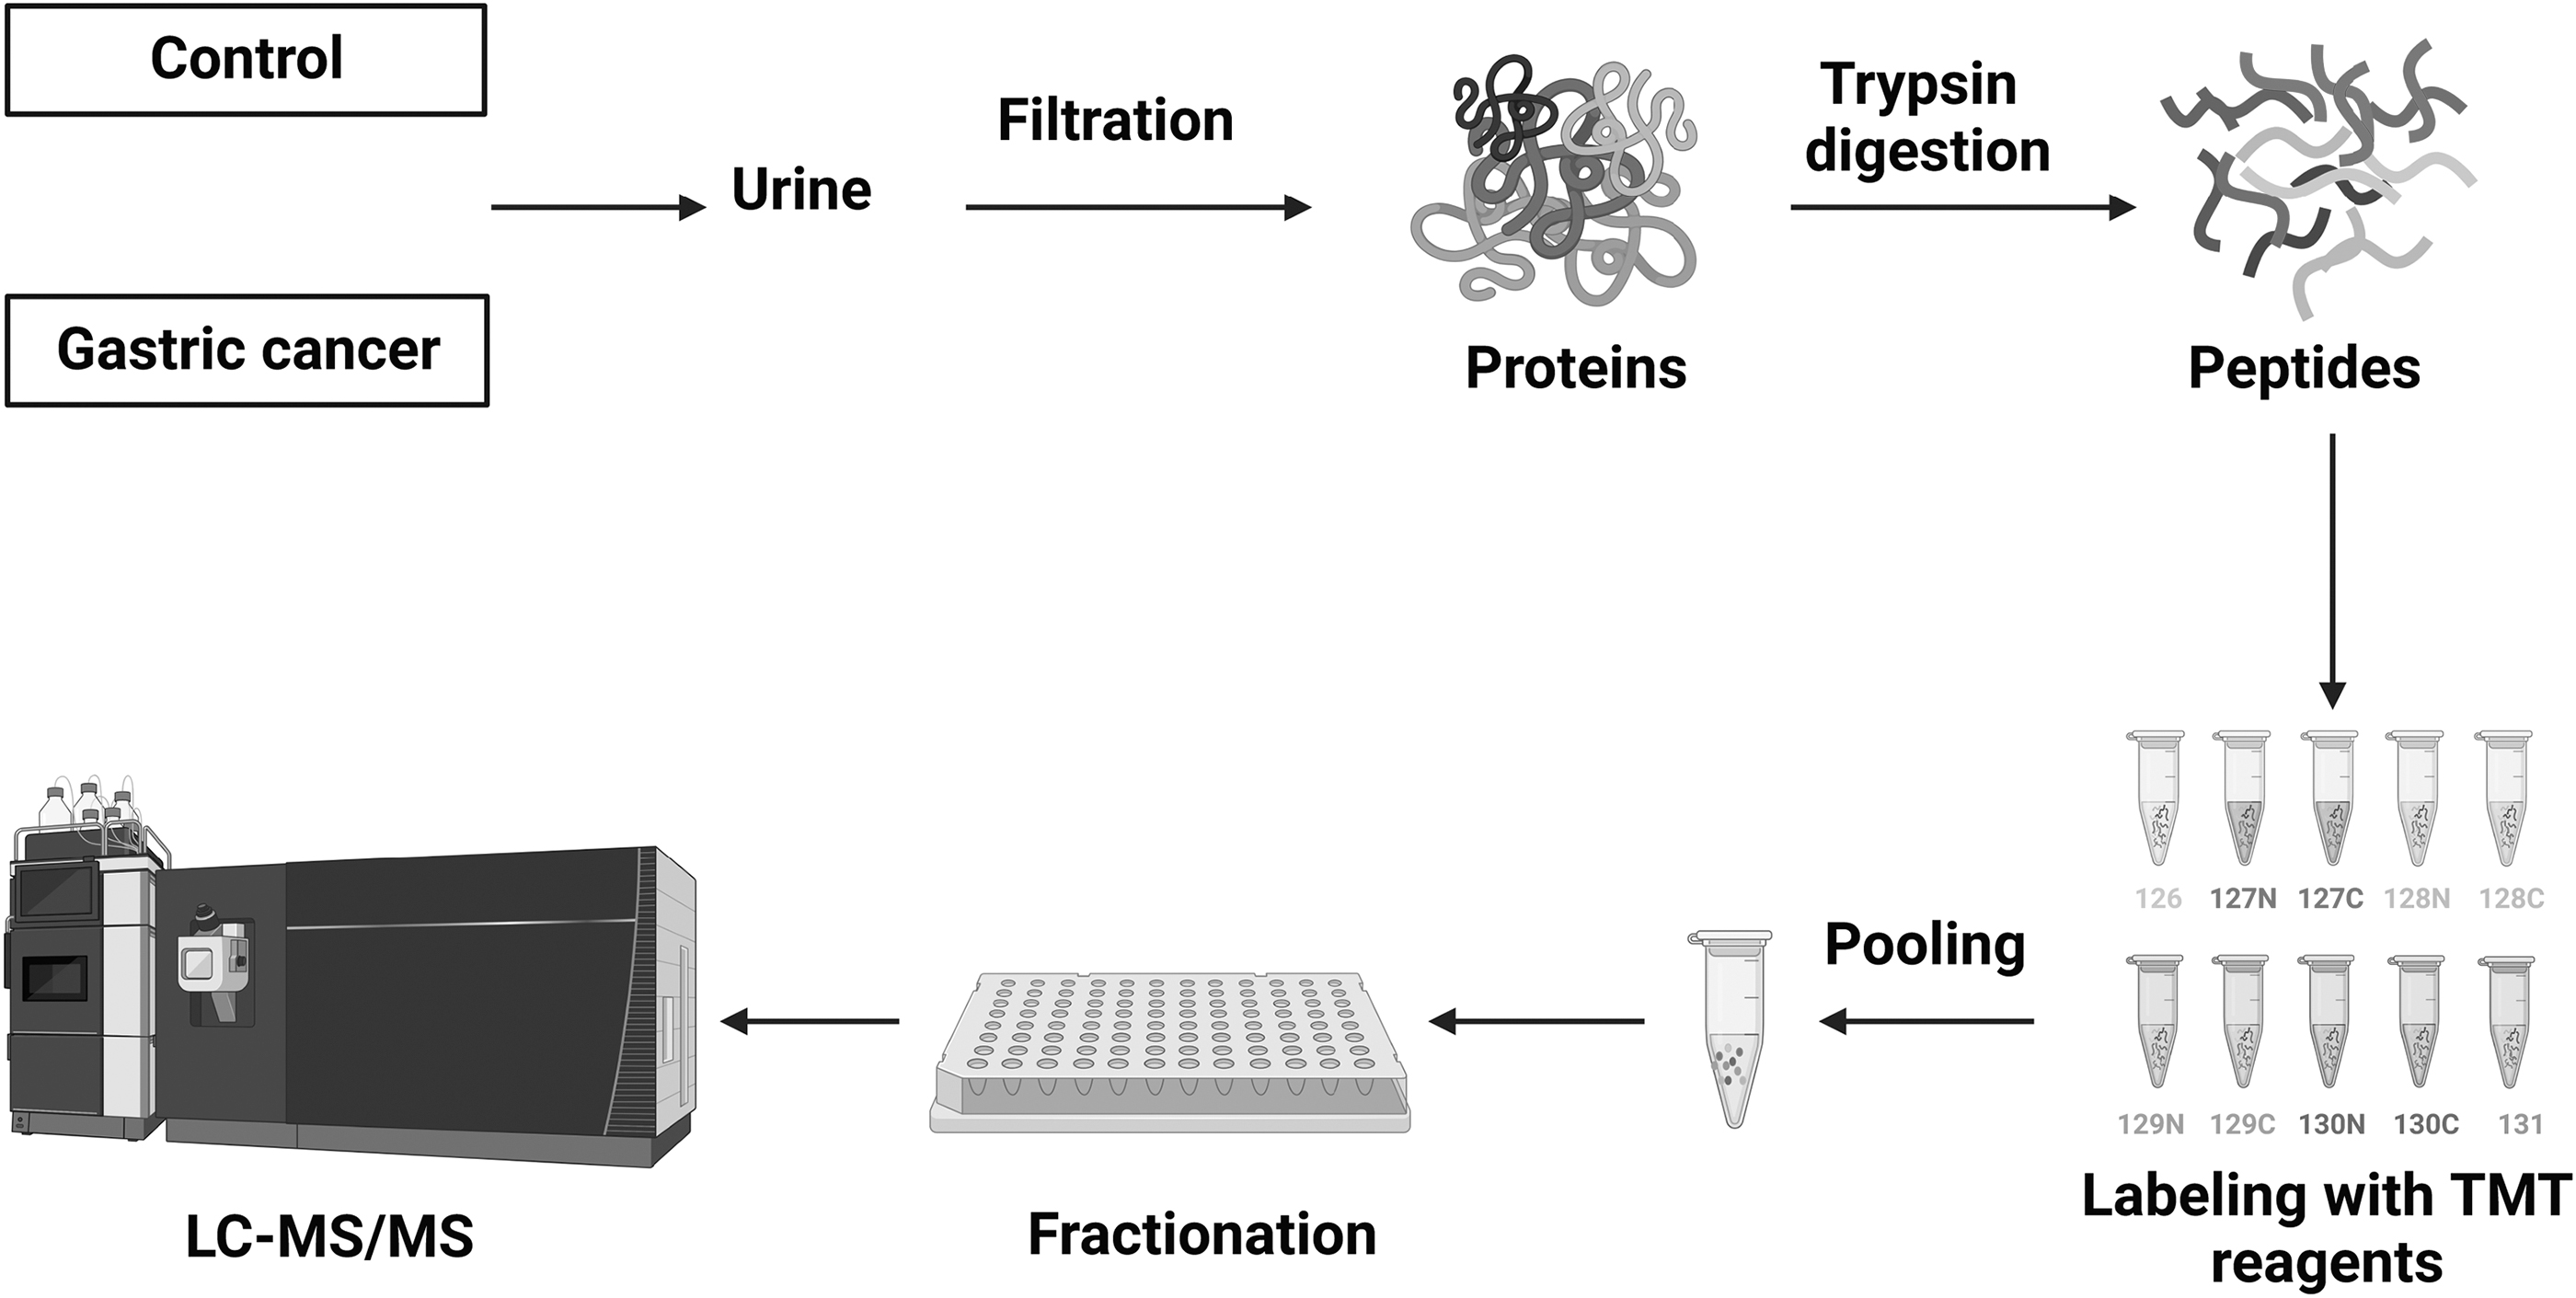
Schematics of proteomics workflow deployed in the quantitative analysis of gastric cancer urinary proteins. Urine sample from control individuals (n = 5) and gastric cancer patients (n = 5) was centrifuged and proteins were extracted using 3 KDa centrifugal filter units. Proteins were then enzymatically digested, and peptides were labeled with TMT 10-plex, and fractions were analyzed on mass spectrometer. TMT, tandem mass tags.
Quantitative proteomic profiling of urine samples
We performed a multiplexed quantitative proteomics analysis using TMT 10-plex labeling coupled with LC-MS/MS to profile urinary proteins in gastric cancer (Fig. 1). Urine samples were collected, centrifuged, and filtered through a 0.22 μm filter. Proteins from urine were concentrated using molecular weight cutoff filters (molecular weight cutoff 3 KDa), filtered, and then used for further sample processing. The digestion of extracted urinary proteins was carried out using two different enzymes, lys-C and trypsin, for efficient digestion. The peptides were then labeled with TMT 10-plex reagents, mixed, and fractionated into 24 fractions. Each of these 24 fractions was analyzed on a high-resolution mass spectrometer. The raw data acquired from mass spectrometry analysis were searched against the human RefSeq database_81 using Proteome Discoverer 2.1. Proteomic analysis resulted in the identification of 1504 proteins, out of which 1430 were quantified (Supplementary Table S2).
Differential expression of proteins in urine of gastric cancer patients
We carried out student's t-test to calculate the significance of proteins that were quantified in the TMT experiment. The distribution of proteomic data is depicted as a volcano plot in Figure 2A. This analysis revealed 246 significantly dysregulated proteins (p-value ≤0.05) in gastric cancer compared to the control group. Out of these, 128 proteins were found to be significantly higher in abundance and 118 proteins to be significantly lower in abundance in gastric cancer after applying a fold change cutoff of 1.5 (Supplementary Table S3).
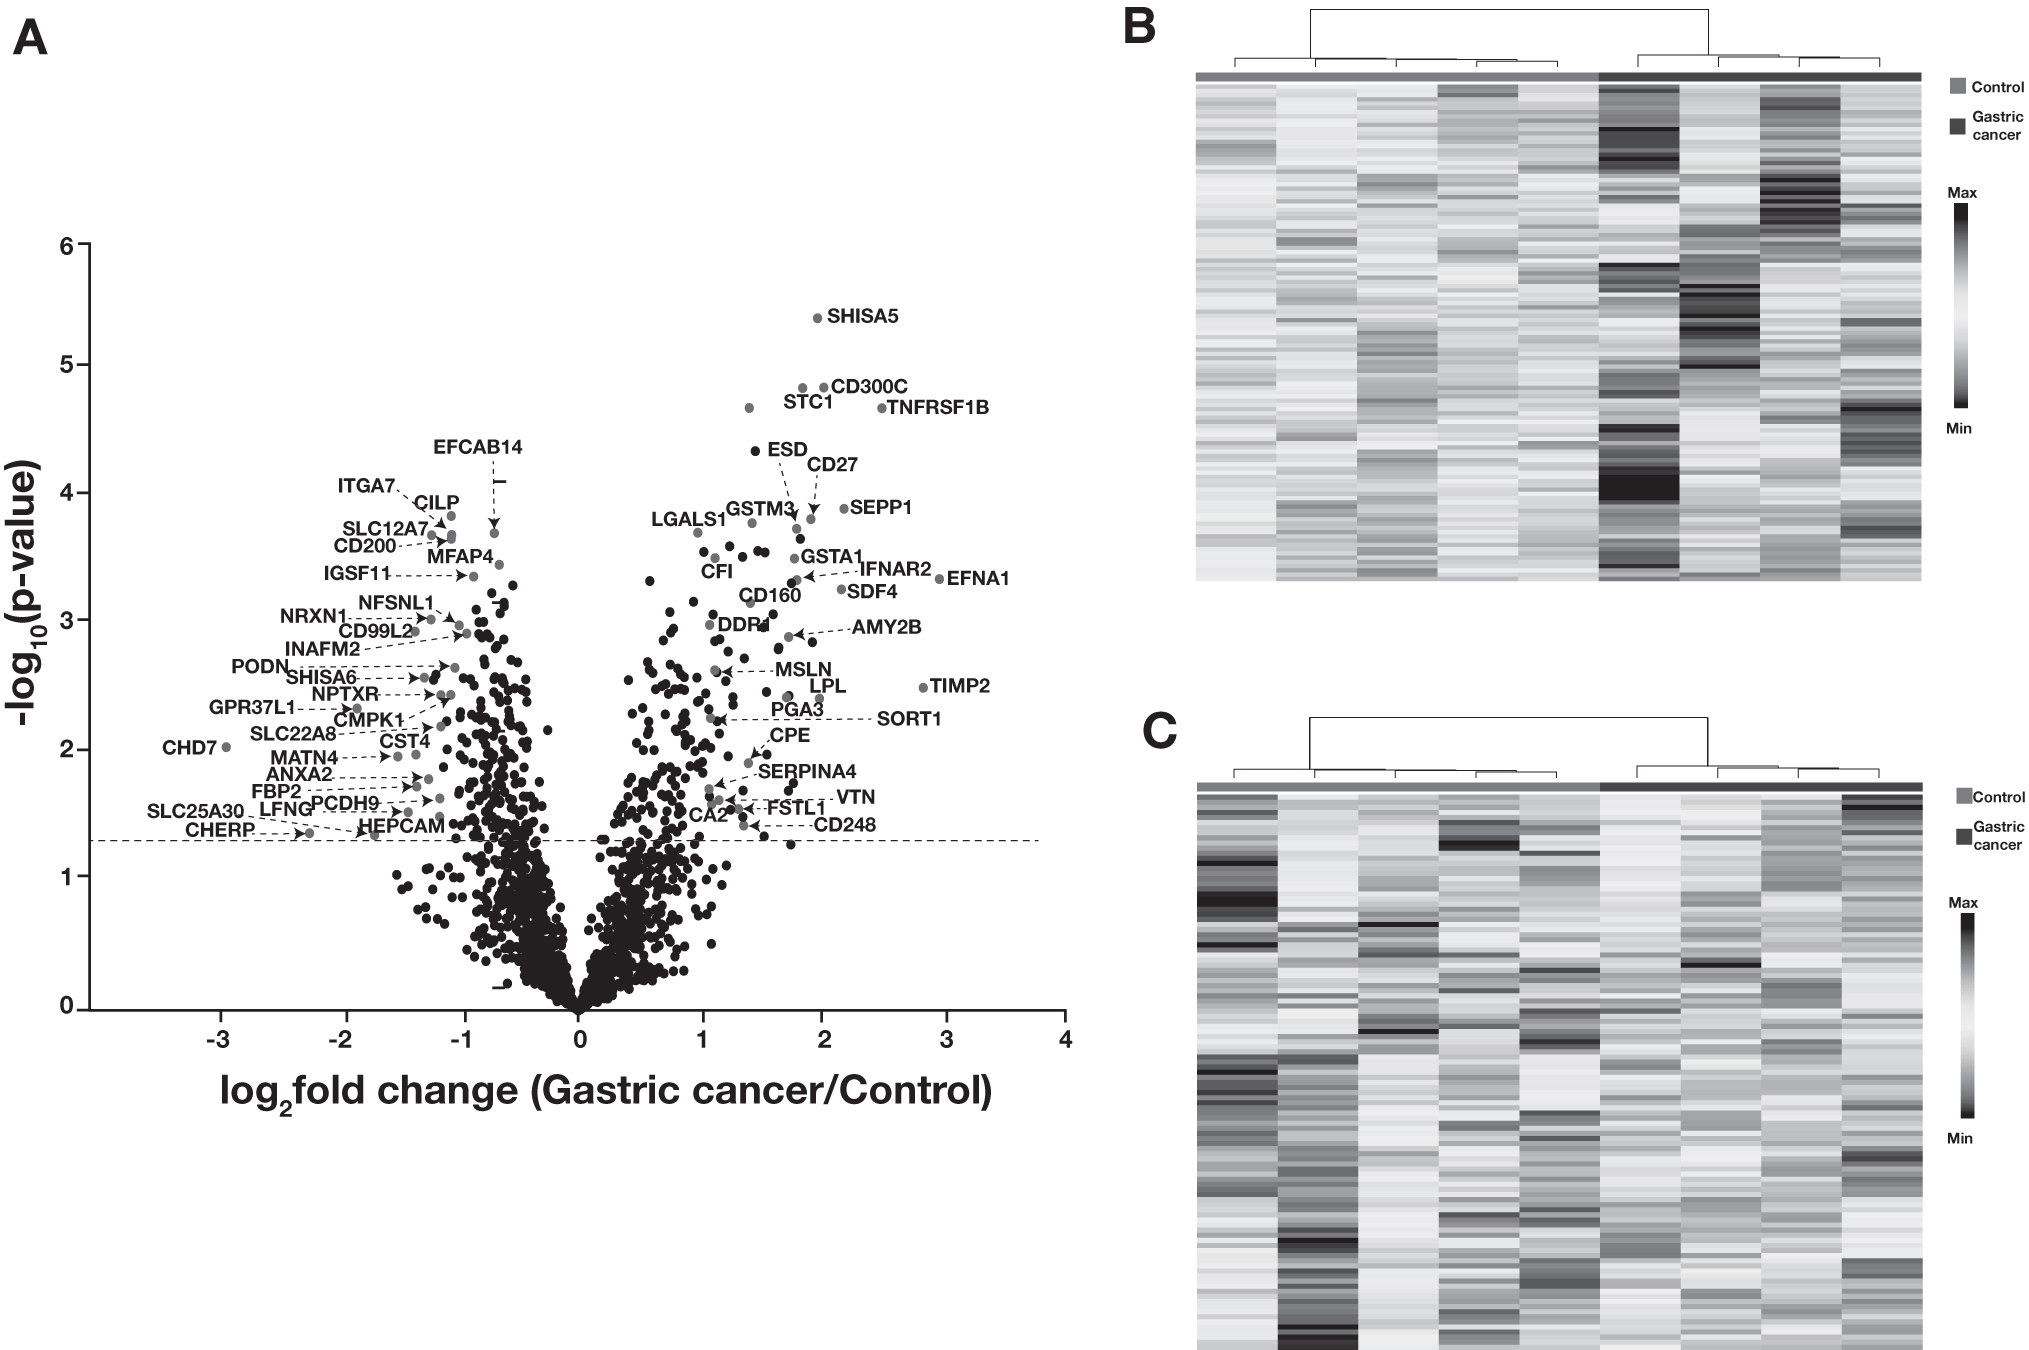
Summary of proteomics data.
Proteins, including ephrin A1 (EFNA1), metalloproteinase inhibitor 2 (TIMP2), shisa family member 5 (SHISA5), pepsinogen A-3 (PGA3), vitronectin (VTN), and sortilin 1 (SORT1), were significantly overexpressed in gastric cancer patients. Similarly, proteins, including chromodomain-helicase-DNA-binding protein 7 (CHD7), podocin (PODN), shisa-6 (SHISA6), matrilin-4 (MATN4), and annexin A2 (ANXA2), were downregulated in gastric cancer. These proteins are tissue specific and were also detected in urine. Figure 2B shows a heat map for significantly upregulated proteins in gastric cancer compared to controls, while Figure 2C depicts significantly downregulated proteins in gastric cancer.
Gene ontology analysis of differentially expressed proteins
To identify the cellular components and biological functions that are impacted in gastric cancer, gene ontology analysis of dysregulated proteins was carried out using DAVID, a web-based tool (https://david.ncifcrf.gov/). As expected, extracellular matrix or extracellular space was significantly enriched (p-value 3.59 × 10–43) for differentially expressed proteins in gastric cancer (Fig. 3A).

Gene ontology analysis of overexpressed proteins.
In addition, cellular components such as plasma membrane, cytoplasmic vesicles, and Golgi lumen were also significantly enriched for overexpressed proteins (Fig. 3A). Similarly, the downregulated proteins were localized in different cellular components such as endoplasmic reticulum, plasma membrane, vesicles along with the extracellular matrix, and cell-cell junctions (Fig. 3C). Proteins overexpressed in gastric cancer were predominantly involved in biological processes, including cell adhesion, angiogenesis, endocytosis, regulation of necrotic factors, and cell proliferation (Fig. 3B). Along with cell adhesion, many biological processes like dephosphorylation, cell differentiation, and regulation of ERK cascade were significantly enriched for the downregulated proteins (Fig. 3D).
We carried out SignalP analysis to evaluate the nature/translocation of proteins that are differentially expressed in our dataset. Signal peptides are short (usually 16–30 amino acid long), hydrophobic sorting, or recognition signals present at the N-termini of proteins and direct the protein through the classical secretory pathway (Owji et al., 2018). SignalP analysis predicted 150 proteins with N-terminal signal peptides, which could potentially be secreted out of the cell and excreted in urine (Supplementary Table S4).
For proteins spanning the membrane, we carried out TransMembrane prediction using Hidden Markov Models (TMHMM) analysis. Transmembrane helices are present in proteins, which are membrane bound. These are integral proteins that are implicated in numerous biological functions, including cell-cell communication, protein folding, transportation, and attachment. The variations in these proteins result in membrane disassembly and could lead to a disease phenotype (Ng et al., 2012). In this study, 34 proteins were predicted to have a transmembrane helix and hence could be the membrane-bound proteins (Supplementary Table S4).
Development of a targeted approach using SureQuant
To further investigate our findings in the discovery experiment, we selected a panel of proteins, which were significantly dysregulated in urine samples from gastric cancer patients. For developing a panel of candidate proteins, we considered proteins that were reported earlier to have correlation with gastric cancer prognosis and/or other types of cancers. Table 1 lists the proteins and their corresponding peptides that were selected for validation. We chose a novel targeted mass spectrometry-based approach, SureQuant, for validation studies. SureQuant is a triggered targeted mass spectrometry assay used for quantification of peptides. This approach consists of two different acquisition modes—a low-resolution scan in which continuous monitoring of a heavy IS peptide is carried out and upon detection, acquisition of the endogenous peptide is triggered in which MS/MS scan at a defined mass offset is acquired at a high resolution (Stopfer et al., 2021; van Bentum and Selbach, 2021).
Panel of Proteins and Corresponding Peptides Selected for Validation in SureQuant Assay
We deployed the SureQuant targeted assay to analyze 30 peptides from 19 proteins, which were significantly overexpressed in urine from gastric cancer patients. The criteria for selecting peptides included peptide length (8–15 amino acids), peptide uniqueness, and a peptide with significant intensity (∼106 or more). We considered only fully tryptic peptides and avoided peptides with any missed cleavages. These 30 peptides were synthesized and labeled at the C-terminus with a stable heavy isotope of arginine or lysine.
For the validation set, we processed 31 urine samples, 19 from gastric cancer and 12 from the healthy control group in which IS peptides were spiked before analysis. We monitored 30 peptides for which we observed good intense signal from mass spectrometer for IS peptides. Figure 4 shows a signal pattern for SureQuant analysis for one representative peptide. The raw data were analyzed using Skyline software and peak area of IS peptide and endogenous peptides was calculated, which was used to generate the ratio for endogenous to heavy peptide. For calculating the ratio, we selected only the peptides for which endogenous peptide was identified in more than 50% of the total number of samples. We observed 20 peptides corresponding to 12 proteins overexpressed in gastric cancer samples compared to control samples correlating with our discovery proteomic analysis.
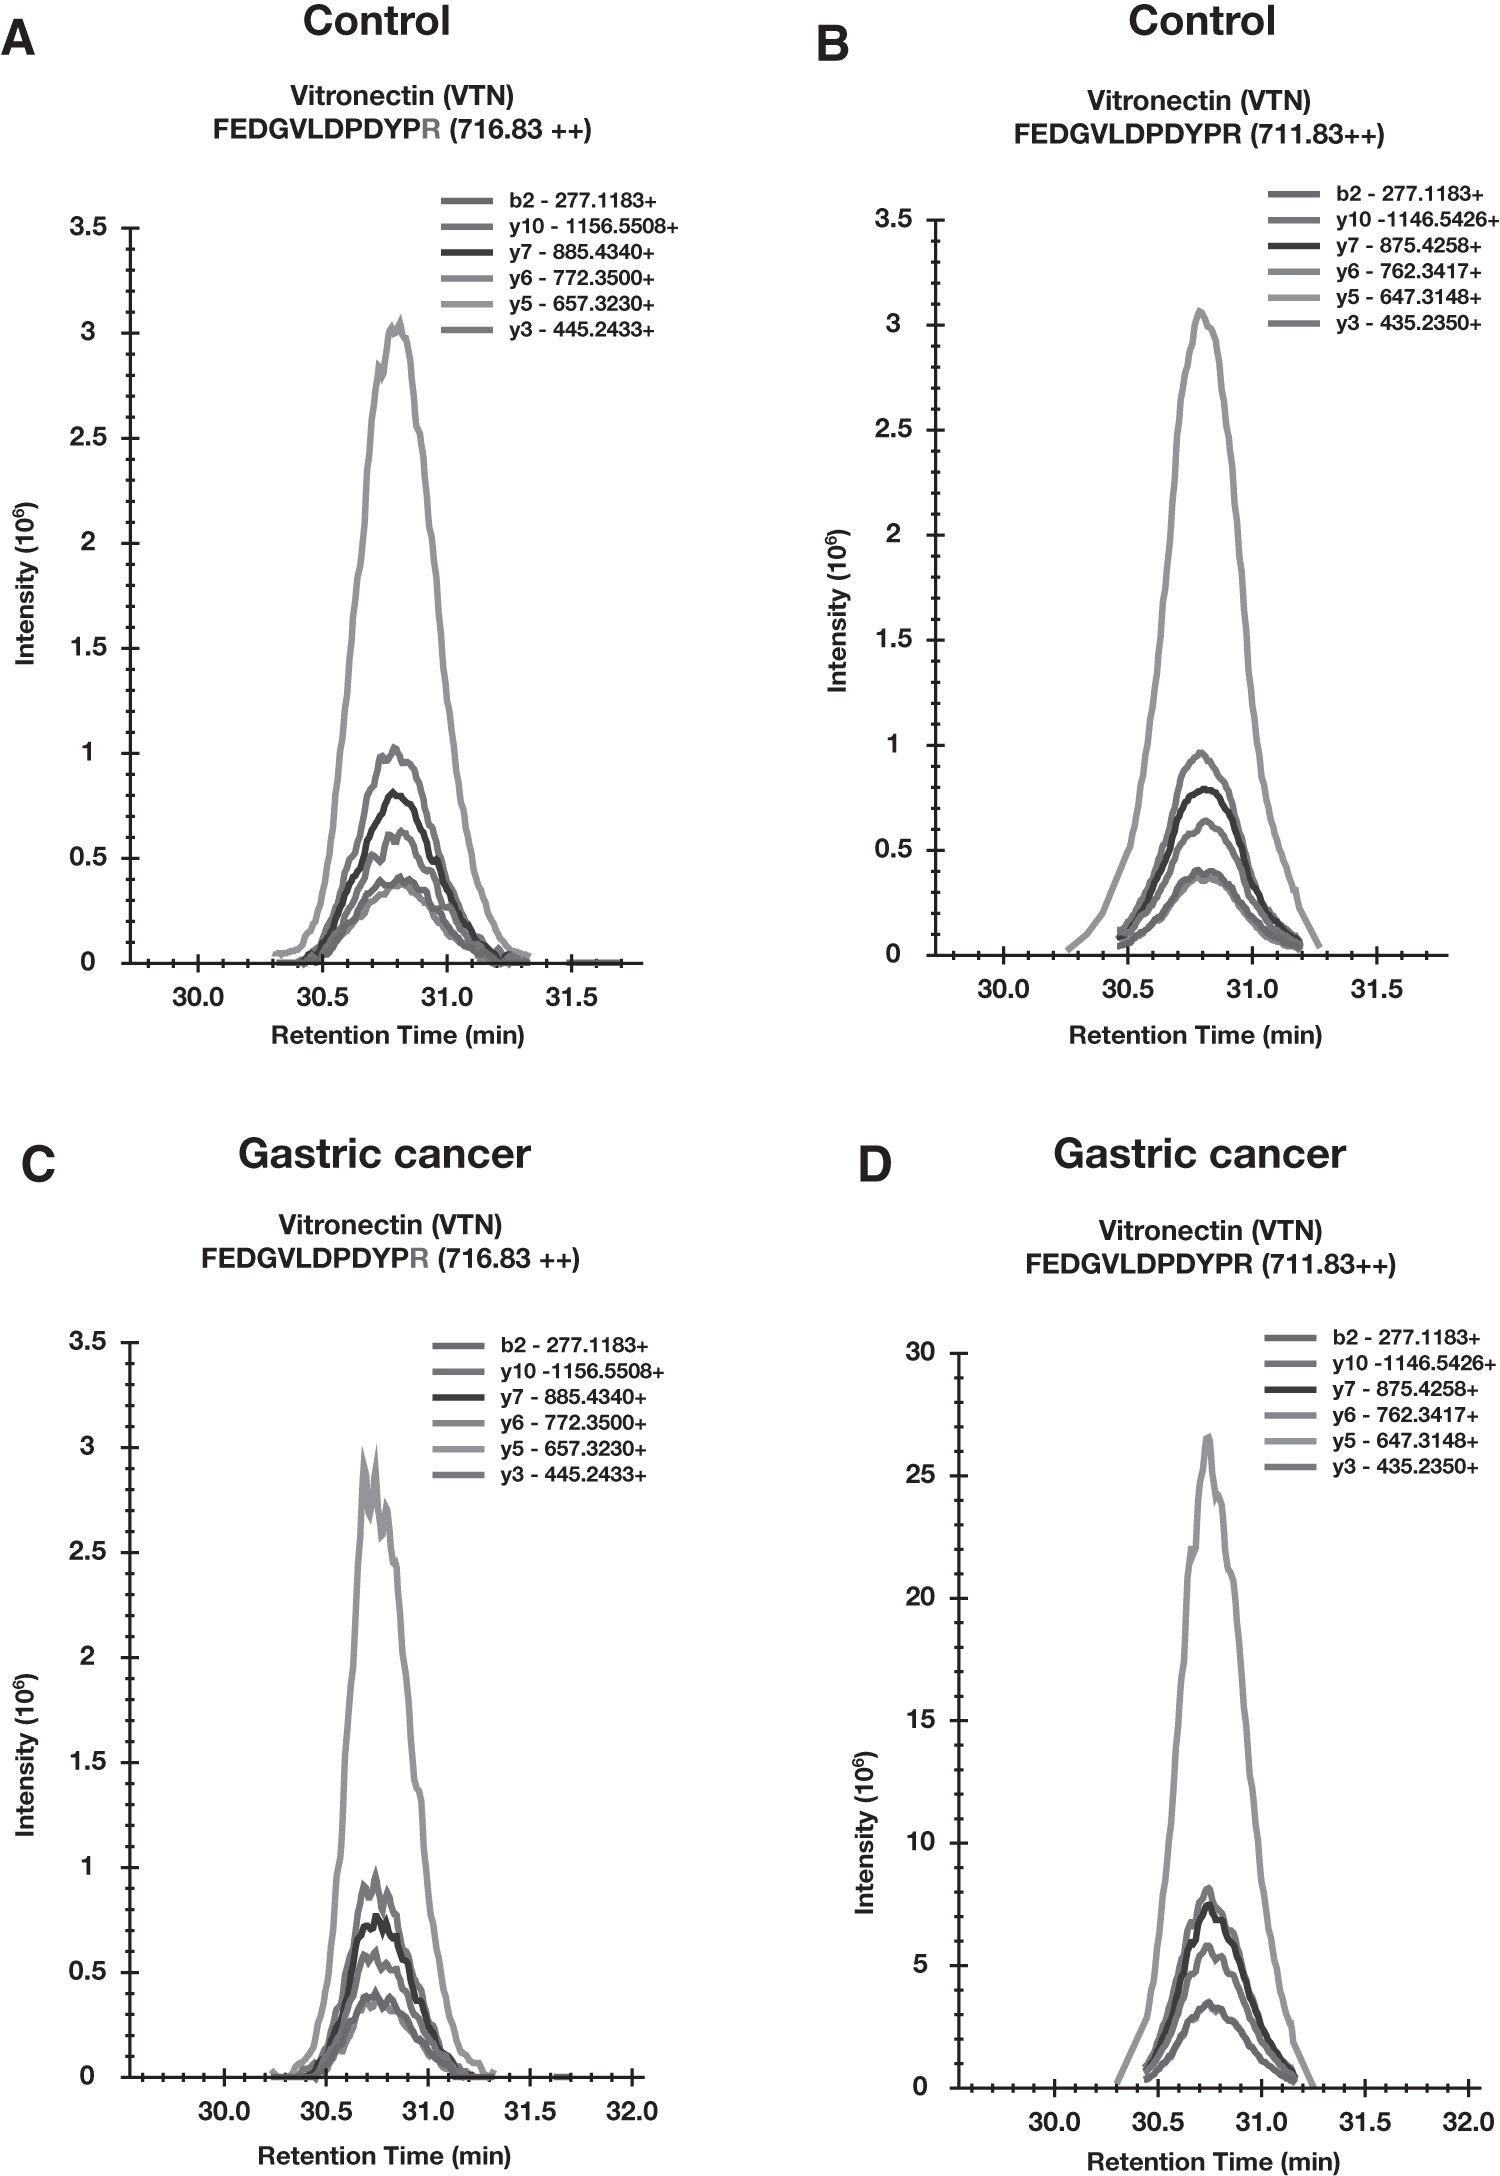
Optimization of SureQuant assay in gastric cancer.
The panel of 12 proteins include SORT1, EFNA1, kallistatin isoform 1 (SERPINA4), complement factor I (CFI), complement component C7 precursor (C7), CD27 antigen isoform X1 (CD27), glutathione S-transferase A1 isoform 1 (GSTA1), glutathione S-transferase Mu 3 (GSTM3), interferon alpha/beta receptor 2 isoform A (IFNAR2), carbonic anhydrase 2 (CA2), mesothelin (MSLN), and VTN. Student's t-test was performed to examine the difference in the abundance of proteins in the two groups. Box plots were generated for four proteins, which were significantly different in their expression in gastric cancer samples (Fig. 5).

Box plots for peptides detected in gastric cancer.
These proteins have been reported earlier in gastric or other cancers. Sortilin 1 (SORT1) functions as a sorting receptor in Golgi apparatus as well as acting as a clearance receptor on cell membrane. SORT1 is required for the protein transport from Golgi apparatus to lysosomes and in the transport of proteins from the Golgi body to endosome. Sortilin is a developmental protein involved in differentiation, endocytosis, and osteogenesis along with the protein transport. Upregulation of SORT1 by circular RNA was shown to promote the progression of gastric cancer (Liang et al., 2021). Overexpression of SORT1 in urine from gastric cancer patient was observed in the validation (Fig. 5A).
VTN is a cell adhesion protein and differential expression of this protein can promote cell migration. Lian et al. (2019) showed overexpression of VTN by immunohistochemistry in gastric cancer tissue samples, suggesting its probable role in regulating cell growth and motility. In another study, the elevated level of VTN was identified in cancer-associated fibroblasts in gastric cancer, leading to metastasis (Yang et al., 2020; Zhang et al., 2022). Our data also showed the overexpression of VTN in gastric cancer samples (Fig. 5B).
CA2, an isoform of carbonic anhydrase, was overexpressed in this study (Fig. 5C). CA2 has been reported to be overexpressed in urothelial carcinomas and associated with tumor grade, invasiveness, and progression of cancer (Tachibana et al., 2017). In gastrointestinal stromal tumors, CA2 has been shown to be overexpressed using immunohistochemistry and western blotting (Parkkila et al., 2010).
CFI is part of complement system, which is involved in body's immune system. Changes in the expression of proteins that are part of complement system have been shown to be involved in the development and progression of cancers (Revel et al., 2020). Overexpression of CFI in cutaneous squamous carcinoma cells promotes proliferation and upregulates expression of matrix metallopeptidase 2 and 13, which stimulate invasion of these cells (Rahmati Nezhad et al., 2021). It has also been shown to correlate with poor prognosis and overall survival in glioma patients (Cai et al., 2020). Our data also revealed overexpression of CFI in gastric cancer (Fig. 5D). However, Liu et al. (2007) reported downregulation of CFI in gastric cancer to be associated with TNM staging. This needs to be further evaluated to confirm the role of CFI in the development of gastric cancer.
The panel of four proteins—SORT1, VTN, CA2, and CFI—was assessed for their specificity to distinguish gastric cancer from control samples. ROC analysis for these candidates revealed the peptide SAPGEDEECGR derived from SORT1 to be the best performing peptide with AUC of 0.82. Peptides, including FEDGVLDPDPYPR from VTN and VVDVLDSIK from CA2, showed suboptimal performance individually with AUC of 0.78 and 0.74, respectively (Fig. 6A). However, paired ROC analysis of SAPGEDEECGR from SORT1 and FEDGVLDPDPYPR from VTN further showed slight improvement in the performance with an AUC of 0.83 (Fig. 6B). Table 2 represents the AUC calculated for each peptide individually as well as in pairs.
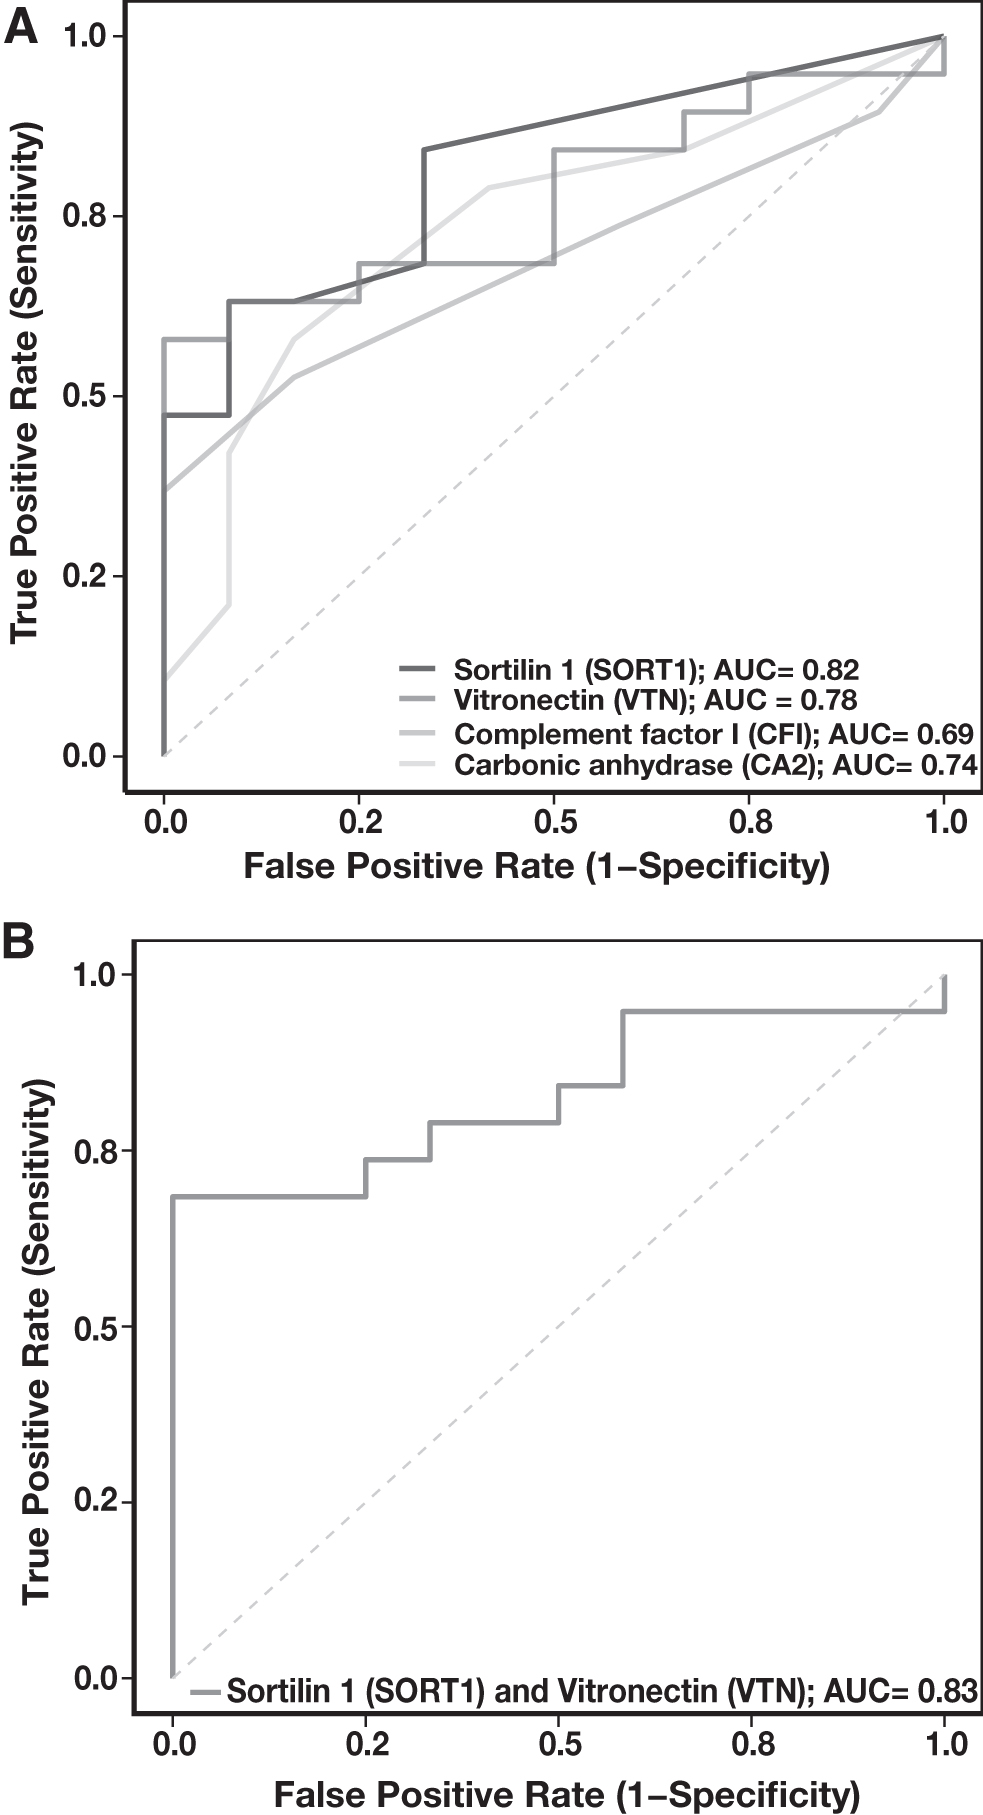
ROC curve.
Area Under the Receiver Operating Characteristic Curve for Pairs of Potential Urinary Protein Markers for Gastric Cancer
Conclusions
Urine is a commonly used noninvasive biospecimen for diagnostic and prognostic assays because it has proteins derived from the systemic circulation as well as the excretory system. Mass spectrometry-based proteomics of urine provides vital information not only for renal disorders but also for identification of biomarkers for a variety of other diseases. Our discovery studies led us to identification of a panel of candidate proteins, which were subsequently validated by deploying SureQuant, a novel targeted mass spectrometry method. This study demonstrates the potential of a urinary proteomics approach for the detection of gastric cancer and could be extended to other cancers as well.
Footnotes
Acknowledgments
We thank Jane Peterson for synthesizing heavy isotope-labeled peptides for targeted analysis. We also thank Roman Zenka for his assistance with data analysis.
Authors' Contributions
Conceptualization, N.J., G.S., R.S., and A.P.; data curation, N.J. and F.B.; formal analysis, N.J., F.B., and A.B.; funding acquisition, A.P.; investigation, N.J., F.B., and G.S.; methodology, N.J., G.S., and A.P.; project administration, A.P.; resources, N.J., G.S., and A.P.; software, N.J., F.B., and S.C; supervision, R.S. and A.P.; validation, N.J., F.B., A.B., and S.C.; visualization, N.J. and A.P.; writing—original draft, N.J.; writing—review and editing, N.J., F.B., A.B., G.S., S.C., A.J., R.S., and A.P. All authors have read and agreed to the published version of the article.
Author Disclosure Statement
The authors declare they have no conflicting financial interests.
Funding Information
This work was supported, in part, by grants from the National Cancer Institute to A.P. (U01CA271410 and P30CA15083). The funders had no role in the design of the study; in the collection, analyses, or interpretation of data; in the writing of the article; or in the decision to publish the results.

Abbreviations Used
References
Supplementary Material
Please find the following supplemental material available below.
For Open Access articles published under a Creative Commons License, all supplemental material carries the same license as the article it is associated with.
For non-Open Access articles published, all supplemental material carries a non-exclusive license, and permission requests for re-use of supplemental material or any part of supplemental material shall be sent directly to the copyright owner as specified in the copyright notice associated with the article.
