




Abstract
Homeodomain-interacting protein kinase 1 (HIPK1) is majorly found in the nucleoplasm. HIPK1 is associated with cell proliferation, tumor necrosis factor-mediated cellular apoptosis, transcription regulation, and DNA damage response, and thought to play significant roles in health and common diseases such as cancer. Despite this, HIPK1 remains an understudied molecular target. In the present study, based on a systematic screening and mapping approach, we assembled 424 qualitative and 44 quantitative phosphoproteome datasets with 15 phosphosites in HIPK1 reported across multiple studies. These HIPK1 phosphosites were not currently attributed to any functions. Among them, Tyr352 within the kinase domain was identified as the predominant phosphosite modulated in 22 differential datasets. To analyze the functional association of HIPK1 Tyr352, we first employed a stringent criterion to derive its positively and negatively correlated protein phosphosites. Subsequently, we categorized the correlated phosphosites in known interactors, known/predicted kinases, and substrates of HIPK1, for their prioritized validation. Bioinformatics analysis identified their significant association with biological processes such as the regulation of RNA splicing, DNA-templated transcription, and cellular metabolic processes. HIPK1 Tyr352 was also identified to be upregulated in Her2+ cell lines and a subset of pancreatic and cholangiocarcinoma tissues. These data and the systems biology approach undertaken in the present study serve as a platform to explore the functional role of other phosphosites in HIPK1, and by extension, inform cancer drug discovery and oncotherapy innovation. In all, this study highlights the comprehensive phosphosite map of HIPK1 kinase and the first of its kind phosphosite-centric analysis of HIPK1 kinase based on global-level phosphoproteomics datasets derived from human cellular differential experiments across distinct experimental conditions.
Introduction
Homeodomain-interacting protein kinase 1 (HIPK1) is a serine/threonine kinase of the HIPK subfamily comprising HIPK1, HIPK2, HIPK3, and HIPK4 (Matre et al., 2009). These families mainly function as corepressors for various homeodomain-containing transcription factors (Kim et al., 1998). The prominent members of the HIPK family, HIPK2 and HIPK1, are reported to be functionally redundant during embryogenesis (Conte and Pierantoni, 2018). HIPK1, located at 1p13 encodes a 13 kDa protein of 1210 amino acids with a protein kinase domain extending from 190 to 518 amino acids similar to HIPK2 and HIPK3 (Ecsedy et al., 2003). HIPK1 consists of both N-terminal and C-terminal regions (Supplementary Fig. S1).
HIPK1 is an understudied molecular target of broad relevance to drug discovery and in particular in cancer and oncotherapy innovation. HIPK1 is associated, for example, with cell proliferation, apoptosis, transcription regulation, and DNA damage response, and is thought to play significant roles in health and common complex human diseases. The following brief molecular context illustrates the salience of the HIPK1 further.
Common to all HIPK family members, the HIPK1 kinase domain is situated in the N-terminal section followed by a protein–protein interaction domain, PEST (proline glutamate, serine, and threonine) domain, and SUMO- (small ubiquitin-related modifier)-interaction motif (SIM) domain. Interaction domain plays a crucial role in binding to homeodomain transcription factors as well as other regulatory proteins (Kurokawa et al., 2014). The C-terminal region contains numerous short repeats of alanines, glutamines, and serines. Specific function of these recurring amino acids remains unknown suggesting an unstructured region at the C-terminus (Dunker and Gough, 2011). Previous studies have reported that the N-terminal of HIPK1 can be SUMOylated (Li et al., 2005). The ability of HIPK1 to localize within subnuclear speckles is critically dependent on the presence of a functional SIM in the C-terminus. This motif enables the noncovalent binding of various SUMO isoforms, including SUMO1–3. The SIM domain plays a pivotal role in facilitating both intra- and intermolecular protein interaction, effectively acting as an adhesive that strengthens specific interactions. Additionally, nuclear localization sequences 1 (NLS1) in the interaction domain can regulate HIPK1's nuclear localization.
Since HIPK1 has a highly conserved sequence that includes the autoinhibitory region, this sequence helps regulate the catalytic activity of HIPK1 (de la Vega et al., 2012; Rui et al., 2004).
HIPK1 is predominantly localized in the nucleus and also transports to the cytoplasm (Kondo et al., 2003). Its cytosolic translocation from the nucleus depends on the SUMO-specific protease SENP1 (sentrin-specific protease), which mediates tumor necrosis factor-induced deSUMOylation and releases SUMO from HIPK1 to enable its relocalization to the cytosol. Several studies have reported the tumor suppressor or growth inhibitor role of cytoplasmic HIPK1. It is also associated with the Programmed Cell Death 6 Interacting Protein (PDCD6IP)-Mitogen-Activated Protein Kinase Kinase Kinase 5 (MAP3K5) complex, which releases TRX and 14-3-3 and plays a major role in the activation of ASK1-JNK signaling and endothelial cell apoptosis. HIPK1 might therefore play an apoptotic and antiapoptotic dual function (Li et al., 2008, 2005; Park et al., 2012). HIPK nuclear protein kinases were initially conceived as corepressors for diverse homeodomain-containing transcription factors such as NK1 Homeobox 2 (NKX1-2), NK1 homeobox 1(NKX-1-1), and Homeobox protein Hox-D4 (HoxD4) (Kim et al., 1998).
Various studies indicate that HIPK1 may be involved in the regulation of several transcriptional regulators, chromatin modifiers, and play a role in cellular processes, such as cell proliferation, apoptosis, DNA damage response, and metabolic (Ecsedy et al., 2003; Lee et al., 2012; Schmitz et al., 2014).
Protein phosphorylation is one of the key post-translational modifications in HIPK1 and being a kinase, it is also considerably the major mode of its signal transduction. Notably, van der Laden et al. (2015) have suggested the tyrosine autophosphorylation potential of HIPKs, assigning them as potential dual-specificity kinases. Currently, there are 23 phosphosites reported in HIPK1 and all these sites are unassigned to any associated functions (Hornbeck et al., 2015). In this regard, among many of its phosphosites, Tyr352 within its kinase domain is noteworthy (Goss et al., 2006). However, HIPK1 is relatively understudied, as noted earlier, and less is known about HIPK1 than HIPK2 with respect to substrates or the kinases that can modulate HIPK1.
The present study employed a novel computational approach aimed to explore the functional and clinical relevance of Tyr 352 in HIPK1 through analysis of the phosphorylation sites across a wide variety of proteins that are positively and negatively associated with HIPK1 phosphorylation events in different biological contexts. This comprehensive examination holds the potential to enhance our understanding of the involvement of HIPK1 in processes such as transcriptional regulation, cell apoptosis, metabolic stress, and oncogenesis as well as cancer therapy. These findings could serve as fundamental benchmarks in the development of therapeutic approaches and help in predicting potential biomolecular markers connected to the HIPK1 kinase.
Materials and Methods
Assembly of global phosphoproteomics datasets with HIPK1 phosphosite-specific regulation
To study the expression and coregulatory effects of protein phosphosites (PpS) in response to HIPK1 activity. Using bioinformatic techniques, the datasets were analyzed to identify the PpS that are positively or negatively correlated with HIPK1. A PubMed search was carried out using the keywords “phosphoproteomics” OR “phosphoproteome” NOT “Plant” NOT “Review.” We curated published human cellular phosphoproteome datasets that contained Class I HIPK1 phosphosites. These datasets are classified as qualitative profile datasets (test conditions and control as independent phosphosite profile datasets) and quantitative differential datasets (test; biological/experimental conditions vs. their corresponding control) (Supplementary Table S1 and S2).
These datasets were generated from different experimental conditions, various mass spectrometry-based data acquisition approaches, and both labeled and label-free quantification methods, resulted in technical variability in terms of data normalization. To ensure the reliability of identified phosphosites and reduce the potential false positives, we specifically focused on phosphosites with a localization probability of ≥75% or an A-score >13. A higher localization probability or A-score indicated greater confidence in the identification of phosphosites.
To ensure statistically significant outcomes across biological conditions, data filtering was based on a p < 0.05. Additionally, to examine notable changes at the phosphorylation level and assess differential expression patterns of PpS, we applied specific filters. Phosphosites were included in the analysis if they exhibited a fold-change cutoff of ≥1.3 for upregulated phosphosites and ≤0.76 for downregulated phosphosites. We followed these criteria to make the data more biologically relevant and ensure its statistical significance. Additionally, we grouped the datasets based on the methods used for enriching phosphosites (Ser-Thr or Tyr phosphosites). We employed a built-in mapping tool to map individual phosphosites in the datasets to their corresponding UniProt accessions (downloaded on May 13, 2023) (UniProt Consortium, 2023). We then curated and analyzed the mapped data. For ease of understanding of terminologies used throughout the analysis, they are provided in Supplementary Data S1.
Identification of predominant phosphosites in HIPK1
This study aimed to identify the most common phosphosites in HIPK1 using human cellular data, focusing on those enriched in the serine/threonine (S/T) and tyrosine (Y) phosphoproteomes. For this, the phosphosites were subsequently ranked according to their frequency of detection across these datasets. The top HIPK1 phosphosites were chosen based on their frequency in the differential datasets, which enabled the analysis of correlated phosphosites in other proteins. Additionally, the R/Bioconductor package trackViewer (version 10.18129/B9.bioc.trackViewer) was utilized to represent the frequency of HIPK1 phosphosites assembled from the qualitative profile and quantitative differential datasets in lollipop plots. Among these phosphosites, those with the highest frequency were selected as the predominant site.
Analysis of the PpS that coexpressed/coregulated with predominant HIPK1 phosphosite
To analyze PpS positively and negatively correlated with specific HIPK1 phosphosites, we categorized PpS based on their coregulation patterns in distinct quantitative datasets. PpS upregulated (U) with HIPK1 phosphosite upregulation (U) were categorized as UU, while those downregulated (D) with HIPK1 upregulation were UD. Similarly, DD and DU datasets were categorized. For instance, for HIPK1 Tyr352, datasets were divided into Tyr352 upregulated (U) and downregulated (D). When HIPK1 (Tyr352) is upregulated, PpS upregulated are categorized as UU and downregulated as UD. Conversely, when HIPK1 Tyr352 is downregulated, upregulated or downregulated PpS are assigned DU or DD, respectively (Supplementary Table S3). A Venn diagram displayed the intersection between UU, DD, UD, and DU coregulated PpS. To exclude datasets with conflicting coregulatory patterns, PpS were further classified as positively correlated (UU ∩ DD) − (UD ∪ DU) termed UUDD and negatively correlated (UD ∩ DU) − (UU ∪ DD) termed UDDU.
Despite this classification, we find it reasonable to make predictions. Coregulated PpS were selectively chosen through UUDD/UDDU or UDDU/UUDD ratios, resulting in the identification of UUDD+ and UDDU+ PpS (Supplementary Table S4). In summary, we considered the combination of UUDD and UUDD+ as positively correlated PpS and UDDU and UDDU+ as negatively correlated PpS for further analysis. A detailed explanation of the criteria used for the analysis of positive and negative correlation with an example of the HIPK1 site is provided in Supplementary Data S2 and Supplementary Figure S2.
Analysis of phosphosites in known/predicted interactors, kinases, and substrates coregulated with HIPK1 Tyr352 phosphosite
PpS that exhibited either positive or negative correlations with specific phosphosites in HIPK1 were selected for further examination. These phosphosites were subjected to the enrichment of (1) experimentally known downstream substrates of HIPK1 obtained from resources, including PhosphositePlus (downloaded May 2023) (Hornbeck et al., 2015), Phospho.ELM (downloaded May 2023) (Dinkel et al., 2011), and RegPhos (version 2.0) (downloaded May 2023) (Huang et al., 2014); (2) predicted kinases and substrates determined through various bioinformatics-based prediction tools, such as NetworKIN (Linding et al., 2008), Automatic Kinase-specific Interactions Detection (AKID) (downloaded June 2023) (Parca et al., 2019); (3) a set of substrates and kinases enlisted based on the assay in In Vitro Kinase-to-Phosphosite Database (iKiP-DB) (Mari et al., 2022); (4) phosphomotif-based analysis of kinase and substrate specificities from the work by Johnson et al. (2023); (5) the experimentally known protein–protein interactions, including substrates, extracted from database such as Human Protein Reference Database (Goel et al., 2012), Biomolecular Interaction Network Database (Bader et al., 2003), BioGRID (Oughtred et al., 2021), ConsensusPathDb (version 35) (downloaded May 2023) (Kamburov and Herwig, 2022), CORUM comprehensive resource of mammalian protein complexes (downloaded March 2023) (Tsitsiridis et al., 2023), and RegPhos (version 2.0) (downloaded May 2023) (Huang et al., 2014); and (6) coregulated kinase/phosphatase network determined through Human Genome Organization Gene Nomenclature Committee (HGNC) (Seal et al., 2023) and Cophosphorylation-based Kinase–Substrate Interaction Prediction (CoPhosK) (Ayati et al., 2019).
For gene set enrichment analysis of the identified proteins, the g:Profiler tool was employed (Raudvere et al., 2019). The visualization of PpS in substrates, interactors, and kinase networks is represented using Cytoscape (version 3.10.) (Shannon et al., 2003), and RAWGraphs (Mauri et al., 2017). The overview of the workflow followed for the analysis of HIPK1-associated phosphoproteomics datasets is represented in Figure 1.

Workflow for the analysis of human cellular HIPK1 phosphoproteomics datasets. HIPK1, homeodomain-interacting protein kinase 1.
Data availability
All pertinent data are provided in the article.
Results and discussion
Screening through the publicly available phosphoproteomics datasets, we identified a total of 424 human cellular qualitative profiles and 44 quantitative differential expression datasets with Class I HIPK1 phosphosites (Supplementary Tables S1 and S2). These datasets were curated from the distinct biological and experimental conditions associated with the involvement of HIPK1 phosphosites majorly in functions involving Epidermal growth factor (EGF), Tumor growth factor-alpha (TGF), Human epidermal growth factor receptor 2 (HER2), Growth Arrest-Specific 6 (GAS6), B-Raf serine/threonine-protein kinase (BRAF), Interleukin 6 (IL-6), Casitas B-lineage Lymphoma (CBL), Prostaglandin E2 (PGE2), Protein Phosphatase 2 Phosphatase Activator (PP2A1), Ribosomal Protein S6 Kinase A1/A3 (RSK1/2), AKT1, L-type amino acid transporter 1 (LAT1), Phosphodiesterase 3A/4A/8A, caffeine, coumarin, and T cell receptor signaling, and in SARS-CoV-2 Infection (Supplementary Table S5).
Through extensive mapping of gene symbols and the PpS to specific UniProt accessions across these 424 qualitative profile datasets, we identified a total of 15 phosphosites in HIPK1. Notably, we also identified three phosphosites not reported in PhosphoSitePlus but detected in more than 2 studies such as Ser350 (DeNardo et al., 2013; Kang et al., 2017; Okanishi et al., 2022; Solanki et al., 2021; Zhang et al., 2022), Thr449 (Adachi et al., 2016; Batth et al., 2019; Bufe et al., 2021; Chae et al., 2021; Martinez-Fabregas et al., 2020), and Tyr549 (Bian et al., 2016).
The HIPK1 phosphosite Ser350 was identified from TMT-labeled analysis in the biliary tract cancer (BTC) cell line and lung cancer cell line (H358 cell line) (Okanishi et al., 2022; Solanki et al., 2021). In the BTC cell line, the cells underwent treatment with LAT1 inhibitor JPH203, and in the H358 cell line, the cells were treated with KRASG12C inhibitor ARS1620 for 6 and 24 hours. Phosphosite Thr449 was identified from SILAC-labeled analysis in human bone osteosarcoma epithelial cells (U2OS cell line) and type 1 helper cells (Th-1 cell line) (Borisova et al., 2018; Martinez-Fabregas et al., 2020). In the U2OS cell line, the cells underwent treatment with p38, MK2/3/5 inhibitors SB203580, and PF-3644022 in the control condition and treated condition. The study by Martinez-Fabregas et al. (2020) reported that the Th-1 cell line underwent HyIL6 stimulation in the control condition and treated condition. The HIPK1 Tyr549 was identified from Label-free analysis in HEPG2 cells treated with pervanadate (Bian et al., 2016).
Predominant HIPK1 phosphosite(s) in global phosphoproteomics datasets
Using the 424 cellular qualitative profiles and 44 quantitative differential datasets derived from diverse biological or experimental conditions, we ranked them based on the frequency of detected Class I HIPK1 phosphosites in high-throughput studies. In 219 cellular qualitative profile datasets and 22 cellular quantitative differential datasets, Tyr352 was detected and perturbed, respectively (Fig. 2). Hence, we designated Tyr352 as the predominant phosphosite detected in HIPK1 through mass spectrometry. Furthermore, considering the specific amino acid position of this top site in relation to the kinase domain region and according to the current tryptic-peptide-based phosphoproteome data, HIPK1 kinase can be categorized as a protein kinase with predominant phosphosite(s) located inside the kinase domain. Tyr352 is also conserved across HIPK1, HIPK2 (Tyr361), and HIPK3 (Tyr359) and seems to be the predominant phosphosite also detected in them. Notably, HIPK1 Tyr352, in association with its kinase activity has not been studied and demands further investigation.

Lollipop plot representing HIPK1 phosphosites observed from human cellular profiling and differential phosphoproteomic datasets.
Codifferentially regulated phosphosites of HIPK1 Tyr352
HIPK1 Tyr352 was identified to be perturbed upon GAS6, EGF, TGF-alpha, caffeine, coumarin, and the T cell receptor/CD28 stimulation and also upon the inhibition or silencing of Ataxia telangiectasia and Rad3-related protein (ATR), CBL, and RSK1/2. Furthermore, Tyr352 was found upregulated across HER2+ versus HER2- breast cancer cells. However, the role of Tyr352 is unexplored for their specific role in biological functions for phosphoproteomics research. Hence, we undertook a phosphosite-centric approach and analyzed 11 each phosphoproteomics datasets with upregulation and downregulation of HIPK1 Tyr352 compared with their respective control conditions. We first categorized all the PpS that were upregulated and downregulated with respect to the status of Tyr352 into UU, UD, DU, and DD categories. To assign positive and negative correlation PpS with Tyr352, we focused on the unique PpS present exclusively in the UU and DD datasets, as well as the UD and DU datasets, respectively (Supplementary Table S3).
We obtained 1541 PpS that positively correlated with Tyr352 (UUDD) and 515 PpS that negatively correlated with Tyr352 (UDDU), respectively (Supplementary Table S4). The top 40 UUDD PpS (with a frequency of ≥8 out of 22 datasets) and the top 24 UDDU PpS (with a frequency of ≥7 out of 18 datasets) are represented in (Fig. 3).
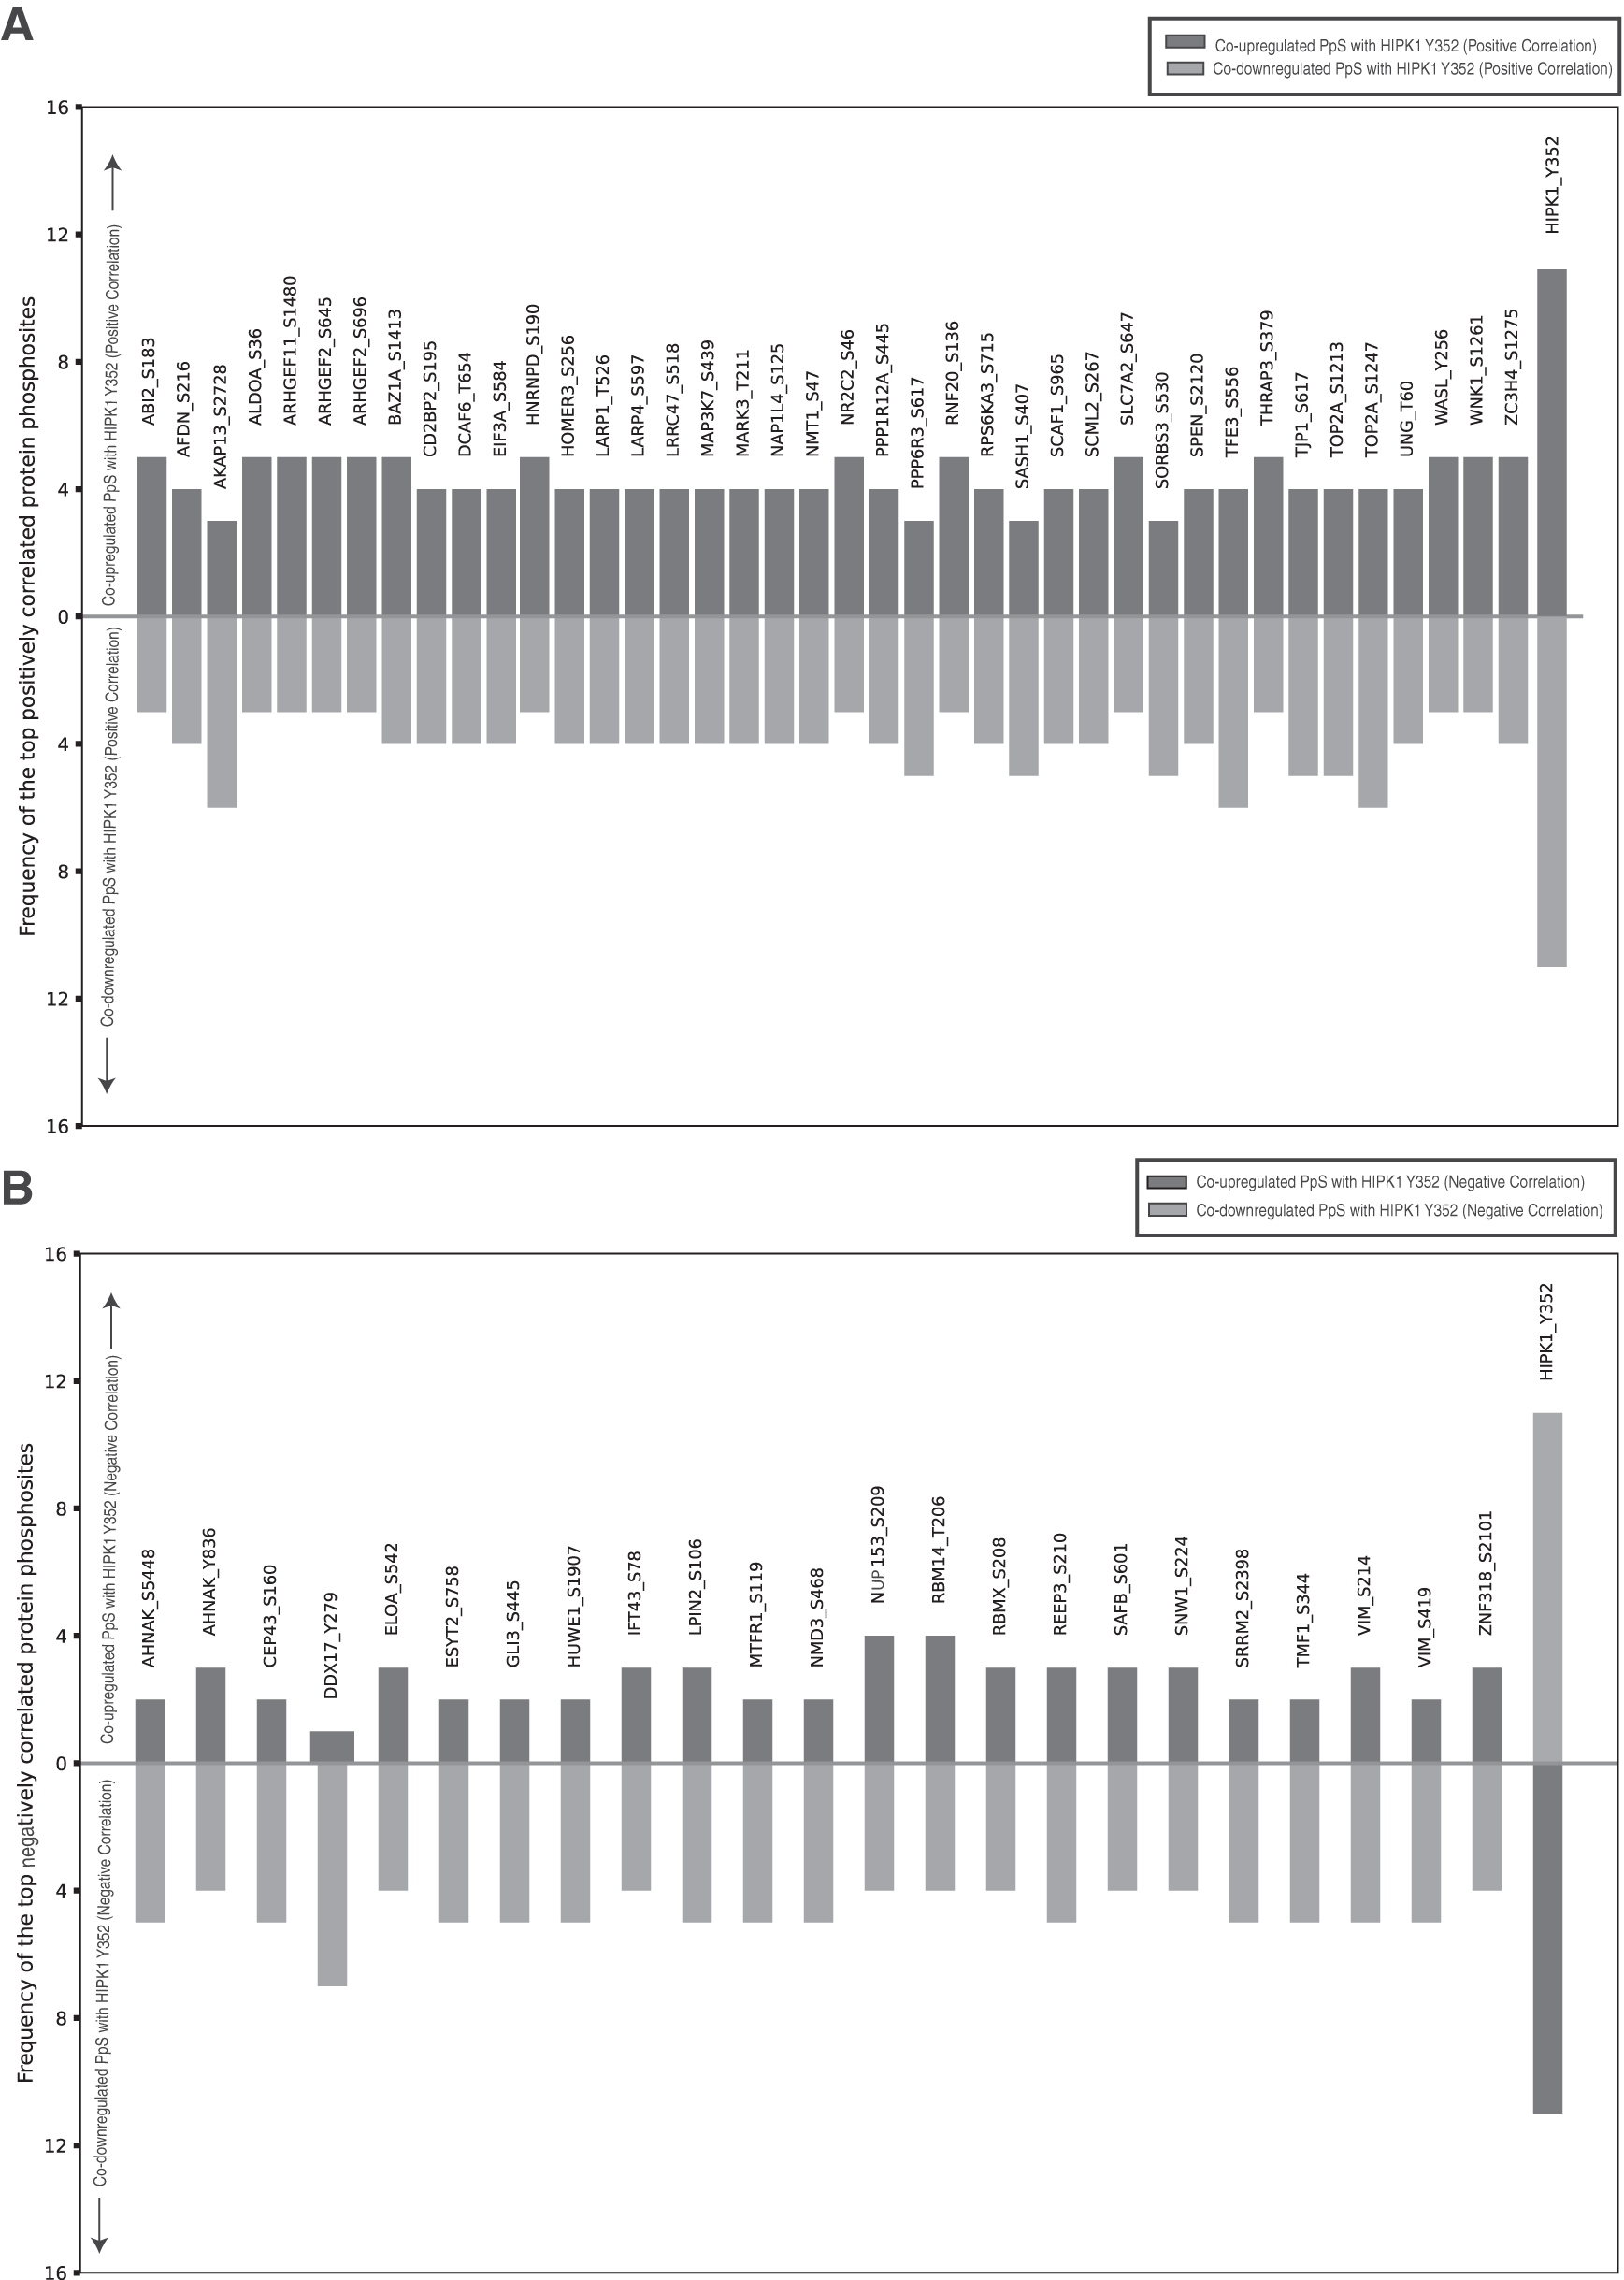
A bar graph represents the top correlation between HIPK1 Y352 and protein phosphorylation sites.
Functional Enrichment Analysis enriched proteins of these coregulated PpS into three major biological functions, such as regulation of RNA splicing, DNA-templated transcription, and cellular metabolic processes (Fig. 4) (Supplementary Table S6). The top correlated PpS, A-Kinase Anchoring Protein 13 (AKAP13) Ser2728, Transcription Factor Binding To IGHM Enhancer 3 (TFE3) Ser556, and DNA Topoisomerase II Alpha (TOP2A) pS1247 that showed positive correlation and DDX17 Tyr279 negative correlation with HIPK1 Tyr352 with high frequency were prominent in HER2+/HER2– cancer cell datasets (Huang et al., 2017).
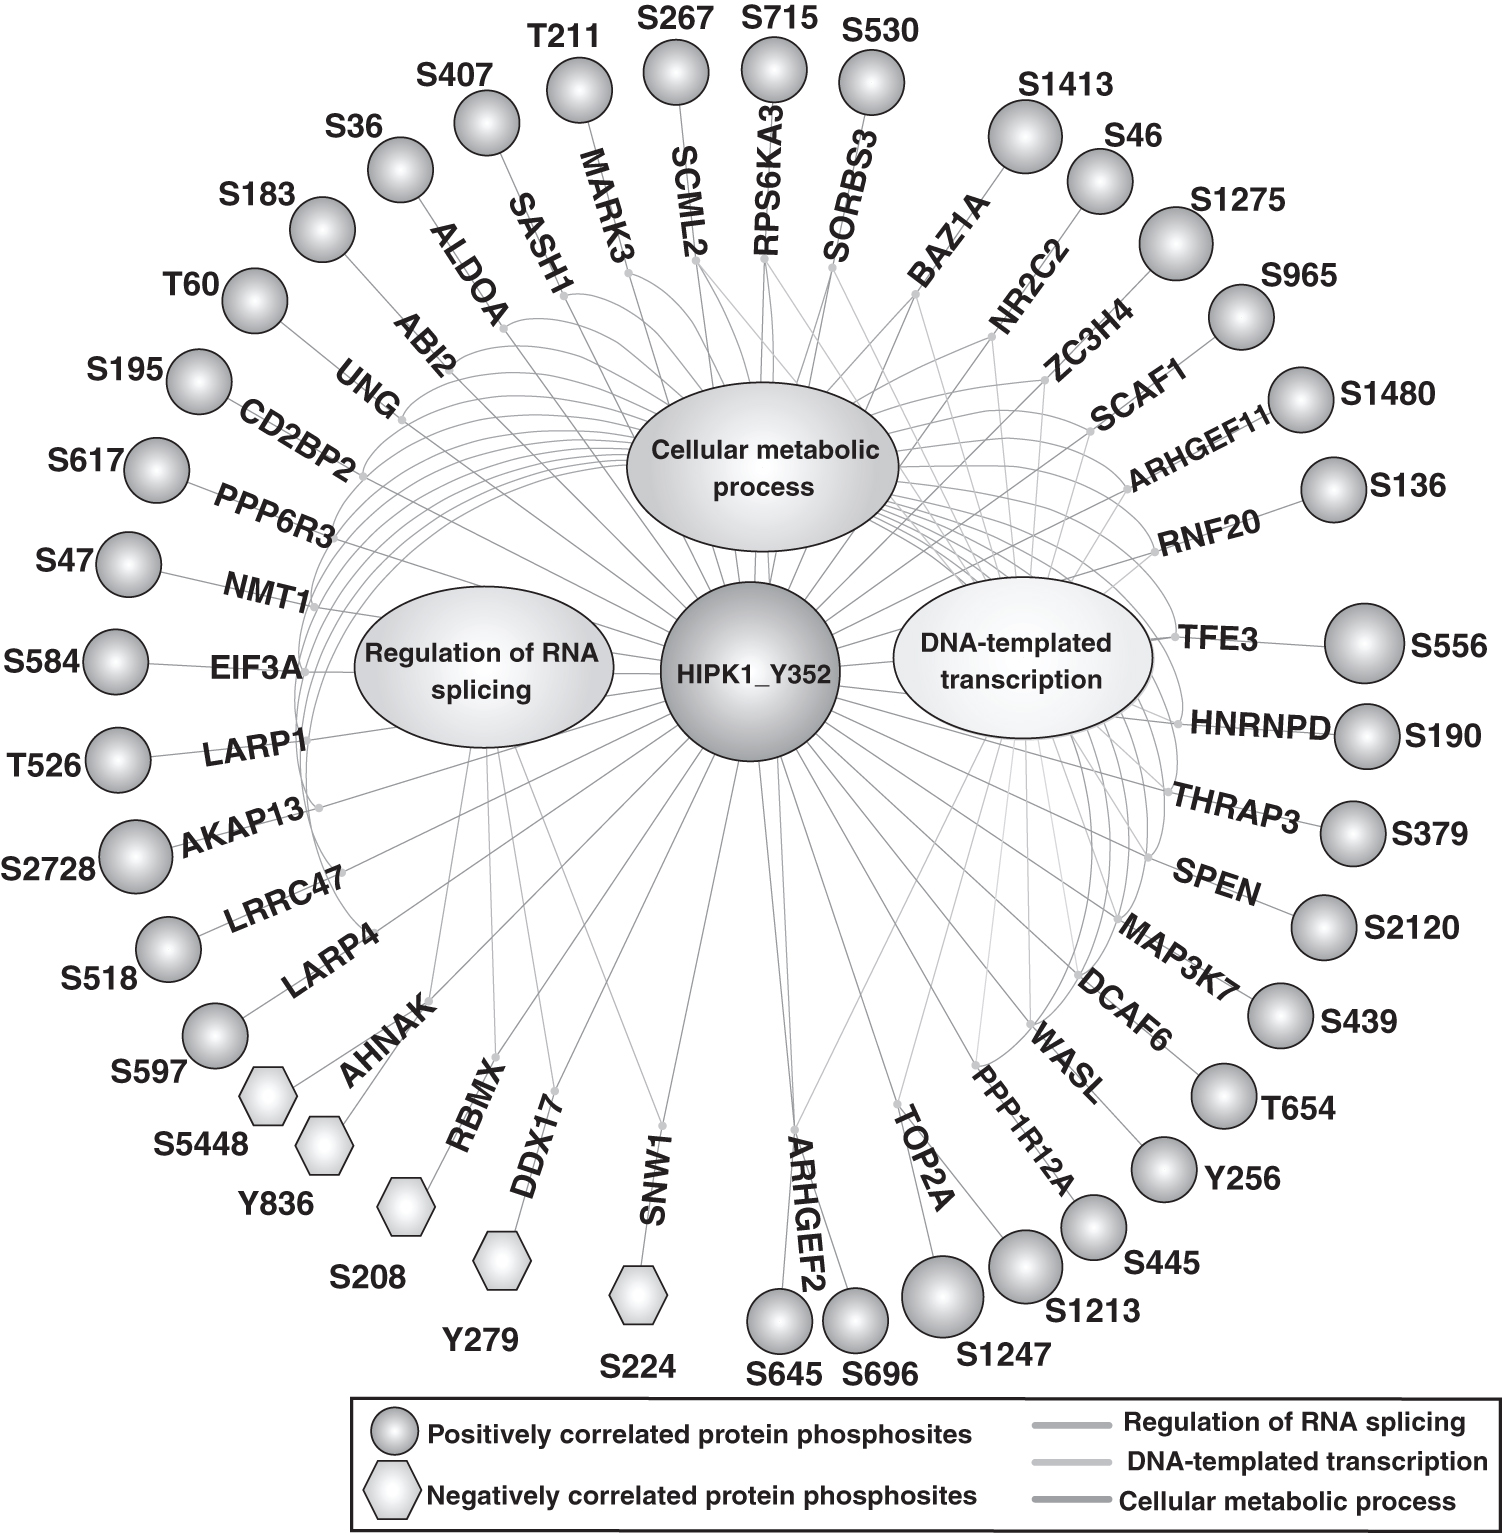
Functional enrichment analyses of HIPK1 Tyr352. Circular dendrogram representing the positive and negative coregulated proteins and their Gene Ontology-based gene set enrichment of biological processes. Significant biological processes associated with positive coregulated PpS within a cutoff ≥8 and negative coregulated PpS with a cutoff ≥7 in the regulation of RNA splicing, DNA-templated transcription, and cellular metabolic process.
Positively and negatively correlated HIPK1 Tyr352 PpS in protein–protein interactomes
Phosphorylation is a pivotal determinant of the interactions between proteins (Nishi et al., 2011). Hence, we analyzed the phosphosites of 32 known binary interactors and 3 protein complexes involving a total of 113 proteins associated with HIPK1 (Supplementary Tables S7 and S8). Among the binary interactors, we identified two interactors with phosphosites positively correlated with Tyr352 and three interactors with phosphosites negatively correlated with Tyr352. The Ser440 is a predominant phosphosite of protein Citron Rho-Interacting Serine/Threonine Kinase (CIT) interacting with HIPK1, and its positive correlation with HIPK1 Tyr352 status indicates potential enzyme–substrate relationships or mutual phosphosite dependency on their interaction. The clinical and experimental evidence shows that CIT may promote bladder cancer possibly through regulation of the cell cycle pathway (Liu et al., 2020). An investigation by Ecsedy et al. (2003) reported that HIPK1 is a component of the stress pathway involved in the phosphorylation of Death domain-associated protein (DAXX) at Ser669 to induce its nuclear–cytoplasmic shuttling to regulate cell growth and viability.
HIPK1 overexpressed in pancreatic cancer cells is known to induce the phosphorylation of Prostate-associated gene 4 (PAGE4) at Thr51 to modulate its interaction with Jun Proto-Oncogene (c-Jun), a key transcription factor associated with the stress–response system (Mooney et al., 2014). The present work provides additional insights on the role of Ser495 and Ser738 in DAXX, which positively and negatively correlated with HIPK1 Tyr352, respectively. In breast cancer cell lines, phosphorylation of DAXX Ser738 is associated with abnormal activation of signaling pathways downstream of HER2 (Huang et al., 2017). The study by de Graaf et al. (2014) also reported that phosphorylation of DAXX Ser495 leads to oncogene-induced senescence. In breast cancer cell lines, upregulation of Pre-MRNA Processing Factor 40 Homolog A (PRPF40A) involves Epidermal Growth Factor Receptor (EGFR)/Erb-B2 Receptor Tyrosine Kinase 2 (HER2) pathways (Imami et al., 2012). The study by Boeing et al. (2016) showed that the upregulation of PML Nuclear Body Scaffold (PML) in HEK293 cells is involved in DNA damage response.
In this study, we identified phosphosites in PRPF40A Thr932 and PML Ser527 that negatively correlated with HIPK1 Tyr352 indicating that these sites may be involved in the regulation of HER2 and oncogene-induced senescence (Huang et al., 2017; de Graaf et al., 2014). Many of these proteins were associated with specific biological processes or pathways suggesting the role of HIPK1 in cancers and that HIPK1 may serve as a molecular target for therapy (Fig. 5A). Similarly, we found a significant number of proteins within the complexes that exhibited either positive or negative correlations with HIPK1 Tyr352 within three sets of complexes (Complex1–3). Complex 1 consisted of Alpha-2-Macroglobulin (A2M) and HCLS1 Associated Protein X-1 (HAX1) proteins are involved in growth factor, and cytokine binding, whereas, complex 2 was categorized on macromolecule metabolic process and complex 3 on protein phosphatase regulator activity. In Complex 3, the studies showed that Myocardin-Related Transcription Factor B (MRTFB) plays a major role as a transcriptional coactivator of serum response factor (SRF) and Zyxin (ZYX) plays a role in the development and progression of breast cancer (Partynska et al., 2020).
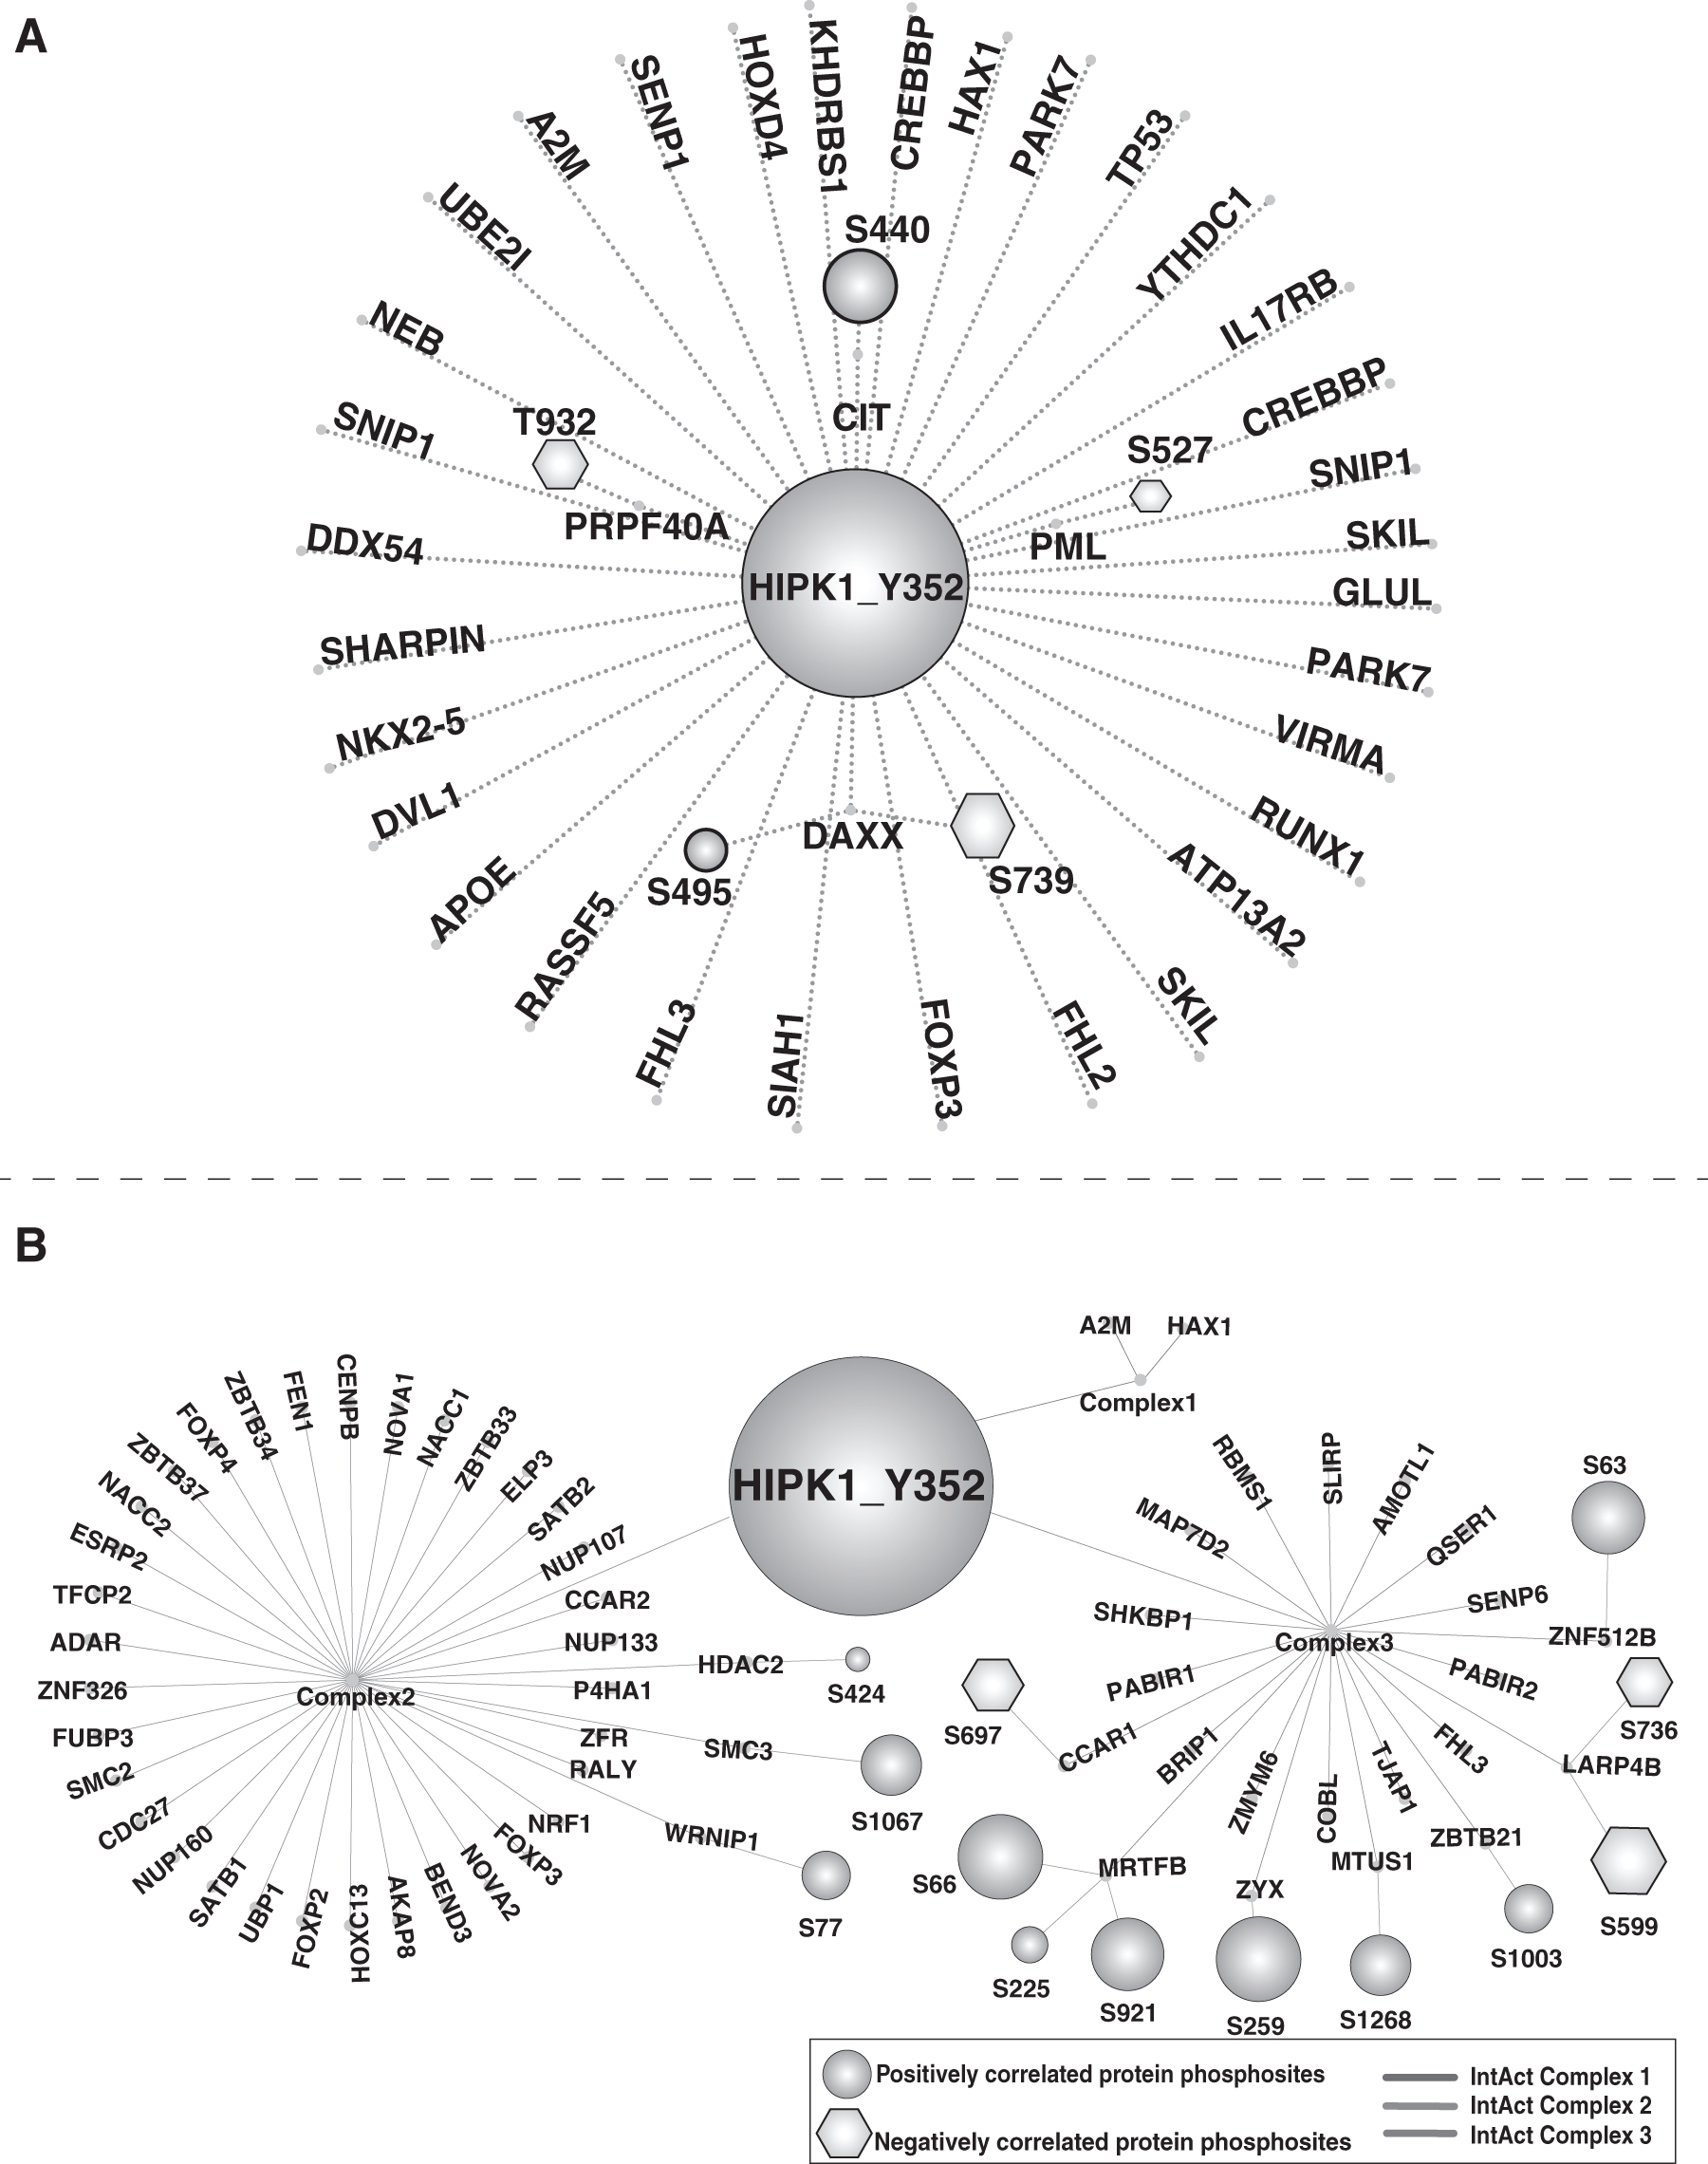
Coregulator network of HIPK1 Y352 interactors.
Phosphosites in these proteins could potentially influence the formation or dynamic regulation of these complexes with HIPK1 by guilt-by-correlation-in-expression (Fig. 5B).
HIPK1 Tyr352 correlated phosphosites of experimentally validated and predicted substrates
We conducted an analysis incorporating both experimentally validated and predicted substrates. There were three experimentally validated substrates, such as Methyl-CpG-Binding Protein 2 (MECP2) at Ser80, DAXX at Ser66, and PAGE4 at Thr51. There were 7589 HIPK1 substrates predicted by NetworKIN/AKID (Linding et al., 2008; Parca et al., 2019). In addition to these predictions, we incorporated data from two other sources. The iKiP-DB contributed 46 potential substrates (referred to as PpS), while Johnson et al. (2023) provided a dataset of 8790 potential substrates for our analysis.
We did not observe any significant correlation between the three known substrate phosphosites and the 46 substrates identified through high-throughput screening. However, 155 PpS predicted by NetworkIN and AKID exhibited correlations as predicted substrates of HIPK1 (Supplementary Tabel S9). Among these, 37 showed a positive correlation (with a frequency of ≥6), and 35 displayed a negative correlation (with a frequency of ≥6) whenever detected with HIPK1 Tyr352 (Fig. 6A). These also included Ser1298 and Ser2271 phosphosites of MAP1B, which showed positive and negative correlation, respectively, and the Ser41 in BCL3 that positively correlated with HIPK1 Tyr352. These PpS were associated with the regulation in HER2+/HER2– breast cancer cell lines (Huang et al., 2017). Notably, Microtubule-Associated Protein 1B (MAP1B) is established to play an important role in axonal growth and synapse maturation during brain development (Yang et al., 2012). BCL3 Transcription Coactivator (BCL3) plays an important role in breast cancer (Mertins et al., 2016, 2014).
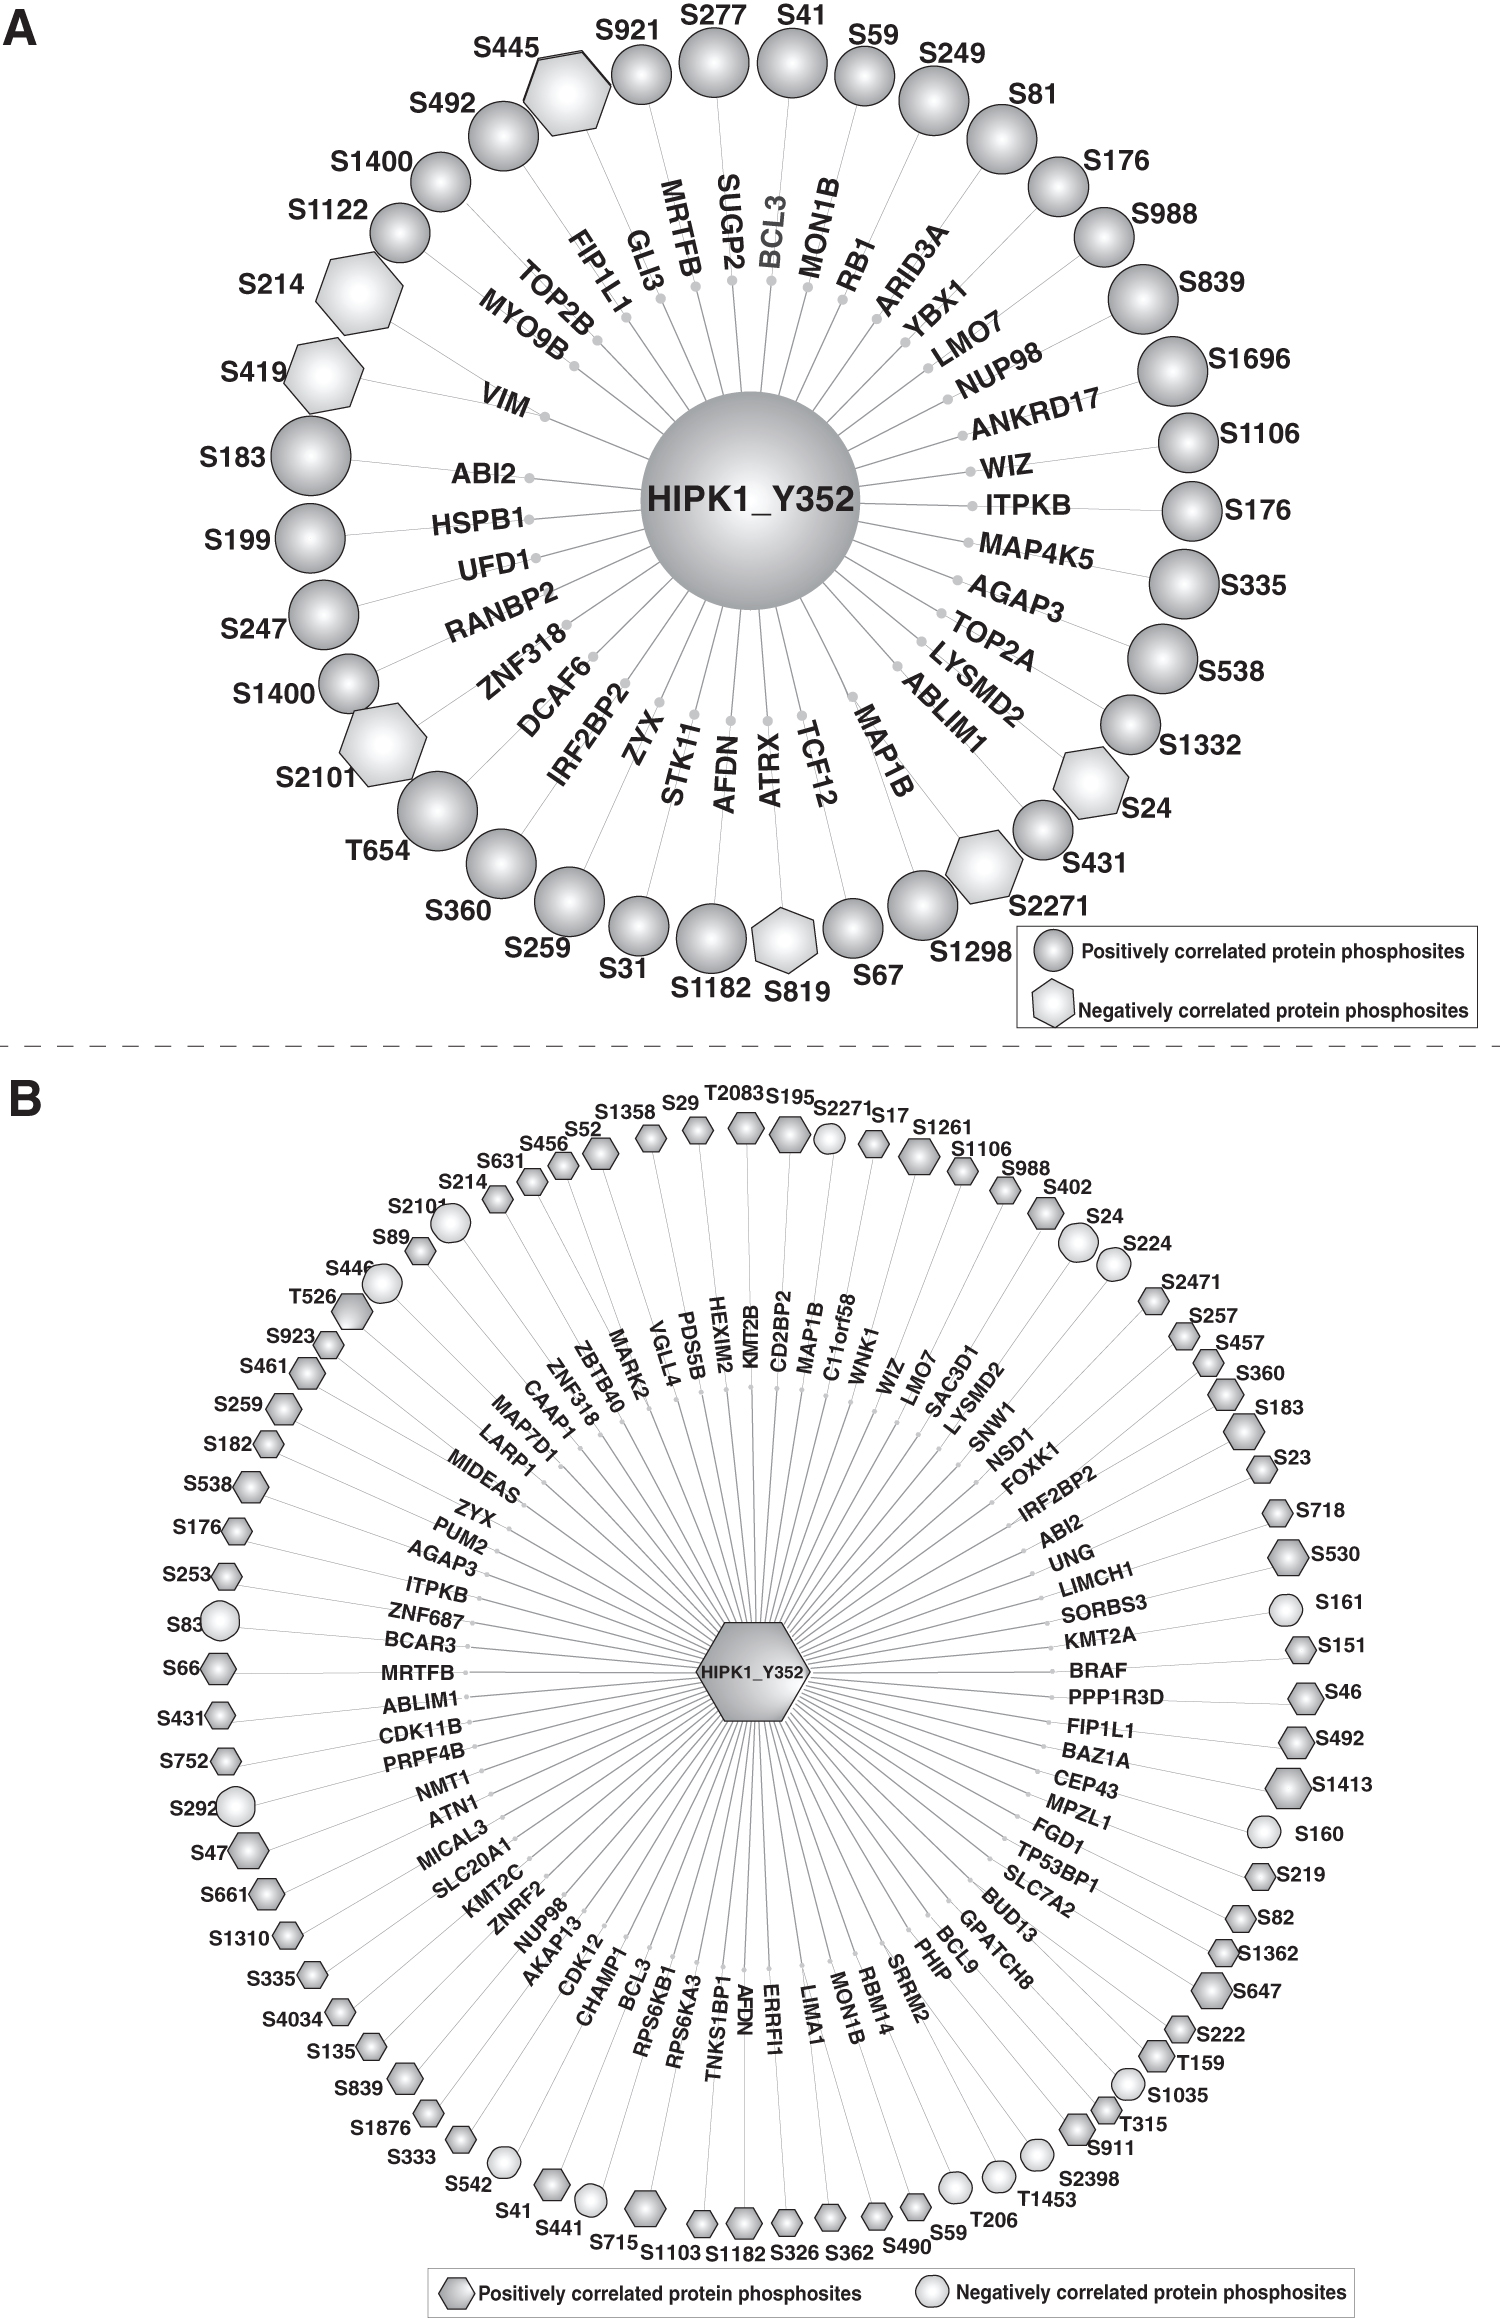
Network of predicted downstream substrates with HIPK1 Tyr352.
The study by Johnson et al. (2023) aimed to determine the optimal substrate specificity of the human Ser/Thr kinome and investigate the relationships between kinases based on their phosphomotifs. Considering this as a key dataset, we analyzed the correlation pattern of predicted substrates of HIPK1 with Tyr352. We identified 268 PpS that exhibited correlations as predicted substrates of HIPK1 (Supplementary Table S9) (Johnson et al., 2023). Among these, 77 showed a positive correlation (with a frequency of ≥6), and 71 showed a negative correlation (with a frequency of ≥6) whenever it was detected with HIPK1 Tyr352 (Fig. 6B). These positively correlated phosphosites could be prioritized for validation as potential substrates of HIPK1. Among the top PpS, the Ser1413 phosphosite in the protein, Bromodomain Adjacent to Zinc Finger Domain 1A (BAZ1A), which is involved in Cbl-dependent regulation of neuroblastoma cell function and HER2 regulation, showed a positive correlation (Pedersen et al., 2021; Huang et al., 2017). The PpS Thr206 in the RNA-Binding Motif Protein 14 (RBM14) protein, which plays a role in RSK signaling and HER2 regulation showed a negative correlation (Galan et al., 2014; Huang et al., 2017).
These substrates associated with cancers currently correlate with the most prominent phosphosite in HIPK1, and may indeed be influenced by the regulation of HIPK1 Tyr352.
Coregulated kinase signaling modules with the HIPK1 (Tyr352)
In general, numerous signaling modules coexist within cells and potentially interact with each other. However, these modules have not been visualized on a global scale thus far. Typically, in the analysis of global phosphoproteomics datasets, the focus has been on substrates or interactors at their protein level. In this study, we categorized the phosphosites in kinases based on their positive or negative correlations with HIPK1 Tyr352. We found phosphosites in 100 kinases exhibited a positive correlation, while phosphosites in 27 kinases showed a negative correlation with Tyr352. These findings were derived from the positive and negative correlated datasets of Tyr352 and were visualized in a circular dendrogram, using a cutoff of a minimum of 4 dataset frequencies, as depicted in Figure 7 (Supplementary Table S10).

Network of kinases coregulated with HIPK1 Tyr352. Circular dendrogram representing top positively and negatively correlated kinase networking of HIPK1. Positively and negatively correlated kinase with respect to Tyr352 (frequency ≥4). The size of a node depends on the frequency observed in the datasets.
The HIPK1 Tyr352 showed a negative correlation with activation sites of EGFR (Tyr1197), Ribosomal Protein S6 Kinase A1 (RPS6KA1) (Ser363), and Mitogen-Activated Protein Kinase 3 (MAPK3) (Thr202). However, it showed a positive correlation with Erb-B2 Receptor Tyrosine Kinase 2 (ERBB2/HER2) (Ser1083, Ser1107, Thr1166) and Erb-B2 Receptor Tyrosine Kinase 3 (ERBB3) (Ser982) (Huang et al., 2017). These positively correlated phosphosites in ERBB2 or ERBB3 are currently not associated with any functions, however, their HIPK1 Tyr352-correlated expression in HER2+ versus HER2– breast cancer cells substantiate the specific role of HIPK1 Tyr352 in the HER2 signaling pathway. This is further exemplified by a recent finding by Hayat et al. (2023) that HIPK1 Tyr352 is upregulated when HER2 expression is induced in MCF7 normal epithelial cells. Significantly, they identified that HER2 expression prominently drives transcriptional regulation as identified through our analysis of its correlated phosphosites. In general, by guilt-by-correlation-in-expression, these phosphosites in kinases could be associated with dynamic regulation of signaling networks associated with HIPK1.
HIPK1 Tyr352 is upregulated in distinct cancers
HIPK1 Tyr352 was reported to be upregulated in multiple HER2+ cell lines compared with HER2– breast cancer cell lines (AU565 vs. MDA-MB-231, AU565 vs. T47D, and HCC1954 vs. HCC1500). Park et al. (2012) have shown that HIPK1 is frequently upregulated in grade III HER2+, ER–, PR–, highly proliferative, and molecular apocrine breast tumors. In these tissues, HIPK1 showed nuclear or cytoplasmic, and both nuclear and cytoplasmic localization patterns and is proposed to play different roles accordingly (Park et al., 2012). Indeed, Tyr361 in HIPK2 conserved to HIPK1 Tyr352 is currently associated with intracellular localization (Polonio-Vallon et al., 2014; Saul et al., 2013) and hence, exemplifies the relevance of HIPK1 Tyr352. HIPK3 transcripts are also identified to be upregulated at the mRNA level in triple-negative breast cancer (TNBC) cells and tissues compared with ER-PR-HER2+ breast cancers (Eswaran et al., 2012; Raju et al., 2014). Our further extended search of tissue-level phosphoproteome datasets illuminated the role of HIPK1 Tyr352 in other cancers such as pancreatic ductal carcinoma and extrahepatic cholangiocarcinoma.
Specifically, phosphoproteome analysis of 12 pancreatic ductal adenocarcinoma patients by Britton et al. (2014) has identified >1.3-fold upregulation of HIPK1 Tyr352 in 8 patients. Furthermore, Lu et al. (2022) have also identified the upregulation of HIPK1 Tyr352 in two out of the four extrahepatic cholangiocarcinoma tissues in patients without chemotherapy or radiotherapy when compared with normal adjacent tissues.
Conclusions
Taken together, we carried out a comprehensive analysis of the phosphoproteomics datasets to derive the prominent phosphosites regulated in the understudied human kinase, HIPK1. We report, in this study, PpS that positively or negatively correlate with the predominant phosphosite in HIPK1 and Tyr352, across various biological conditions. These findings provide a foundation for understanding the potential regulatory roles of Tyr352 in different cellular contexts contributing to the HIPK1 functional network.
Notably, a large number of phosphosites in proteins are unexplored, and further validation of these sites will help in elucidating their functional role in various diseases/disorders. In this study, we propose the potential of HIPK1 Tyr352 as a molecular target for cancers such as HER2+ breast cancers and pancreatic ductal carcinomas for kinase-domain-based or phosphorylation-directed therapeutic approaches.
Finally, the approach undertaken in this study can contribute to the broader field of kinase research and provide a framework for exploring the functional significance of phosphosite in other proteins that correlate with HIPK1 and also provide a promising platform for the analysis and evaluation of targeted therapeutics for disorders associated with the dysregulation of the HIPK1 kinase.
Footnotes
Acknowledgment
The authors acknowledge Yenepoya (deemed to be) University for providing infrastructure for the Centre for Integrative Omics Data Science.
Authors' Contributions
D.S.: Data curation, Analysis, Data visualization, Methodology, and Article writing; M.G: Data curation and Article reviewing; L.J.: Data curation and Data visualization; A.P.G.: Data curation and Article reviewing; P.P.: Data mapping; S.M.: Data curation; T.Y.: Data curation; M.N.1 and M.N.2: Data mapping and visualization; S.K.: Article reviewing and editing; R.D.A.B.: Conceptualization, Methodology, Data analysis and visualization, and Article reviewing; R.R.: Conceptualization, Execution, Methodology, Data analysis, and Article reviewing.
Author Disclosure Statement
The authors declare they have no conflicting financial interests.
Funding Information
No funding was received for this study.

Abbreviations Used
References
Supplementary Material
Please find the following supplemental material available below.
For Open Access articles published under a Creative Commons License, all supplemental material carries the same license as the article it is associated with.
For non-Open Access articles published, all supplemental material carries a non-exclusive license, and permission requests for re-use of supplemental material or any part of supplemental material shall be sent directly to the copyright owner as specified in the copyright notice associated with the article.
