




Abstract
Levan is a fructan polymer with many industrial applications such as the formulation of hydrogels, drug delivery, and wound healing, among others. To this end, metabolic systems engineering is a valuable method to improve the yield of a specific metabolite in a wide range of bacterial and eukaryotic organisms. In this study, we report a systems biology approach integrating genomics data for the Bacillus subtilis model, wherein the metabolic pathway for levan biosynthesis is unpacked. We analyzed a revised genome-scale enzyme-constrained metabolic model (ecGEM) and performed simulations to increase levan biopolymer production capacity in B. subtilis. We used the model ec_iYO844_lvn to (1) identify the essential genes and bottlenecks in levan production, and (2) specifically design an engineered B. subtilis strain capable of producing higher levan yields. The FBA and FVA analysis showed the maximal growth rate of the organism up to 0.624 hr−1 at 20 mmol gDw−1 hr−1 of sucrose intake. Gene knockout analyses were performed to identify gene knockout targets to increase the levan flux in B. subtilis. Importantly, we found that the pgk and ctaD genes are the two target genes for the knockout. The perturbation of these two genes has flux gains for levan production reactions with 1.3- and 1.4-fold the relative flux span in the mutant strains, respectively, compared to the wild type. In all, this work identifies the bottlenecks in the production of levan and possible ways to overcome them. Our results provide deeper insights on the bacterium's physiology and new avenues for strain engineering.
Introduction
Fructans are fructose-based polysaccharides in archaea, bacteria, fungi, and plants. Fructosyltransferase enzymes synthesize fructans using sucrose and sucrose-based substrates. These fructans are connected by β-2,1 or β-2,6 linkages, forming fructosyl oligosaccharides (Ritsema and Smeekens, 2003; Vijn and Smeekens, 1999). Levan, a fructan connected by β-2,6 glycosidic linkage, is gaining attention due to its health and commercial applications in the pharmaceutical, food, medical, personal care, and aquaculture sectors (Arvidson et al., 2006).
Levan is a fructosyl homopolysaccharide synthesized through the hydrolysis of sucrose using the levansucrase (SacB) enzyme (Öner et al., 2016; Santos-Moriano et al., 2015). It is a soluble biopolymer capable of forming nanostructures. Levan is widely used as an emulsifier, stabilizer, thickener, encapsulating agent, food and feed additive, osmoregulator, and cryoprotectant, among others (Jakob et al., 2013; Sezer et al., 2017; Srikanth et al., 2015). Levan is produced by a wide range of microorganisms and a few plant species.
However, the characteristic chain length of the polymer depends on the levan-producing organism. For example, some bacteria can produce levan over 500 kDa in size (Ortiz-Soto et al., 2019; Ritsema and Smeekens, 2003). The levan forms nano-sized spheres with a low intrinsic viscosity than its linear fructosyl polymer counterparts. Depending on the production conditions, the levan differs significantly by molecular weight, intrinsic viscosity, degree of branching, and so on (de Siqueira and Toksoy Öner, 2023).
A comprehensive review of levan is discussed elsewhere (Srikanth et al., 2015). Commercial production of levan is achieved using microbial sources, which have several limiting factors in achieving the maximal yield. Specifically, yield is severely affected by the high cost of production, even for low quantity (Öner et al., 2016).
B. subtilis has been an industrial chassis for many years, while the genes and pathways of the organism have been well established (Stülke et al., 2023). Compared to other bacterial sources, B. subtilis has the highest levan yield (de Siqueira and Toksoy Öner, 2023). Recent studies (Chidambaram et al., 2019; Veerapandian et al., 2023a; Veerapandian et al., 2023b; Veerapandian et al., 2020) showed that the high yields of levan from B. subtilis MTCC 441 were due to constant supplement of the sucrose in a fed batch reactor.
Herein, we used a systems biology approach to identify the bottlenecks to increase levan yield and explored the possibility of strain optimization. It is noteworthy in the previous reports of computational modeling in B. subtilis that a stoichiometric model of the B. subtilis was constructed as early as 1998 with the flux toward the central glycolysis pathway (Dauner and Sauer, 2001). Later in 2007, the whole genome model of B. subtilis iYO884 was constructed with the growth rate of the model comparable with the experimental values (Oh et al., 2007). Incorporation of the enzyme constraints into the iYO844 model improved the prediction capacity in the model ec_iYO844.
Specifically, this model predicts the growth flux value with a lower error rate than the previous iYO844 model (Massaiu et al., 2019). Thus, we adopted the same ec_iYO844 model in this study to systematically analyze and identify potential engineering strategies for enhancing levan production. We identified the single and double knockout targets for high-yield production of levan compared with the wild-type strain. Our approach aimed to investigate the levan production yield and metabolic behavior of B. subtilis under specific growth conditions and substrate availability, such as sucrose, glucose, fructose, and oxygen. Our results provide valuable insights into the cellular metabolic network and responses to environmental changes. Such analyses can enhance our understanding of the bacterium's physiology and aid in strain engineering.
Materials and Methods
The study was conducted under the overall research ethics oversight of the authors' institutions.
sac and lev gene collection
The current ec_iYO844 model does not include the sac and lev operon, where the sac operon has multiple genes associated with sucrose and levan. The gene list information of the sac operon was obtained from the subtiwiki (http://subtiwiki.uni-goettingen.de/) (Pedreira et al., 2022), and the sac genes were cross-verified with the UniProt database (www.uniprot.org/) with gene functional roles (Bateman et al., 2023). We confirmed the sac operon's gene locations and gene clusters in GenBank (www.ncbi.nlm.nih.gov/datasets/gene/) (Clark et al., 2016). Subsequently, the gene clusters were built with gene neighborhood information described by Barabasi and Palsson (Barabási and Oltvai, 2004; Mahadevan and Palsson, 2005). In addition, the minimal pathway network was constructed with the sac enzymes and metabolic information from the KEGG database (Kanehisa et al., 2016).
Incorporation of sac genes and reactions into the genome-scale metabolic model
To perform constraint-based metabolic modeling for the genome-scale model, we used the ec_iYO844 model from https://github.com/biosustain/ec_iYO844 (Oh et al., 2007). The model was then used in COBRA Toolbox 3.1 in MATLAB 2019b framework (Heirendt et al., 2019). The growth simulation was checked under glucose as a carbon source and oxygen at default values. The gaps in the sucrose utilization reactions were identified, and the model was incorporated with the missing sac operon reactions and genes using the “addReactions” function. Flux for the biomass was verified using the “changeRxnBounds” function to sucrose exchange (Ex_sucr[e]) as the sole carbon source with an uptake rate of 20 mmol gDW−1 hr−1 per unit biomass weight and time in aerobic conditions. The modified model is labeled as ec_iYO844_lvn model in this study. For further analysis, we used this sac gene incorporated model (ec_iYO844_lvn) with sucrose as a source substrate.
The matrix with rows as metabolites and columns as reactions was represented by the S matrix (labeled S). In this model, when compared with its precursor ec_IYO844 model (Table 1), we observed that subsets of metabolites exhibit a higher degree of connectivity. However, most metabolites involve a relatively smaller number of reactions. These highly linked metabolites possess a global nature and are involved in several reactions. For example, ATP, a critical metabolite, has a higher connectivity. The metabolites levan and sucrose participate in three reactions (Supplementary Fig. S1). We also used various carbon sources, such as glucose, sucrose, fructose, acetate, acetaldehyde, ethanol, fumarate, lactate, malate, pyruvate, succinate, and 2-oxoglutarate, for analysis.
The Comparison Between the ec_iYO844 and ec_iYO844_lvn_Incorporated Model Components
The model ec_iYO844 that we took for our analysis consists of 844 genes, involved in 1250 reactions, and 990 metabolites. With the addition of the levan biosynthesis genes, metabolites, and reactions, the modified model now consists of 847 genes, involved in 1270 reactions, and 990 metabolites. We refer to this modified model as “ec_iYO844_lvn” in this work.
In addition to the above, we used the CAVE web server (https://cave.biodesign.ac.cn/) to verify the synthesis of biomass precursor metabolites and the net flux yield (Mao et al., 2023). The resultant flux for each biomass precursor metabolite is provided in Supplementary Table S1.
Robustness analysis
Robustness is the ability of the cell to perform under different environmental conditions at different concentrations of input substrate (Edwards and Palsson, 2000). Thus, we estimated the changes in the objective function's flux value when there is a change in the flux value for an individual reaction. In other words, robustness analysis tells us the quantifiable relationship between the reactions and the objective function. We used “robustnessAnalysis” function to generate a plot indicating the relationship between the flux value of the objective function and the control reaction, where the change of objective flux along with the control reaction flux (specified by “controlRxn”) indicates the robustness of the model from input substrate flux changes.
Phenotypic phase plane analysis
For any given model, the optimal response to changing the carbon sources and oxygen can be studied by phenotypic phase plane analysis. It is performed by simultaneously varying uptake values of the two different substrates (Bell and Palsson, 2005; Edwards et al., 2002). Two nested loops were applied for the pairs of substrates glucose and oxygen, sucrose and oxygen, fructose and sucrose, and glucose and sucrose. Each reaction's metabolite uptake reaction values varied from 0 to 20 mmol gDW−1 hr−1. Using this analysis, the relationship between the input substrate and their contribution toward the growth was identified, and maximal growth conditions using low levels of two unique substrates were calculated.
Flux balance and variability analysis
Assuming a steady-state condition, the metabolite's flow through the network was analyzed using Flux Balance Analysis (FBA). FBA provides the objective function and flux values of other reactions in the model. A detailed review of FBA can be seen in Orth et al., 2010. In this study, the biomass reaction “BS_Biomass_10” was set as the objective function (“optimizeCbModel”). Once the maximal growth rate was identified, the levan production reaction “LVN” was set as the objective function in the COBRA Toolbox. More details of the objective functions are given in the Supplementary Data. The Flux Variability Analysis (FVA) was applied to the model by fixing the sucrose uptake rate at 20 mmol gDW−1 hr−1. The optimizeCbModel (model, “min”) and optimizeCbModel (model, “max”) functions were used to identify the maximum and minimum possible fluxes of the model (Mahadevan and Schilling, 2003).
Gene knockout analysis
Gene knockout analysis was performed for the complete list of 847 genes present in the ec_iYO844_lvn model with biomass as the objective function. The process was carried out using the “deleteModelGenes” function to knock out single-gene targets. The double-gene knockouts were identified using the “doubleGeneDeletion” function. Thus, we identified the gene pairs with overlapping functions. Specifically, we can identify the genes that would compensate for the function during the single-gene knockout analysis.
OptFlux gene knockout analysis
We identified gene knockouts using OptFlux (Rocha et al., 2010), following the protocol reported by Aydin et al. (2018). Possible gene knockouts were determined using three different algorithms, namely, Strength Pareto Evolutionary Algorithm (SPEA2), Evolutionary Algorithm (EA), and Simulating Annealing (SA). Specifically, we used the objective functions biomass-product couple yield (BCPY) and product yield with minimum biomass (YIELD), resulting in six sets of gene knockout data. The aim of using OptFlux was to optimize levan production by identifying gene knockouts. Repeated knockouts above 30% were considered possible targets.
Fluxer
To verify the knockout results obtained, we used the Fluxer online server (https://fluxer.umbc.edu/). The Fluxer server identifies the shortest k path lengths from initial substrate sucrose to the biomass growth objective function (Hari and Lobo, 2020). The k value corresponds to the five major pathways involved, and subsequently, the direct pathway was identified.
Data availability
The model and its associated data files are publicly available at: https://github.com/raghuyennamalli/levan_biosynthesis
Results and Discussion
Metabolic systems engineering is a pivotal method for levan biosynthesis specifically, and improving the product metabolic yield in a wide range of bacterial and eukaryotic organisms more generally. In this study, we report a systems biology approach integrating genomics and metabolomics data for the Bacillus subtilis model, wherein the metabolic pathway for levan biosynthesis is unpacked. Herein, we report on and contextualize our findings in regard to the broader literature and with an eye to future potential applications in diverse sectors.
Levan is one of the natural polymers synthesized by B. subtilis, by using sucrose. It is a single-step reaction carried out by SacB enzyme by hydrolyzing the sucrose to glucose and fructose, where the latter is polymerized to β-2,6 fructosyl linkage, thereby forming the levan polymer, an exopolysaccharide (EPS). The sac and lev genes encode the enzymes, which are involved in regulation, transport of fructose, levan production, and degradation. The sac operon is activated by the presence of sucrose and lev operon is activated in the presence of fructose. The sac operon comprising seven genes (sacA, sacB, sacC, sacP, sacT, sacX, and sacY) is present in various regions of B. subtilis genome. Each protein of the sac and lev operon has various functions as repressor, activators, transporters, and process enzymes.
Based on the position of sac genes in the genome assembly with the intergenic spacing, we have divided them into four major clusters (Fig. 1A). The gene components of cluster 1 contains six of lev operon genes that help in the transfer of fructose monomeric units released from levan polymer into the cells. This cluster contains genes from sac and lev group, where the first gene of the sac group we encounter in the genome is the sacC gene, which codes for the levanase enzyme that has an exo-levanase activity. It binds to levan and breaks down the ends of levan polymer as long as three fructose units into fructan monomers, which are then utilized by the cells as a nutrient source (Wanker et al., 1995). The levR gene functions as a regulator and levD, levE, levF, and levG for transporting the fructose monomers into the cell.
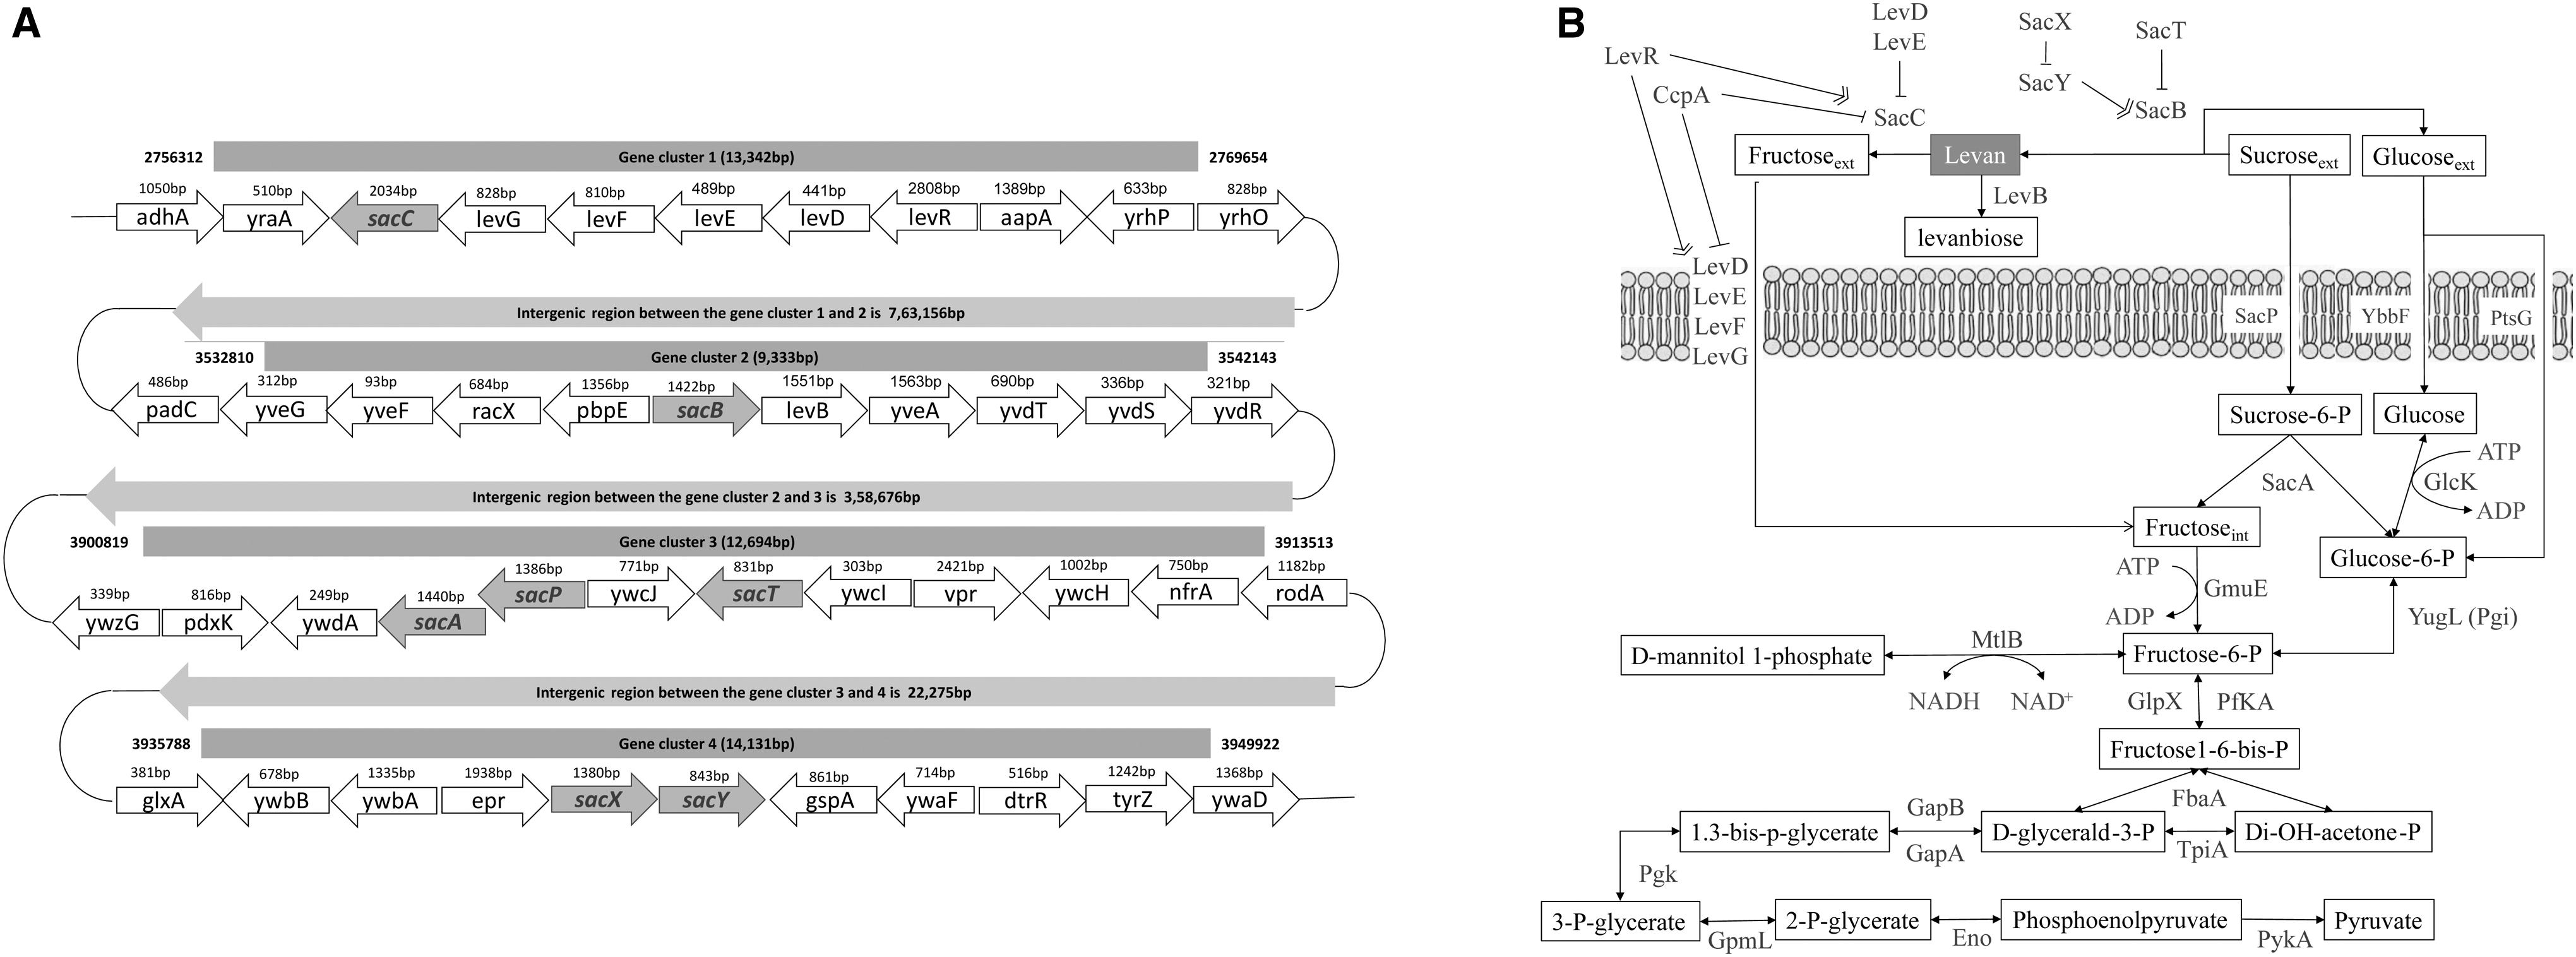
sac and lev genes and its associated metabolic pathway.
Also, the intergenic space between the clusters 1 and 2 are largest with 7,62,671 base pairs. Gene cluster 2 contains an important sacB gene, which codes for the extracellular enzyme levansucrase that converts the sucrose to synthesize the levan polymer and release glucose as a by-product. The gene cluster contains only one enzyme from the lev group, which attaches to the cell membrane with endo-levanase activity by catalyzing the breakdown of levan into levanbiose (difructose). Gene cluster 3 contains regulatory genes encoding three enzymes of the sac group function as regulators, namely sacA, sacP, and sacT. These enzymes are capable of interacting with each other to regulate the sacB operon genes. The gene cluster 4 contains a pair of sacX and sacY genes that code for functionally homologous proteins SacX and SacY, which negatively regulate each other based on the presence of sucrose (Fig. 1B).
Our goal is to identify the critical metabolites of the levan production network. Hence, the levan production pathway starts with sucrose as the sole substrate in B. subtilis. The levansucrase (SacB) enzyme hydrolyzes one molecule of sucrose to form one molecule of glucose and fructose; the fructose is polymerized to β-2-6 fructosyl linkage, thereby forming the levan polymer. The product glucose from the levansucrase reaction is utilized by the cell for cellular growth. Thus, glucose is transported into the cell by both phototransferase system (PTS) and non-PTS system by the enzymes SacP, YbbF, and PtsG and connected to glycolysis. Two enzymes capable of breaking down the levan into fructose units are SacC and LevB. The monomeric fructose is transported by LevD, LevE, LevF, and LevG transport enzymes.
In silico growth of B. subtilis using various carbon sources
The ec_iYO844_lvn model (Fig. 1B and Table 1) was tested against different sources of carbon, such as glucose, sucrose, fructose, acetate, acetaldehyde, ethanol, fumarate, lactate, malate, pyruvate, succinate, and 2-oxoglutarate. The growth flux of the model with the various substrates was cross validated from the available experimental results, keeping the biomass as the objective function. We observed that the model produced a similar growth rate of 0.6242 hr−1 for glucose and sucrose after the addition of levan reactions. The results indicate that the levan reactions are important for the model's capability to uptake sucrose. The results are tabulated in Supplementary Table S2. This is in line with the previous work (Veerapandian et al., 2020), where sucrose was used as the sole carbon source for the optimal growth of B. subtilis and production of levan.
In addition, we used CAVE (https://cave.biodesign.ac.cn/) to identify if the flux flows toward the biomass precursors after the addition of sac and lev genes. The results confirmed the metabolic flux carrying capacity of the 56 biomass precursors. The total flux for each biomass precursor is shown in Supplementary Table S1.
Robustness analysis for native levan reaction
We compared the biomass growth rate in relation to levan production for robustness analysis. This comparison will help to identify the ideal flux flow through a reaction for levan production and biomass production. When the flux of levan and biomass was maximized, the sucrose uptake was measured at a flux value of 6 hr−1, showing a maximum growth rate of 0.624 hr−1 (Supplementary Fig. S2).
Phenotypic phase plane analysis
Two exchange parameters sucrose and oxygen were simultaneously varied between the range of 0 mmol gDw−1 hr−1 to 20 mmol gDw−1 hr−1 to determine the phenotypic phase plane. The phenotypic phase plane provides the maximum growth with the optimal amount of the substrate provided. It was performed among pairs of exchange metabolites such as glucose and oxygen, and fructose and oxygen. We observed that sucrose and oxygen have relatively higher biomass growth at lower concentrations. Specifically, the maximal growth was reached at oxygen and sucrose concentrations of 5 mmol gDW−1 hr−1 and 18 mmol gDW−1 hr−1, respectively (Fig. 2). This indicates the optimal amount of input sucrose and aeration required for the maximal growth of B. subtilis. The results of other combinations of glucose, sucrose, and fructose are shown in Supplementary Figures S3–S5.
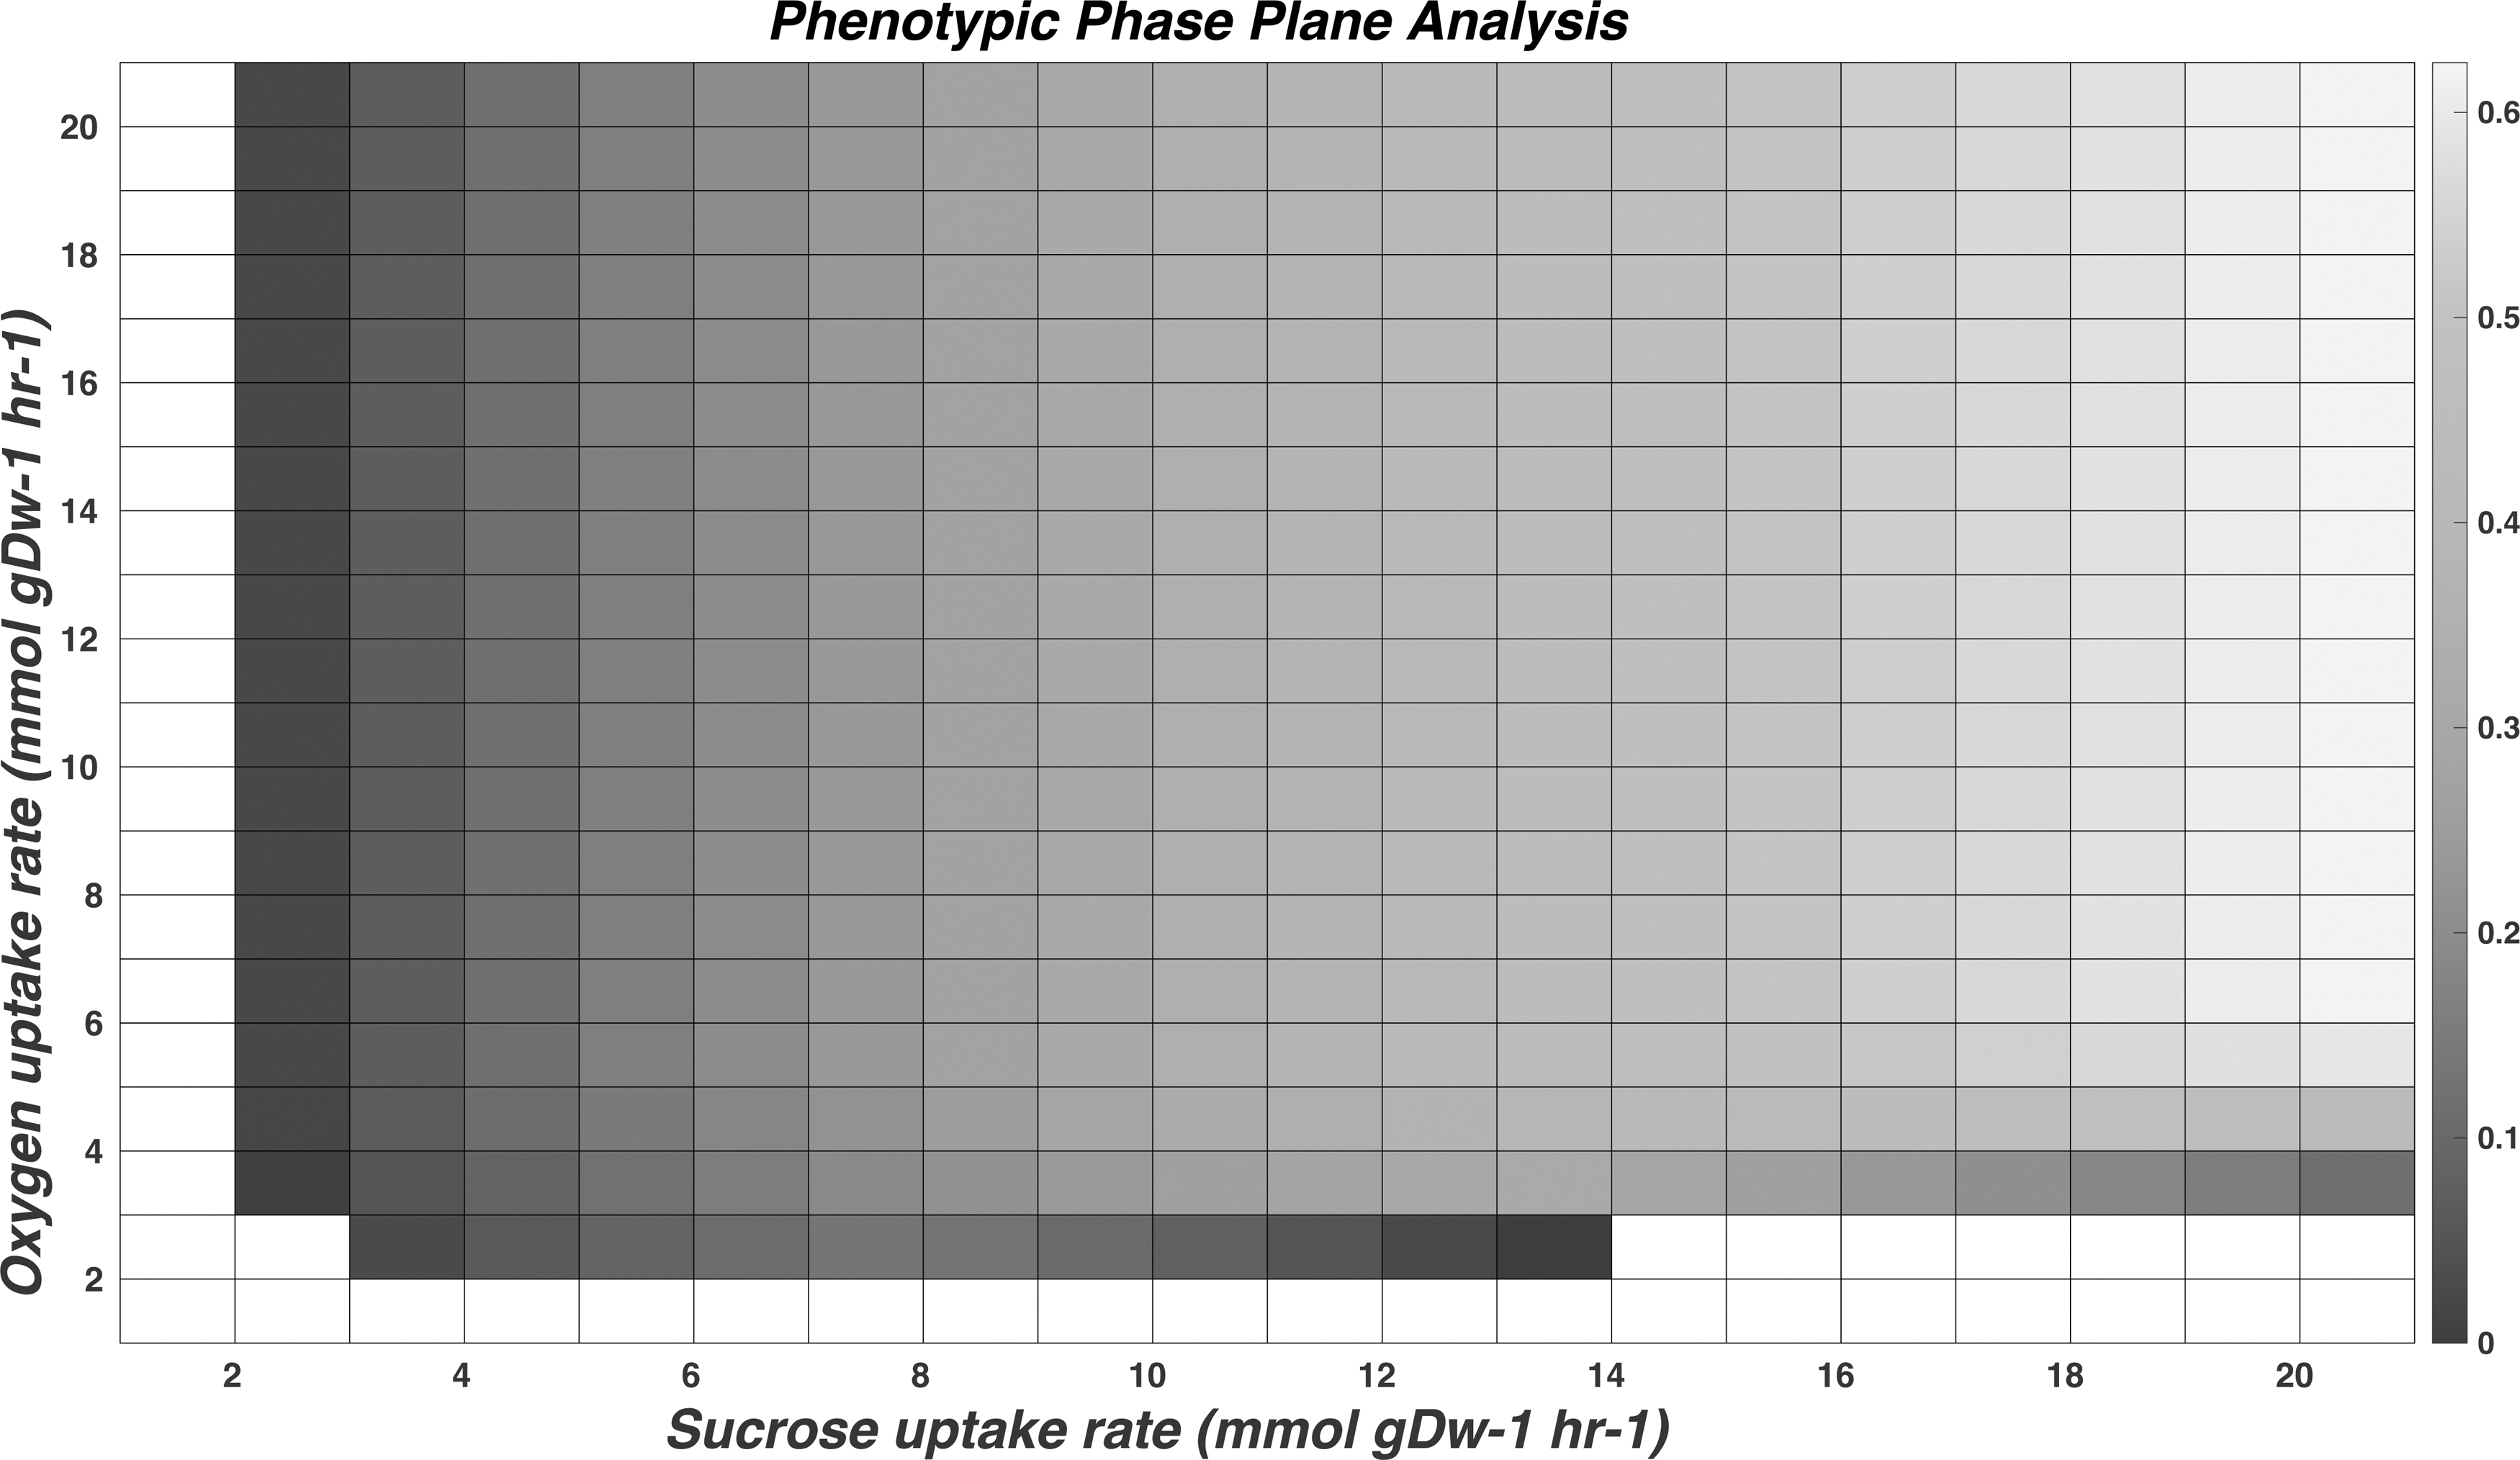
Phenotypic phase plane analysis. The phenotypic phase plane analysis shows the relationship between the sucrose and oxygen content in cellular growth. The optimal value between the sucrose and oxygen uptake for maximal growth in sucrose is 18 mmol gDW−1 h−1 to oxygen at 5 mmol gDW−1 h−1.
ec_iYO844_lvn model's FBA
When an unconstrained supply of oxygen and glucose was provided, the growth rate was 0.624 hr−1, which is similar to the experimental results of B. subtilis’ growth (Tännler et al., 2008). The uptake value of glucose and oxygen using biomass as objective was 1.93 mmol gDW−1 hr−1 of glucose and 22.940 mmol gDW−1 hr−1 of oxygen, respectively. The flux flowing through the reactions related to levan was zero when glucose was used as a supplement. This is in accordance with microbial growth, where levan production might not happen with glucose as the sole carbon source. The total reactions that are capable of carrying flux when the objective function set toward biomass was 670 reactions out of 1270 reactions. When sucrose was provided as the sole carbon source, we observed a similar growth rate of 0.624 hr−1.
ec_iYO844_lvn model's FVA
The maximum and minimum flux that can pass through particular reactions can be identified by FVA. We found that the minimum and maximum flux accountable for levan was zero, when glucose was provided. However, supplementing sucrose (100 mmol gDW−1 hr−1) gave minimum and maximum flux for levan ranging from 0 to 100. This also confirms that levan production is not possible with glucose as the sole substrate. Thus, with sucrose as substrate, there is no bottleneck in the levan production.
Gene Knockout analysis
Both the single gene and double genes were knocked out of the model to identify the lethal mutants, which affect the biomass using the gene-protein reaction associations. The flux value was calculated for knocked-out mutant strains.
In the single-gene knockout analysis, the objective function was set toward biomass growth. The genes that reduced the biomass growth were considered partial mutants, and the mutations that completely disabled the biomass were considered lethal mutants. Specifically, there were a total of 170 lethal single-gene mutants that completely affected the biomass growth of the model (Supplementary Fig. S6). In addition, 33 gene mutants were identified as partial mutants that negatively affected the biomass, but were not lethal.
The results of double-gene knockout analysis are shown in Figure 3, where the gene pairs with overlapping functions playing a role in growth are highlighted. Thus, we identified 361 lethal gene deletion pairs, among which 95 genes were responsible for cell toxicity (Supplementary Table S3). Interestingly, sac group genes were also identified to be lethal when knocked out with pairs of sacB and sacA, sacC, and sacA genes. This result reveals the important role of sacA, sacB, and sacC genes in cellular growth with sucrose as the sole carbon source.
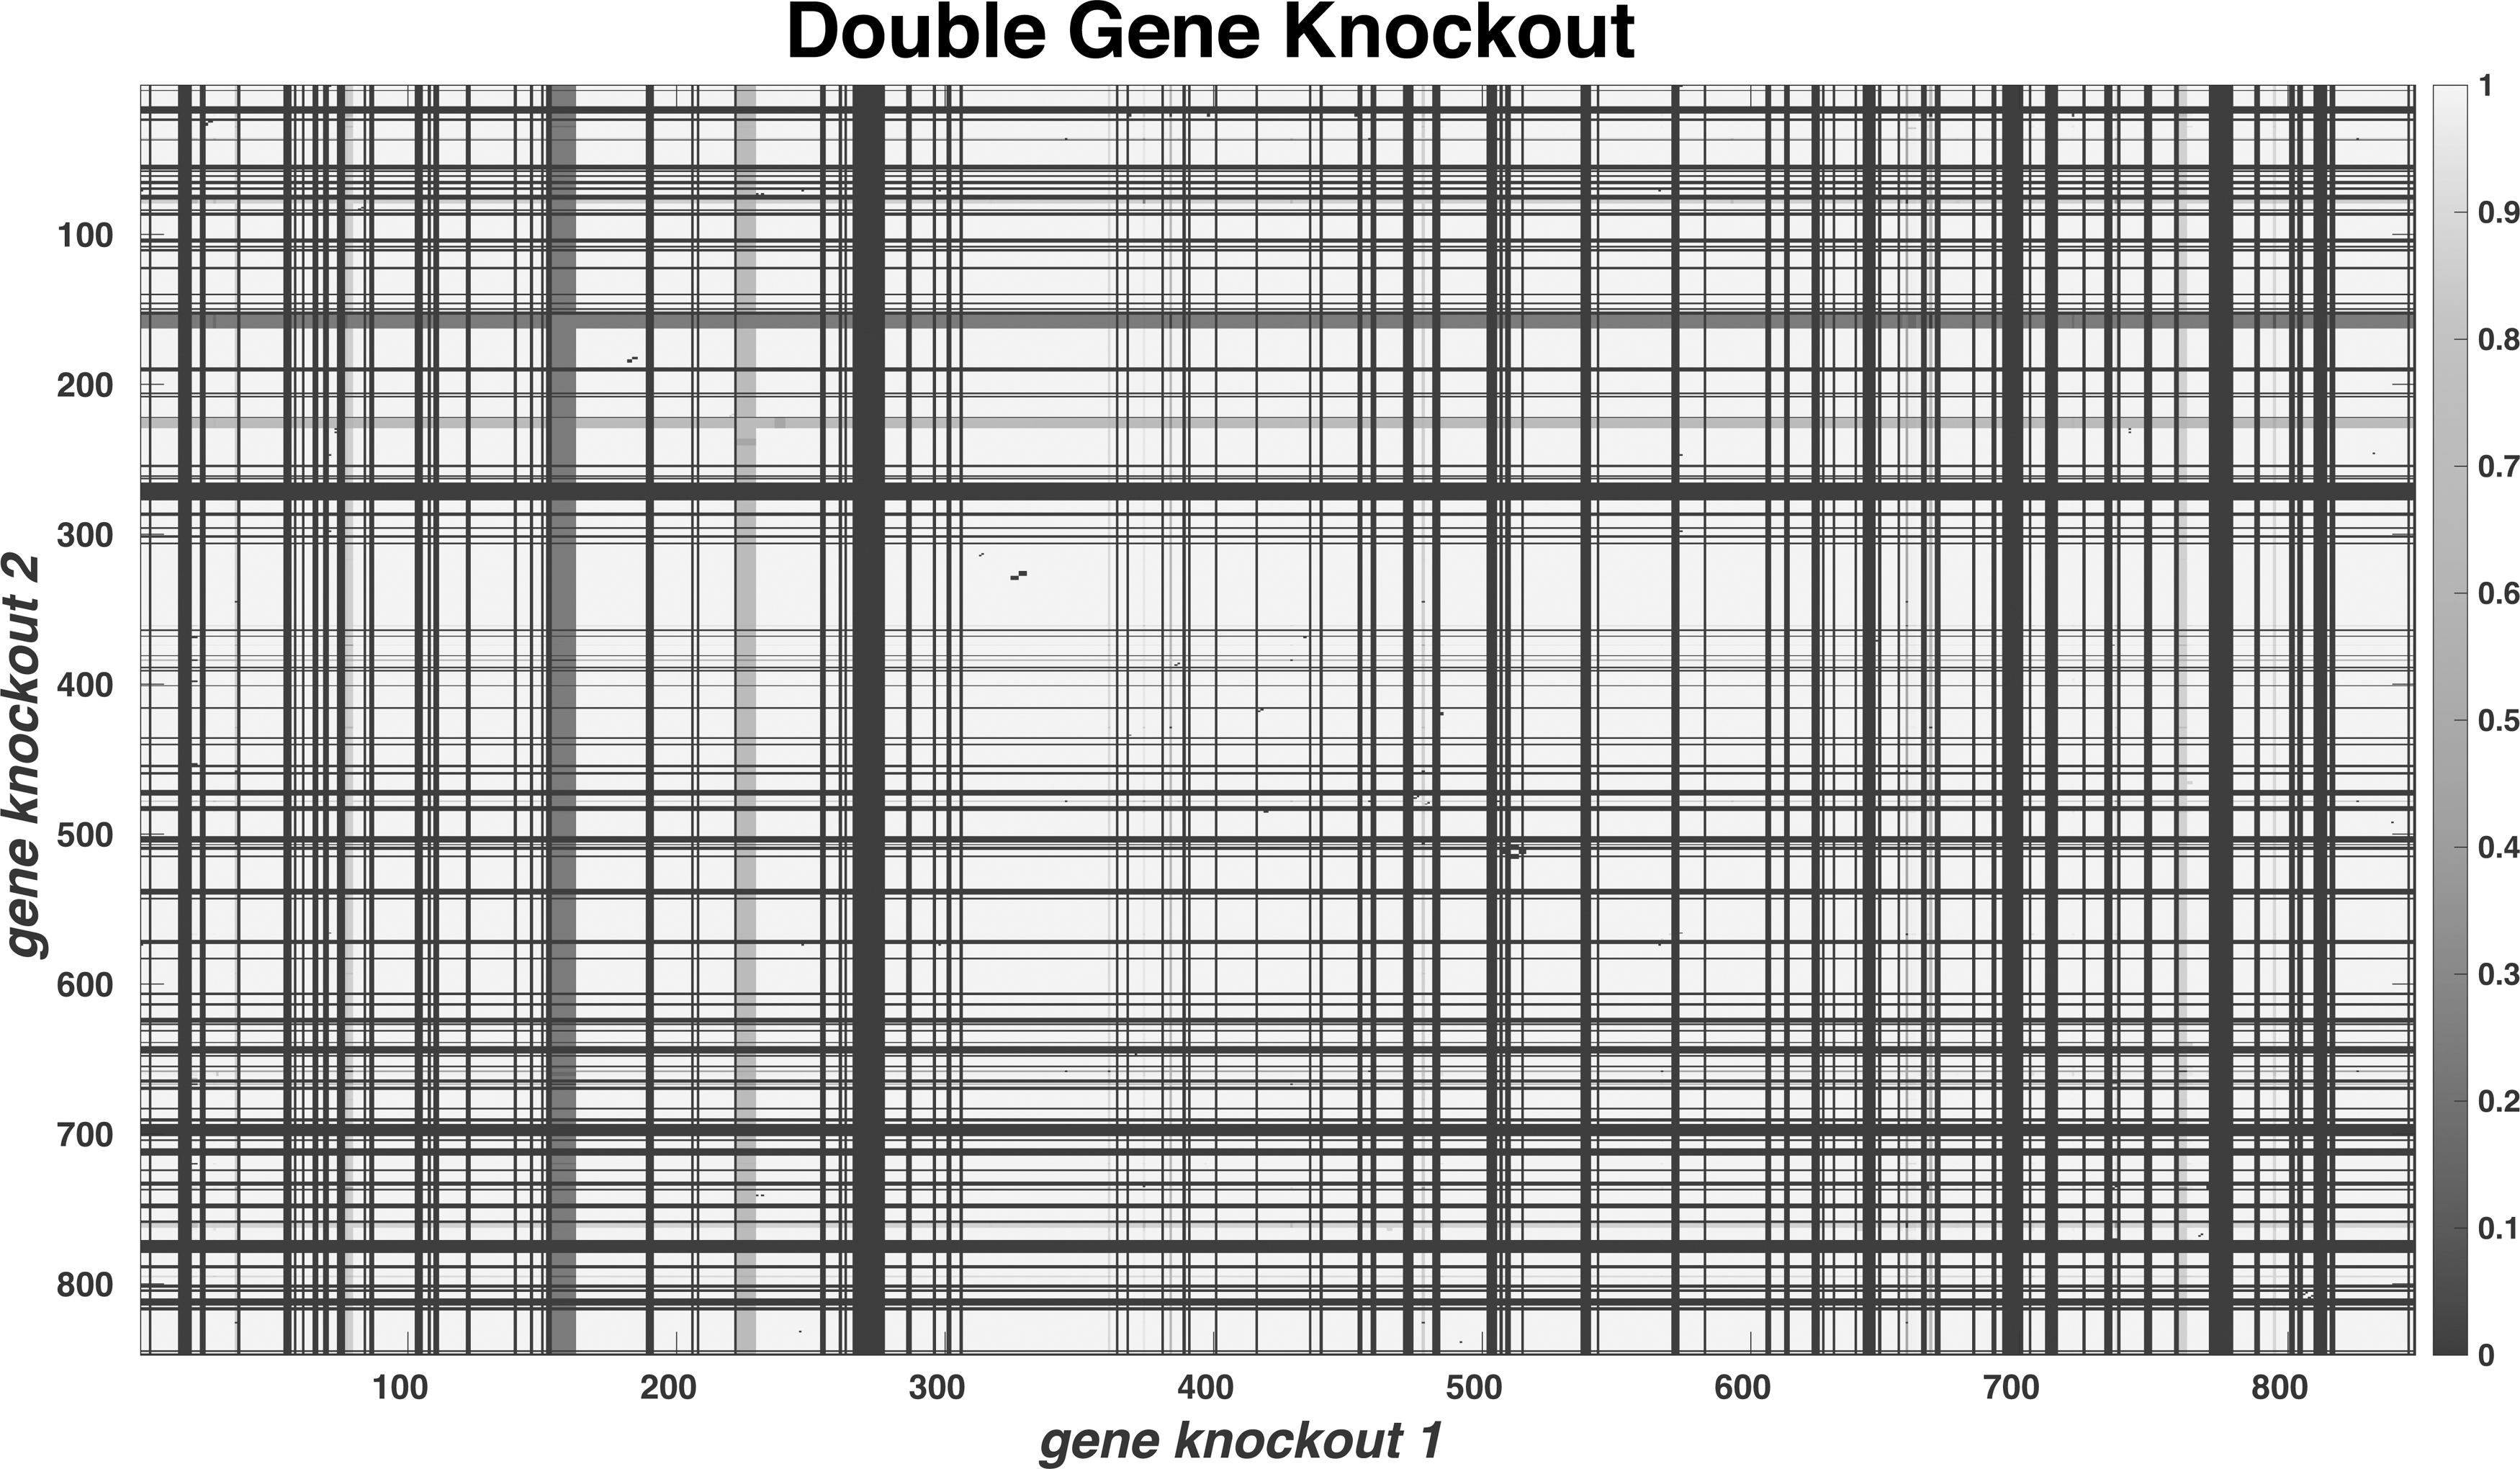
Double-gene knockout analysis of the model showing the essential genes for the cell survival. This plot shows additional genes that are essential and the functions can be masked by a parallel gene; when both genes are knocked, it leads to cellular death with zero biomass growth. Darker shade shows minimum or no growth and the lighter shades show maximum growth rate.
Relative flux analysis of gene knockouts
The flux for the levan reaction was increased by 1.3-fold with pgk gene knockout (Fig. 4). Similarly, with ctaD gene knockout, the flux for levan reaction increased by 1.4-fold (Fig. 4). These gene knockouts also increase the exchange fluxes of the mannitol reaction. The previous studies show the supplement of mannitol has doubled the production of levan in Halomonas smyrnensis AAD6T (Ates et al., 2013). Figure 4 shows the amount of change in the flux for B. subtilis when a particular gene is knocked out. By knocking out the gene pgk, the relative flux span of around 30 reactions spiked up at over 105 values, and knockout of ctaD produced a similar result.
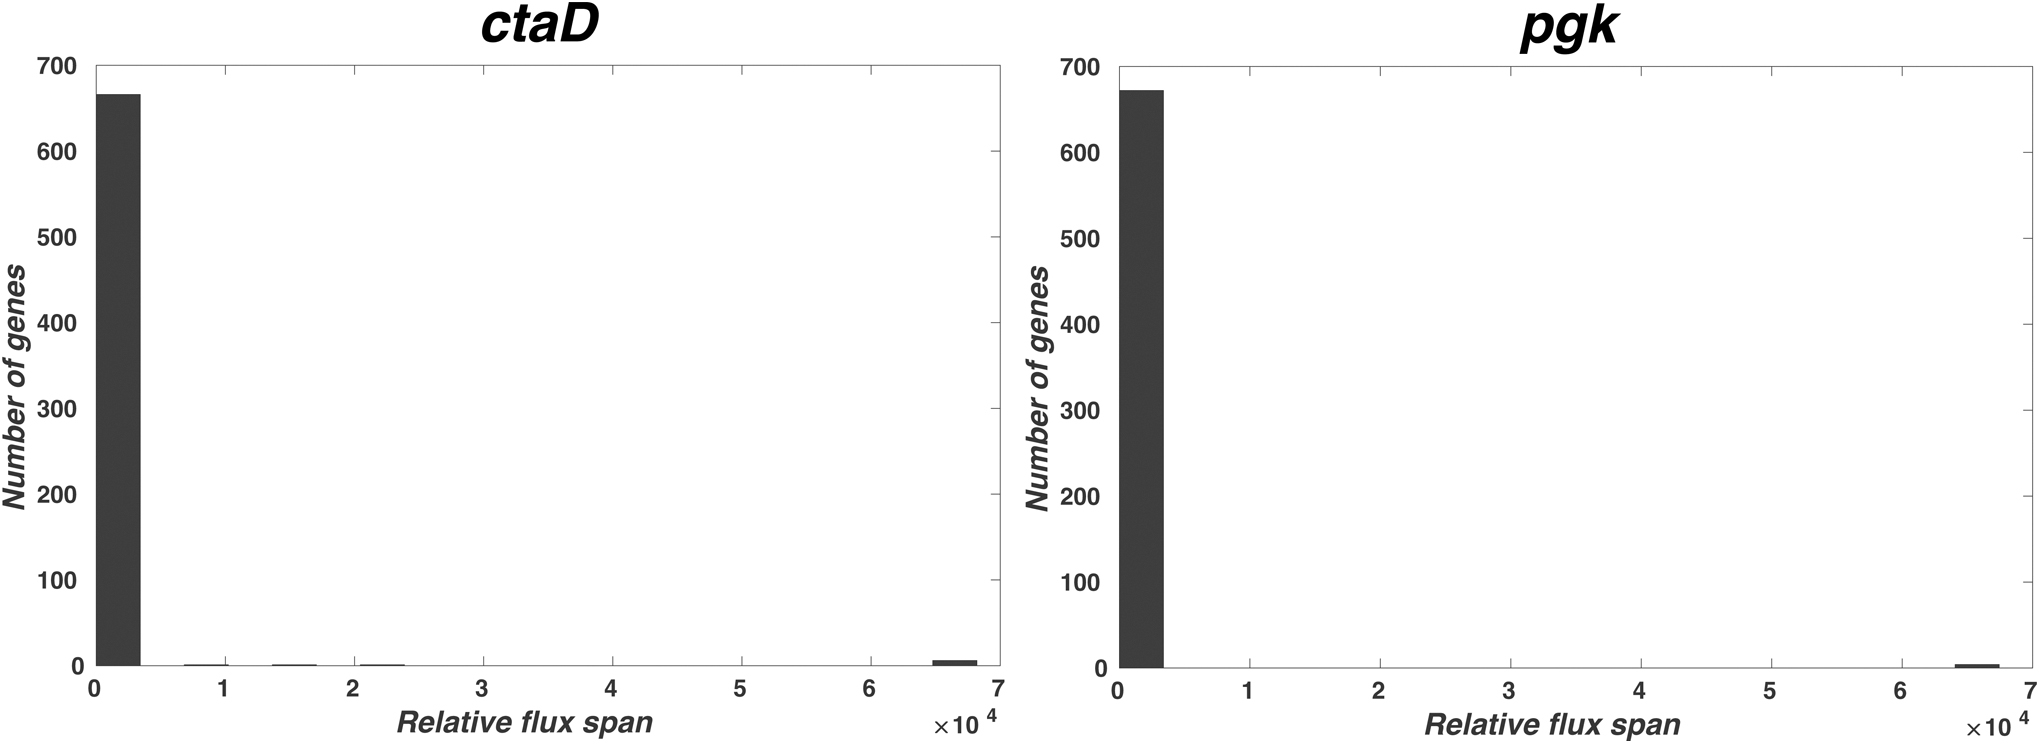
Bar plot showing the maximum flux changes of the reactions for single-gene knockout. When the single-gene expression (ctaD and pgk) is knocked out, the relative flux of the proteins is increased at several magnitude and the maximum value change for number of reactions that carry flux is shown, the x axis shows the times of flux increase for various genes and y axis shows the number of genes.
OptFlux gene knockout analysis
Using OptFlux, we identified additional gene knockouts by using three different algorithms (SPEA2, EA, and SA) for BCPY and YIELD. This resulted in 27 unique genes. Furthermore, we considered those genes that have a higher repeatability of 30% among the three algorithms. Thus, we identified 13 genes that are involved in transport, metabolism, biosynthesis, and other pathways (Table 2).
Gene Knockouts Performed by OptFlux
The knockout targets having a repetition frequency of 30% or more are shown. The last column indicates the gene's involvement in the double-gene and/or triple-gene knockouts as combinatorial knockouts. The combinatorial knockout was predicted by the three algorithms (SPEA2, EA, and SA). The specific objective function is listed and the genes involved in combinatorial knockouts are mentioned in brackets.
EA, evolutionary algorithm; SA, simulating annealing; SPEA2, strength pareto evolutionary algorithm; NA, not applicable.
Comparing the OptFlux results with single- and double-gene knockouts, we identified the pgk gene recurring in both the results. In addition, we found the homolog of ctaD gene with qoxB gene, which shared a similar function, that is, cytochrome-C oxidase activity. Even though the ctaD gene was not directly considered a gene knockout target by OptFlux, we found similar pathway involvement at the level of function, and we hypothesize that this is highly likely to be involved in an increased levan production yield. Additional gene knockouts identified by OptFlux suggest the importance of glycolysis and other genes involved in transport.
Fluxer data analysis
Using Fluxer, we identified the shortest path length of five, which corresponds to the five major pathways. They are glycolysis pathway, electron transport pathway, sucrose transferase system, and others (Supplementary Fig. S7). Using this analysis, we identified that pgk and ctaD genes are important candidates for gene knockout as crucial junctions in the pathways that lead to increased biomass growth using levan. This correlates the results obtained from COBRA Toolbox for gene knockout analysis.
Future Outlook and Conclusions
Systems metabolic engineering and biomanufacturing have been demonstrated as one of the key solutions for increased production of value-added products. Metabolic engineering involves studying the metabolic pathways of the organism and identifying the roadblocks and circumventing them using strain optimization methods.
At least 10 genome-scale models have been constructed for B. subtilis, where the first model was labeled iYO844 by Oh et al. (2007). This preliminary model predicts biomass growth and in the single-gene knockout analysis, 766 genes were predicted with over 94% accuracy. Thus, the iYO844 model served as a base model in genome-scale modeling advancements in B. subtilis (Oh et al., 2007). Several studies utilized this genome-scale metabolic model for strain optimization by gene overexpression, gene knockout targets, and substrate enrichment analysis. In another study, using the same model Fengycin, a lipopeptide antibiotic yields was increased to 20.5%, 46.6%. and 56.4% by the overexpression of accA, cypC. and gapA genes (He et al., 2021). Vikromvarasiri et al. (2021) also used the same model to enhance (R,R)-2,3-butanediol production from glycerol.
Similarly, using a modified model of iYO844, Hao et al. (2013) identified that the knockout combination of the three reactions for the production of 2-(hydroxyethyl) thiamine diphosphate and S-acetyldihydrolipoamide gave a magnified yield of 44.9% and 21.7%, respectively. They used modified iYO844 model to improve the production of riboflavin, butanediol, and isobutanol. Thus, using the iYO844 and its modified versions, previous reports demonstrate that the use of computational systems modeling increased the yield of desired products. Goelzer et al. (2008) constructed a central metabolism model of B. subtilis with the addition of regulatory elements. They showed the role of global regulatory networks and predicted the metabolism regulations.
In another study of B. subtilis, the genome-scale model iBsu1103 had higher accuracy and completeness for irreversible reactions in the organism (Tanaka et al., 2013). The model iBsu1103v2, an updated one, improved the knockout predictions (Kocabaş et al., 2017). It was tested for 27 different B. subtilis knockout strains. A third-generation model of B. subtilis (iBsu1144) with an updated enzymatic reaction data was reported by Kocabaş et al. (2017). Using a machine learning approach, Bi et al. (2023) filled the gaps in the metabolic model and demonstrated the growth of 1209 mutants under 12 different culture conditions, where the accuracy was 89.3%. Recently, Blázquez et al. (2023) predicted the growth of B. subtilis using 28 different carbon sources and estimated the carbon flux.
The details of the EPS synthesis are not fully integrated with the mechanisms and reactions in the previous models of B. subtilis. Especially, the levan biosynthesis, which utilizes the sucrose, is not present. Hence, our model sheds light into the levan biosynthesis in B. subtilis. Although the production of EPSs using systems metabolic engineering is sparse, the genome-scale model of Brevibacillus thermoruber 423 was tested for its efficiency on different feed substrates such as fructose, galactose, glycerol, xylose, and the results showed the optimum substrate for the growth and production of EPSs (Yaşar Yildiz et al., 2019). The complete EPS biosynthetic pathway was added to a mushroom, Ganoderma lucidum strain CGMCC5.26 (Ma et al., 2018).
The addition of phenylalanine as an input substrate has consistently increased EPS production by more than 30% in both experimental and genome-scale modeling simulation. They also identified eight gene overexpression targets. When the galU gene was overexpressed along with pgmA in Streptococcus thermophilus LY03, the EPS yield was almost double (0.17 to 0.31 g/mol). Also, the knockout of pgmA in galactose fermenting LY03 with an overexpression of galU strain produced the highest yield of 0.36 g/mol, thus showing the capabilities of systems modeling in EPS production (Levander et al., 2002).
There are reports of levan production on many organisms, including B. subtlilis. Specifically, the systems modeling for levan was conducted in H. smyrnensis AAD6T strain, which is a Gram-negative bacterium. The preliminary model was able to identify the addition of mannitol as a primary substrate, which in turn increased the yield of levan (Ates et al., 2013b). Similarly, the production of levan was increased by 4.86-fold using systems metabolic engineering studies (Aydin et al., 2018). The introduction of genome-scale metabolic model provided fructose-specific phosphotransferase system (PTSfru) as the gene knockout targets for increased levan yield (Aydin et al., 2018).
In all the metabolic engineering and the subsequent strain optimization studies performed so far, a shared feature is the incorporation of computational study of either the pathway of interest or whole genome. Specifically, these computational models include an integrated omics approach to fill the gaps of a known metabolic network (Mienda et al., 2016; Orth et al., 2010).
In this study, we have analyzed the whole genome model of B. subtilis, focusing on the levan production metabolic pathway. Specifically, we have modified the existing model ec_iYO844 and added the reactions for the levan production. We show that the incorporation of levan production reactions improved the model, in regard to its metabolite range, and able to predict the flux values during growth and levan production. Sucrose can be used as a substrate because of the inclusion of sacB, sacC, and levB reactions.
The sparse matrix connectivity derived did not deviate from the ec_iYO844 model, even though additional reactions were added. This is because the reactions are extracellular in nature. Thus, we were able to preserve the scope of the original model. While the original model has been reported to utilize only glucose as a substrate, we were able to successfully incorporate reactions to utilize sucrose. Along the same line, additional reactions can be incorporated to utilize a wide variety of substrates such as mannose and fructose, among others. The phenotypic phase plane analysis showed that when sucrose was provided at 18 mmol gDW−1 hr−1 with oxygen at 5 mmol gDW−1 hr−1 concentrations, maximal biomass growth was observed under the steady-state condition.
We further tested our model for robustness, where the analysis showed that a flux value of 6 h−1 for sucrose produces the maximum biomass yield. The FBA and FVA of our model showed that it is capable of producing similar flux under the utilization of both sucrose and glucose. This is due to the conversion of sucrose to fructose and glucose in the primary step of reaction by SacB enzyme. Subsequently, the fructose is utilized for levan production and glucose is used for cell growth. Overall, using the modified ec_iYO844_lvn model, we have identified pgk and ctaD genes having the highest fluxes associated with the increased levan production by 1.3- and 1.4-fold, respectively.
The single-gene knockout analysis showed 170 genes out of 847 total genes that are essential for cellular viability. Similarly, in the double-gene knockout analysis, 95 genes were additionally found to be essential. Perturbation of pgk and ctaD genes gave the flux gain of relative flux span, and validating the genes thus identified through FBA and FVA. In addition, we validated our gene knockout targets using Fluxer and OptFlux.
Thus, we have successfully modeled the B. subtilis whole genome metabolic model for levan production using sucrose as a substrate. The model reported in this study needs to be validated experimentally, and currently studies are underway. At the same time, our model can be a basis for others to modify for other substrates and their optimal concentration of EPS. In all, this computational study highlights a starting point for further translational studies to inform strain engineering, and potential biotechnology applications in planetary health, pharmaceutical, food, personal care, and aquaculture sectors.
Footnotes
Author Disclosure Statement
The authors declare they have no conflicting financial interests.
Funding Information
Dr. UV's laboratory is supported by SERB-CRG (CRG/2023/006281). Dr. RMY's laboratory is supported by UGC-BSR (F.30-561/2021(BSR)), ICAR-NASF (F. No. NASF/SUTRA-02/2022-23/50), and IKS Division of MoE@AICTE (F. No. 2-23/AICTE/IKS/Research project/18). The authors thank SASTRA Deemed to be University for the infrastructural support and financial support through Research and Modernization funding.

Abbreviations Used
References
Supplementary Material
Please find the following supplemental material available below.
For Open Access articles published under a Creative Commons License, all supplemental material carries the same license as the article it is associated with.
For non-Open Access articles published, all supplemental material carries a non-exclusive license, and permission requests for re-use of supplemental material or any part of supplemental material shall be sent directly to the copyright owner as specified in the copyright notice associated with the article.
