




Abstract
Diabesity is a comorbidity of type 2 diabetes mellitus and obesity. Diabesity is a major global epidemic and a veritable planetary health burden. With diabesity, several clinical signs are present such as excess accumulation of fat, altered lipid metabolism, chronic inflammation, insulin resistance, disordered pancreatic β-cell metabolism, and hyperglycemia. We report here new potential candidate genes for diabesity, and the structural and functional effects of non-synonymous single nucleotide polymorphisms (nsSNPs) in these genes using a computational biology approach. A protein-protein interaction (PPI) network was constructed using Human Integrated Protein-Protein Interaction rEference (HIPPIE’) data for 186 diabesity-associated genes from the Disease Gene Network (DisGeNET). Subsequently, the top 2% of nine centrality-ranked genes were identified as hub genes. Gene ontology enrichment analysis was performed with the same gene list using the Gene Ontology enRIchment anaLysis and visuaLizAtion (GORILLA) tool, and importantly, 63 enriched hub genes with no prior disease association were selected and their differential expressions in adipose, skeletal, and hepatic tissues were analyzed using Gene Expression Omnibus (GEO) profiles. Finally, the nsSNPs in the top five prioritized genes (EGFR, SRC, SQSTM1, CCND1, and RELA) were retrieved from Database of Single Nucleotide Polymorphisms (dbSNP) and subjected to deleterious variant analysis. The significant variants were subjected to structural prediction using AlphaFold, stability analysis, and molecular dynamics simulation using GROningen MAchine for Chemical Simulations (GROMACS). Taken together, the present computational biology research reports new molecular insights on diabesity candidate genes and the role of nsSNPs that may potentially contribute to diabesity. As diabesity and diabetes continue to be major planetary health challenges, these findings warrant further in vitro and clinical translation research with an eye to precision medicine and therapeutics innovation. Understanding the differences between wild type and variant proteins is crucial for developing interventions aimed at stabilizing these proteins in the prevention and treatment of diabesity.
Introduction
Diabesity, a condition characterized by the onset of diabetes mellitus in obese individuals (SIMS et al., 1973), is a significant planetary health issue. A central factor in this condition is the interaction between chronic inflammation and impaired insulin sensitivity (Zierath et al., 2000). While environmental factors such as diet, physical inactivity, and gut microbiota are well-established risk factors, a growing body of evidence suggests substantial genetic and epigenetic predisposition contributing to the phenotype. Sheikhpour et al. (2020) have identified genes that are significantly linked to the disease, which could act as potential biomarkers or as therapeutic targets. Computational prioritization methods are important in efficiently identifying disease-causing genes from the vast omics data by leveraging diverse biological data sources such as sequence properties, functional annotations, protein interactions, and phenotypic similarity. Among these approaches, exploration of the protein-protein interaction (PPI) space provides a proven ideal methodology to identify and prioritize the candidate genes for complex metabolic disorders like diabesity (Udhaya et al., 2020; Sheikhpour et al., 2020).
In the present study, we utilized a computational and systems biology methodology involving the construction of a PPI network for the phenotype and selection of hub nodes from among the networks. Functional enrichment analysis, tissue-specific gene expression data along with network analysis enabled prioritization of potential genes linked to diabetes.
In genetic predisposition to a disease, single nucleotide polymorphisms (SNPs) serve to reflect variations in the genome. SNPs account for 90% of naturally occurring DNA polymorphisms (Brookes, 1999). Among the SNPs in coding region or exons, synonymous SNPs (sSNP) do not change the amino acid sequence and cause no deleterious alteration in the function of the protein. However, non-synonymous or missense SNPs (nsSNP) cause a change in protein structure by modifying the amino acid sequence, thereby affecting protein function and stability.
The current study investigates the role of nsSNPs present in under-explored candidate genes associated with diabesity. SNPs in key genes serve to better understand the molecular mechanisms behind the phenotype, enabling the development of new therapeutic strategies. By employing a multifaceted in silico approach, analyzing functional, structural, and pathogenic properties of such variants, we aimed to identify deleterious nsSNPs within key candidate genes and elucidate their potential functional impact. Using a bioinformatics approach, we prioritized the nsSNPs for five key genes EGFR, SRC, SQSTM1, CCND1, and RELA. These prioritized nsSNPs were found to disrupt crucial cellular pathways involved in insulin signaling, glucose metabolism, and fat storage, potentially contributing to diabesity development. The findings from the study help understand the complex interplay between genetics and diabesity, ultimately opening up new avenues for preventive and therapeutic strategies.
Materials and Methods
The present study used computational biology methods and did not require institutional review board approval. The study was conducted under the overall research ethics oversight of the authors’ institutions.
Gene set compilation and PPI network construction
A set of 186 commonly recognized diabesity-associated genes were extracted from the DisGeNET database (Piñero et al., 2017). These genes were used to construct a PPI network using the HIPPIE v2.3 database, with an interaction layer size set to 1, capturing interactions among the input genes. Cytoscape 3.9 (Doncheva et al., 2019) was utilized for network visualization, and significant hub genes were identified using cytoHubba (Chin et al., 2014), focusing on central nodes (Ceylan, 2021).
Gene ontology enrichment analysis
Gene ontology (GO) enrichment analysis was performed using the GORILLA tool (Eden et al., 2009), with 186 common diabesity genes as the target set and 9266 genes from the PPI network as the background set. All three GO categories (biological process, molecular function, and cellular component) were analyzed, applying a significance threshold of p < 0.001. Duplicate genes were removed, and the top 20% of enriched GO terms were further refined using the REVIGO tool (Supek et al., 2011) to eliminate redundancy. Non-redundant GO annotations were obtained from the goa_human.gaf file.
Identification and prioritization of candidate genes
Prediction of potential candidate genes (Kumar et al., 2017) for diabesity involved a multi-step approach. Set 1 comprised genes associated with diabesity sourced from the DisGeNET database. Set 2 included genes linked to significantly enriched GO terms identified through enrichment analysis of diabesity genes. Set 3 consisted of hub genes identified based on centrality calculations, focusing on those ranked in the top 2% (Jalili et al., 2015). Candidate genes were selected if they were common to both set 2 (enriched GO terms) and set 3 (hub genes) while excluding those already present in set 1.
To prioritize these candidates, tissue-specific differential gene expression analysis was conducted using datasets from the NCBI GEO database, focusing on adipose (GSE94752, GSE15773, GSE20950, GSE16415), skeletal (GSE73034), and hepatic (GSE64998, GSE15653) tissues.
The GEO2R tool updated in November 2020 was utilized to compare the expression level between disease and control groups. Additionally, potential clusters within the diabesity PPI network were identified using the MCODE plugin in Cytoscape (Palukuri et al., 2023), which detects densely connected regions by customizing scoring parameters. Finally, functional enrichment analysis of the 63 identified candidate genes was performed using the STRING network (Szklarczyk et al., 2021), setting a confidence score threshold of 0.4 to extract enrichment data related to biological processes, molecular functions, tissue specificity, and REACTOME pathways (Haw et al., 2011), facilitating further analyses.
Selection of candidate genes and nsSNP retrieval
We have identified the top five prioritized candidate genes based on their degree of centrality in a PPI network constructed using STRING (Szklarczyk et al., 2023). The missense variants reported in these genes were retrieved from dbSNP (Sherry et al., 2001) after validation by frequency (MAF). The missense variants were investigated for their correlation with disease-related mutations, using SIFT (Sim et al., 2012) followed by SNAP (Hecht et al., 2015), Polyphen-2 (Adzhubei et al., 2010), and SNPs&GO (Calabrese et al., 2009).
Domain identification and conservation analysis
The evolutionary conservation of amino acids along with their properties (structural, functional) were analyzed using the Consurf server (Yariv et al., 2023). Variants that were not located within the conserved regions (highly conserved score of 9) were excluded, and the remaining variants of the five genes were used for further analysis.
Structure modeling for the variants and validation
The wild type and the variant structures were predicted using AlphaFold2.0 and predicted local distance difference test (pLDDT), and predicted template modeling (PTM) scores were calculated. The predicted structures of wild type and its variants were validated by aligning them with structures predicted using the Swiss model. ProteinTool kit (Ferruz et al., 2021) web server was used for the prediction of protein stability, hydrogen clusters, and hydrogen bond analysis.
Molecular dynamics simulation
The top five prioritized candidate genes associated with diabesity were subjected to molecular dynamic (MD) simulation using GROMACS version 2022.2 with an OPLS force field. The simulations were performed in solvent cubic boxes, maintaining 1 nm between the protein and the box. Single point charge water models were used to fill the box and neutralize with NaCl counter ions. The equilibration phase for each simulation ran for 50,000 steps at 300 K. To ensure stability during the simulations, the steepest descent algorithm was utilized to maintain the geometry of water molecules. Coulomb electrostatic interactions were calculated using the Particle Mesh Ewald algorithm with a cutoff threshold (rcoulomb) of 1.0 nm and van der Waals interactions were computed with the same cutoff radius. The system underwent energy minimization using the steepest descent algorithm. Subsequently, both NVT and NPT ensembles were used for simulations. The dynamic simulation of the entire system was performed for 50 ns. The numerical data obtained from the simulations were analyzed using GROMACS, and the output was visualized using the Xmgrace plotting tool.
Results and Discussion
In the present study, we identified 186 diabesity-related genes by analyzing common genes between type 2 diabetes and obesity using the DisGeNET database, with a disease-gene association score cutoff of ≥0.1, and constructed a diabesity PPI network using the HIPPIE database. GO enrichment analysis revealed 1569 enriched GO terms, which were refined using three criteria: a threshold cutoff of 49 ≤ b ≥ 4, selection of the top 20% based on enrichment, and removal of redundant terms using REVIGO. This resulted in 105 GO terms linked to 1382 unique genes. A centrality analysis of the diabesity PPI network ranked 9266 nodes using nine different centralities, including local (Degree, MNC, MCC) and global (Closeness, Radiality, BottleNeck, Stress, Betweenness, Edge Percolated Component) measures. The top 2% of nodes (407) were identified as hub genes.
Identification and prioritization of candidate genes
The identification of candidate genes for diabesity was performed by combining three gene sets: set 1 contained 186 diabesity-related genes from the DisGeNET database, set 2 included 1382 genes from GO enrichment analysis, and set 3 comprised 407 hub genes from a medium-confidence diabetes network. This process identified 63 candidate genes that had no prior association with diabesity but were highly enriched in GO terms and were significant hub genes in the network shown in Supplementary Figure S1.
To prioritize the diabesity candidate genes, three validation methods were used: GEO tissue-specific analysis, MCODE cluster analysis, and STRING functional enrichment analysis. In total, 37 candidate genes were validated through GEO analysis, 23 genes through MCODE clustering, and 40 genes through STRING enrichment. A scoring system was applied where a score of 1 indicated validation by a method, and 0 indicated no validation. Genes not validated by any method were eliminated, leaving 58 prioritized genes, while 5 genes were excluded from further analysis (Supplementary Table S1). From the pool of eight genes identified as highly susceptible to diabesity, the top five genes (EGFR, SRC, SQSTM1, CCND1, RELA) are selected based on degree centrality for the analysis of deleterious SNPs using in silico tools.
Significance of the five highly susceptible prioritized genes
EGFR has been identified to be a susceptible gene for T2DM by genetic interaction analyses of enhancers and protein-coding genes (Yang et al., 2021). Reports suggest that selective deletion of EGFR in adipose tissue macrophages inhibited both macrophage proliferation and monocyte infiltration into adipose tissue and decreased obesity and development of insulin resistance (Cao et al., 2022), suggesting EGFR is linked to obese phenotype among adipose tissue macrophages. Inhibition of EGFR activation has also been associated with improved diabetic nephropathy and insulin resistance in mice studies (Jones et al., 2014; Li et al., 2018).
SRC is a non‐receptor tyrosine kinase, regulating a wide range of cellular functions. Hyperactivity of SRC is observed under impaired glucose metabolism in pancreatic β‐cells, wherein it plays an important role in glucose‐induced insulin secretion through maintaining subcellular localization and activity of glucokinase (Sato et al., 2016). It is also found to promote lipogenesis leading to obesity and breast cancer by phosphorylation of lipogenesis enzyme phosphatidate phosphatase LPIN1 (Lin and Lin, 2021).
SQSTM1, coding for autophagosome cargo protein p62, acts as a hub gene and plays a crucial role in several cellular functions. Hence, by mediating autophagy, it participates in multiple metabolic diseases, such as T2DM, obesity, aging, cancers, and nonalcoholic fatty liver disease. It has been suggested that SQSTM1 is involved in several diabetic complications like diabetic neuropathy (Wu et al., 2017) and diabetic nephropathy. In mice model, loss of SQSTM1/p62 leads to adipose tissue dysfunction and mature onset of obesity (Qian et al., 2023).
CCND1 expression has also been reported to be associated with obesity (Joshi et al., 2021). Downregulation of hepatic cyclin D1 causes hyperglycemia due to an increase in gluconeogenesis (Lee et al., 2014).
RELA encodes for a part of NF-κB transcription factor complex that is the chief regulator of inflammatory processes and is also associated with insulin resistance and pancreatic β cell dysfunction. Insulin resistance is linked to obesity, cardiovascular diseases, type 2 diabetes, osteoarthritis, hypertension, and different forms of cancer (Poloz and Stambolic, 2015). Increased levels of NF-κB-inducing kinase (NIK) in obese phenotype were found to cause insulin resistance in the liver and muscle and impairment of insulin secretion in pancreatic beta cells, whereas deletion of Map3k14, which encodes NIK, renders mice hypoglycemic and improves glucose tolerance.
Collectively, these findings link the canonical and non-canonical NF-κB activity to diabetes and metabolic syndrome (Zammit et al., 2023). Thus, using the network-based approach we were able to identify novel diabesity-associated candidate genes.
Prediction of deleterious variants
Gene mutations can trigger various complications by altering gene expression, with some mutations classified as benign and others as deleterious. The deleterious effects of missense SNPs in the top five prioritized diabesity candidate genes (EGFR, SRC, SQSTM1, CCND1, and RELA) were analyzed using four bioinformatics tools: SIFT, PolyPhen-2, SNAP2, and SNPs&GO (Supplementary Table S2). In EGFR, 1152 missense variants were analyzed, and 12 deleterious SNPs were identified, including the highly deleterious D837V and W905L. SRC had 300 variants analyzed, resulting in 3 deleterious SNPs. For SQSTM1, 442 out of 657 variants were low tolerance, with 7 deleterious SNPs identified. CCND1 had 236 missense variants analyzed, with 6 confirmed as deleterious, and RELA had 342 missense variants analyzed, with 8 confirmed as deleterious (Supplementary Table S3).
Domain identification and conservation analysis
The InterPro server was employed to identify the domain regions, while the ConSurf server was used to analyze the evolutionary conservation of amino acids in the top five diabesity candidate genes. Variants located outside the domain regions and those with low conservation scores (ConSurf score of 9) were excluded from further analysis (Supplementary Fig. S2). In CCND1, two domain regions were identified, with variants L148F and A204T predicted to be highly conserved. SQSTM1 features three domains, which are part of zinc-binding sites and the variants C131F, R139H, R139L, and C145F were selected for further study. RELA has a DNA-binding domain and an Ig -like plexins, transcription factors (IPT) domain, with variants H86P, D243H, V244G, I250T, and R274W chosen due to their high conservation. SRC contains SH3, SH2, and tyrosine domains, leading to the selection of variants G279D and R388W as highly conserved. Finally, EGFR consists of five distinct domains, and variants D837V and W905L were found to be highly conserved and selected for further analysis (Supplementary Table S4). These variants were subjected to structural prediction and MD simulation.
Structural prediction and analysis
Structural predictions for the five diabesity proteins were generated using AlphaFold 2.0 and the Swiss model, both revealing similar secondary structures. Validation metrics indicated the MolProbity score to exhibit better structure quality for all wild type proteins, with resolutions exceeding 2.00 Å. The Global Model Quality Estimate scores were 0.67 for SQSTM1 variants, indicating good coverage, and 0.89 for CCND1 variants, suggesting extensive alignment with templates. The pLDDT revealed high confidence in the predictions for CCND1 variants (scores ranging from 70 to 90) while showing lower confidence for SQSTM1 variants (from 50 to 70). The PTM score further highlighted stronger structural congruency for SRC, CCND1, and RELA compared with SQSTM1 and EGFR (Supplementary Table S5).
Additionally, analysis of hydrogen bonds and hydrophobic clusters across these proteins emphasized their critical role in maintaining stability and influencing protein interactions. D837V variant in EGFR exhibited reduced hydrogen bonds and hydrophobic clusters, potentially compromising protein stability. SRC and SQSTM1 variants displayed consistent hydrophobic cluster numbers with variable hydrogen bond counts that may affect PPIs. CCND1 variants retained diverse hydrophobic contact areas and stable hydrogen bond networks similar to wild type. RELA variants demonstrated distinct patterns of hydrophobic clusters and hydrogen bonds, affecting stability and molecular interactions. Overall, the interplay of hydrogen bonds and hydrophobic clusters is crucial for protein function and stability in these variants.
MD simulation using GROMACS
MD simulations were performed for both the wild type (5) and variant (15) proteins. Each simulation was carried out for a duration of 50 ns. Following the MD simulations, trajectory files were generated, and various structural metrics were computed, including root mean square deviation (RMSD), root mean square fluctuation (RMSF), radius of gyration, solvent-accessible surface area (SASA), and hydrogen bonds.
EGFR
The stability of EGFR and its variants was assessed by examining the backbone RMSD throughout the simulation. The D837V variant exhibited an RMSD of approximately 1.2 nm, whereas the W905L variant had a higher RMSD of about 2.20 nm. This indicates that the D837V variant is more stable than both the W905L variant and the wild type, which has an RMSD of around 1.75 nm. RMSF analysis showed increased fluctuations in residues beyond position 1000, suggesting greater flexibility in these regions. The radius of gyration, a measure of protein compactness, decreased over time for both the D837V variant and the wild type, indicating reduced compactness, while the W905L variant remained stable throughout the simulation. Additionally, there was a decrease in the solvent-accessible area and an increase in hydrogen bonds over time. In conclusion, the D837V variant is the most stable, followed by the wild type, with the W905L variant showing the least stability shown in Figure 1.
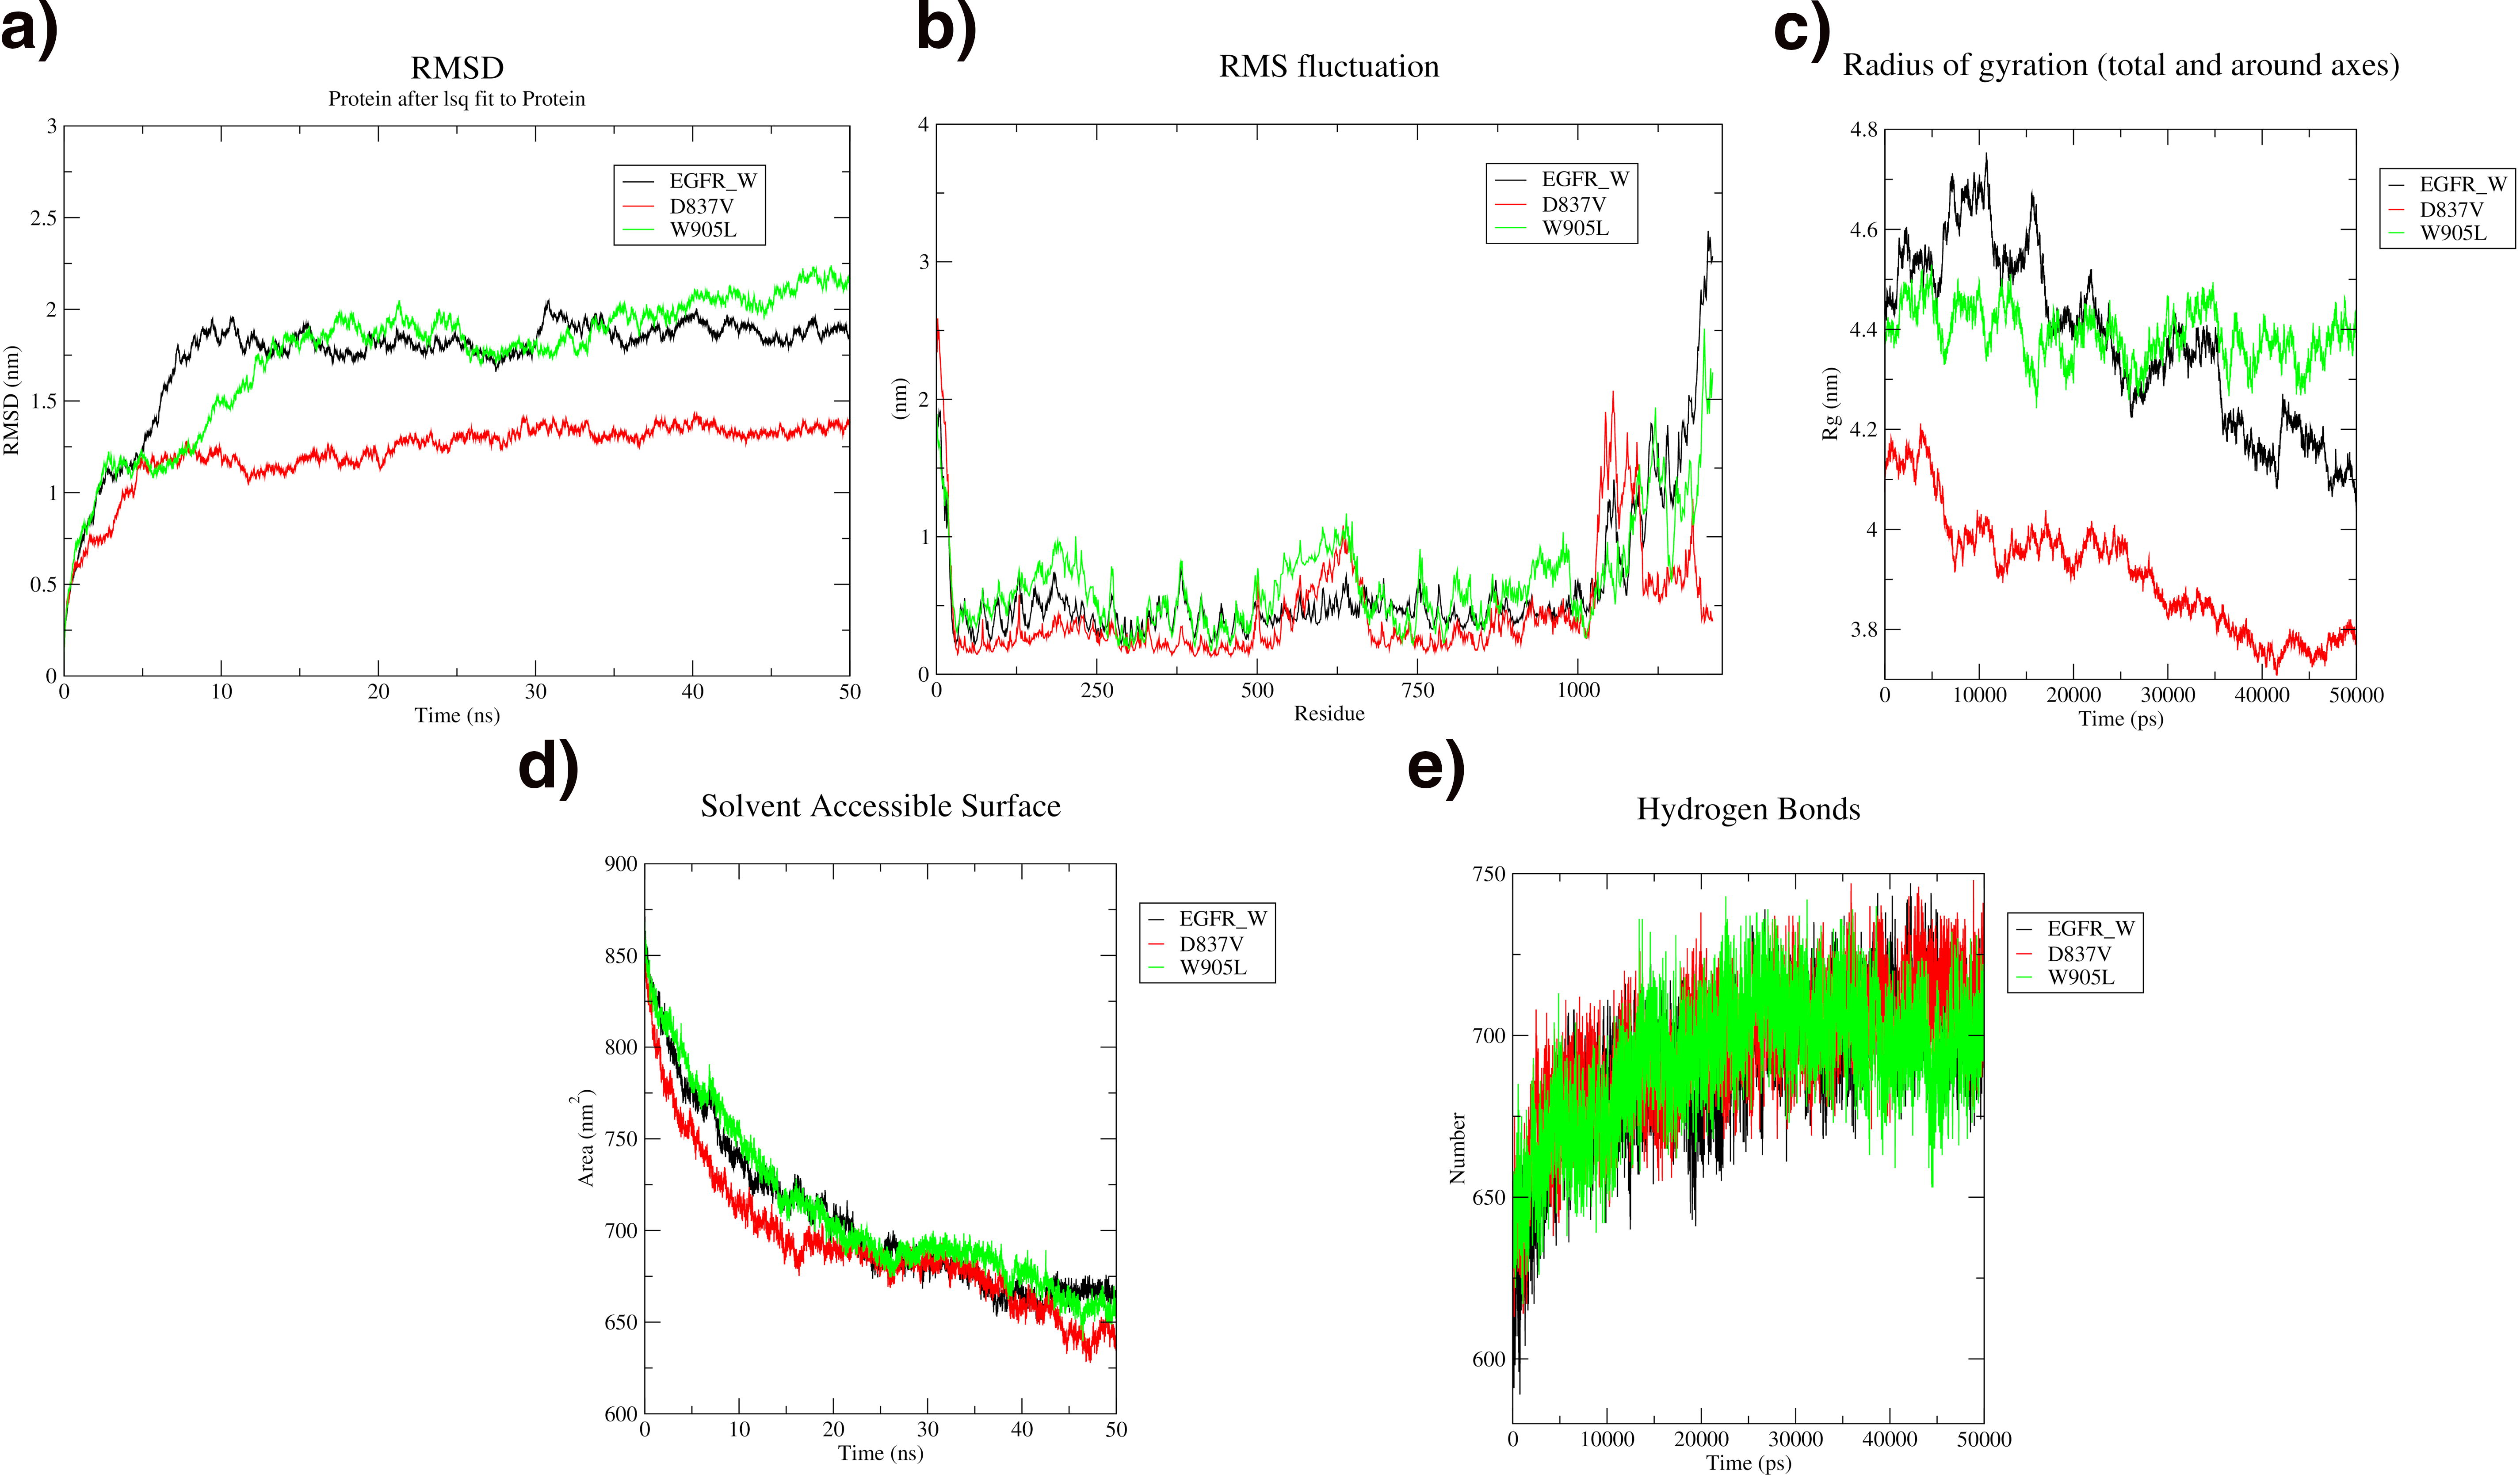
MD simulation analysis of EGFR wild (Black), D837V variant (Red), and W905L variant (Green).
SRC
The G279D variant exhibited a deviation pattern up to approximately 0.85 nm, while the wild type showed a milder deviation pattern of up to 0.75 nm. In contrast, the R388W variant demonstrated a greater deviation pattern of 1 nm during the simulation. The RMSF analysis indicated increased fluctuation in residues 40–60 for both the wild type and the G279D and R388W variants. The solvent-accessible area for SRC decreased from 360 to 260 nm2. Additionally, the radius of gyration was higher for the R388W and G279D variants compared with the wild type. Analysis of hydrogen bonds revealed a gradual increase throughout the simulation. The wild type appears to be the most stable throughout the simulation. It has the lowest deviation pattern, lower RMSF fluctuations, and a smaller radius of gyration compared with the variants. The increased hydrogen bond formation might contribute to stability, but the other metrics suggest that the wild type maintains a more stable structure overall compared with the G279D and R388W variants as shown in Figure 2.

MD simulation analysis of SRC wild (Black), G279D variant (Red), and R388W variant (Green).
SQSTM1
The wild type of SQSTM1 demonstrates the highest stability compared with its variants. It shows the lowest RMSD deviation (1.5–1.7 nm), minimal residue fluctuations, and maintains a relatively high level of compactness with a radius of gyration decreasing from 3.5 to 2.5 nm, which is more pronounced than in the variants. The C131F variant, in contrast, exhibits the highest RMSD deviation (∼2 nm), significant residue fluctuations, and the greatest decrease in compactness, indicating lower stability. While the solvent-accessible area shows a minimal and gradual decrease across all variants and the wild type, increased dynamic fluctuation in hydrogen bonds is observed in both the wild type and variants. Overall, the wild type remains the most stable throughout the simulation as shown in Figure 3.
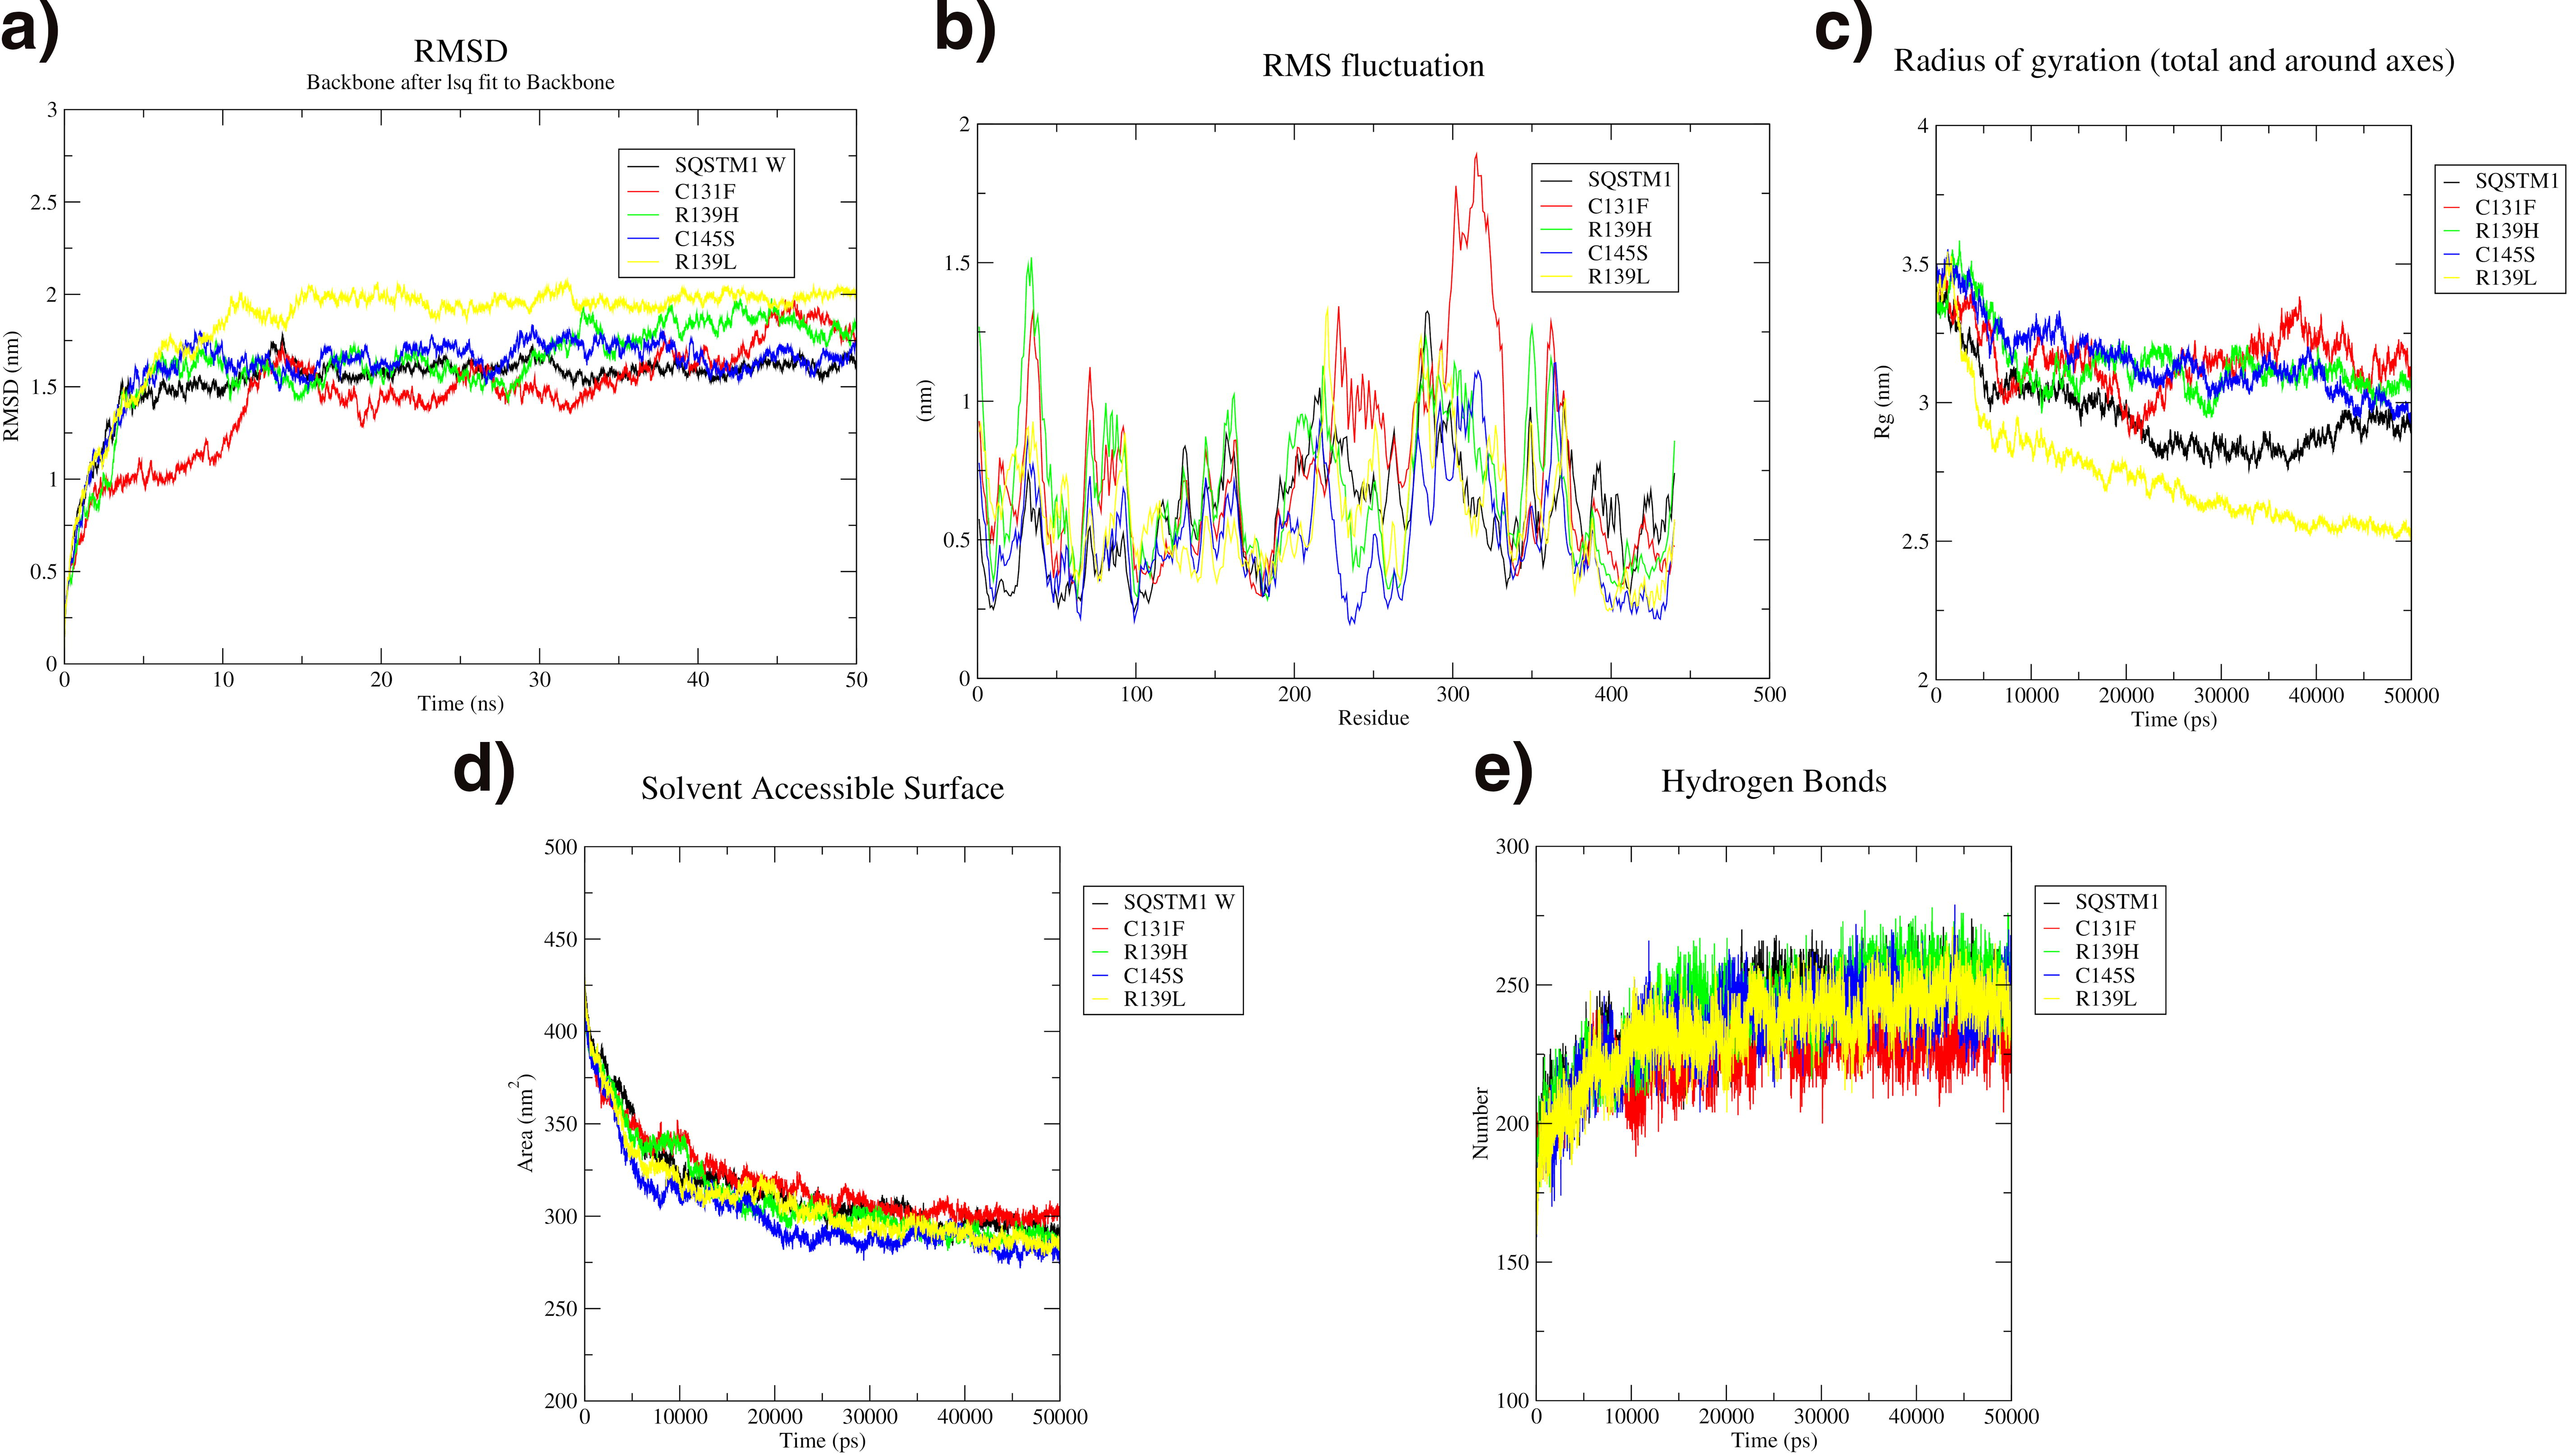
MD simulation analysis of SQSTM1 wild (Black), C131F variant (Red), R139H variant (Green), C145S variant (Blue), and R139L variant (Yellow).
CCND1
The CCND1 wild type and L148F variant both show significant deviations up to 1.5 nm, while the A204T variant remains stable with deviations between 0.80 and 0.90 nm throughout the simulation. RMSF analysis reveals high fluctuations between residues 130 and 160, with the L148F showing the greatest fluctuations among the variants. SASA analysis indicates that the wild type and L148F variant have SASA values ranging from 200 to 175 nm2, while the A204T variant shows slightly lower values between 190 and 160 nm2, with a gradual decrease over time. Hydrogen bond analysis for all variants and the wild type shows a gradual increase throughout the simulation. Overall, the A204T variant exhibits the most stability, with lower deviation and fewer fluctuations compared with the wild type and L148F as shown in Figure 4.
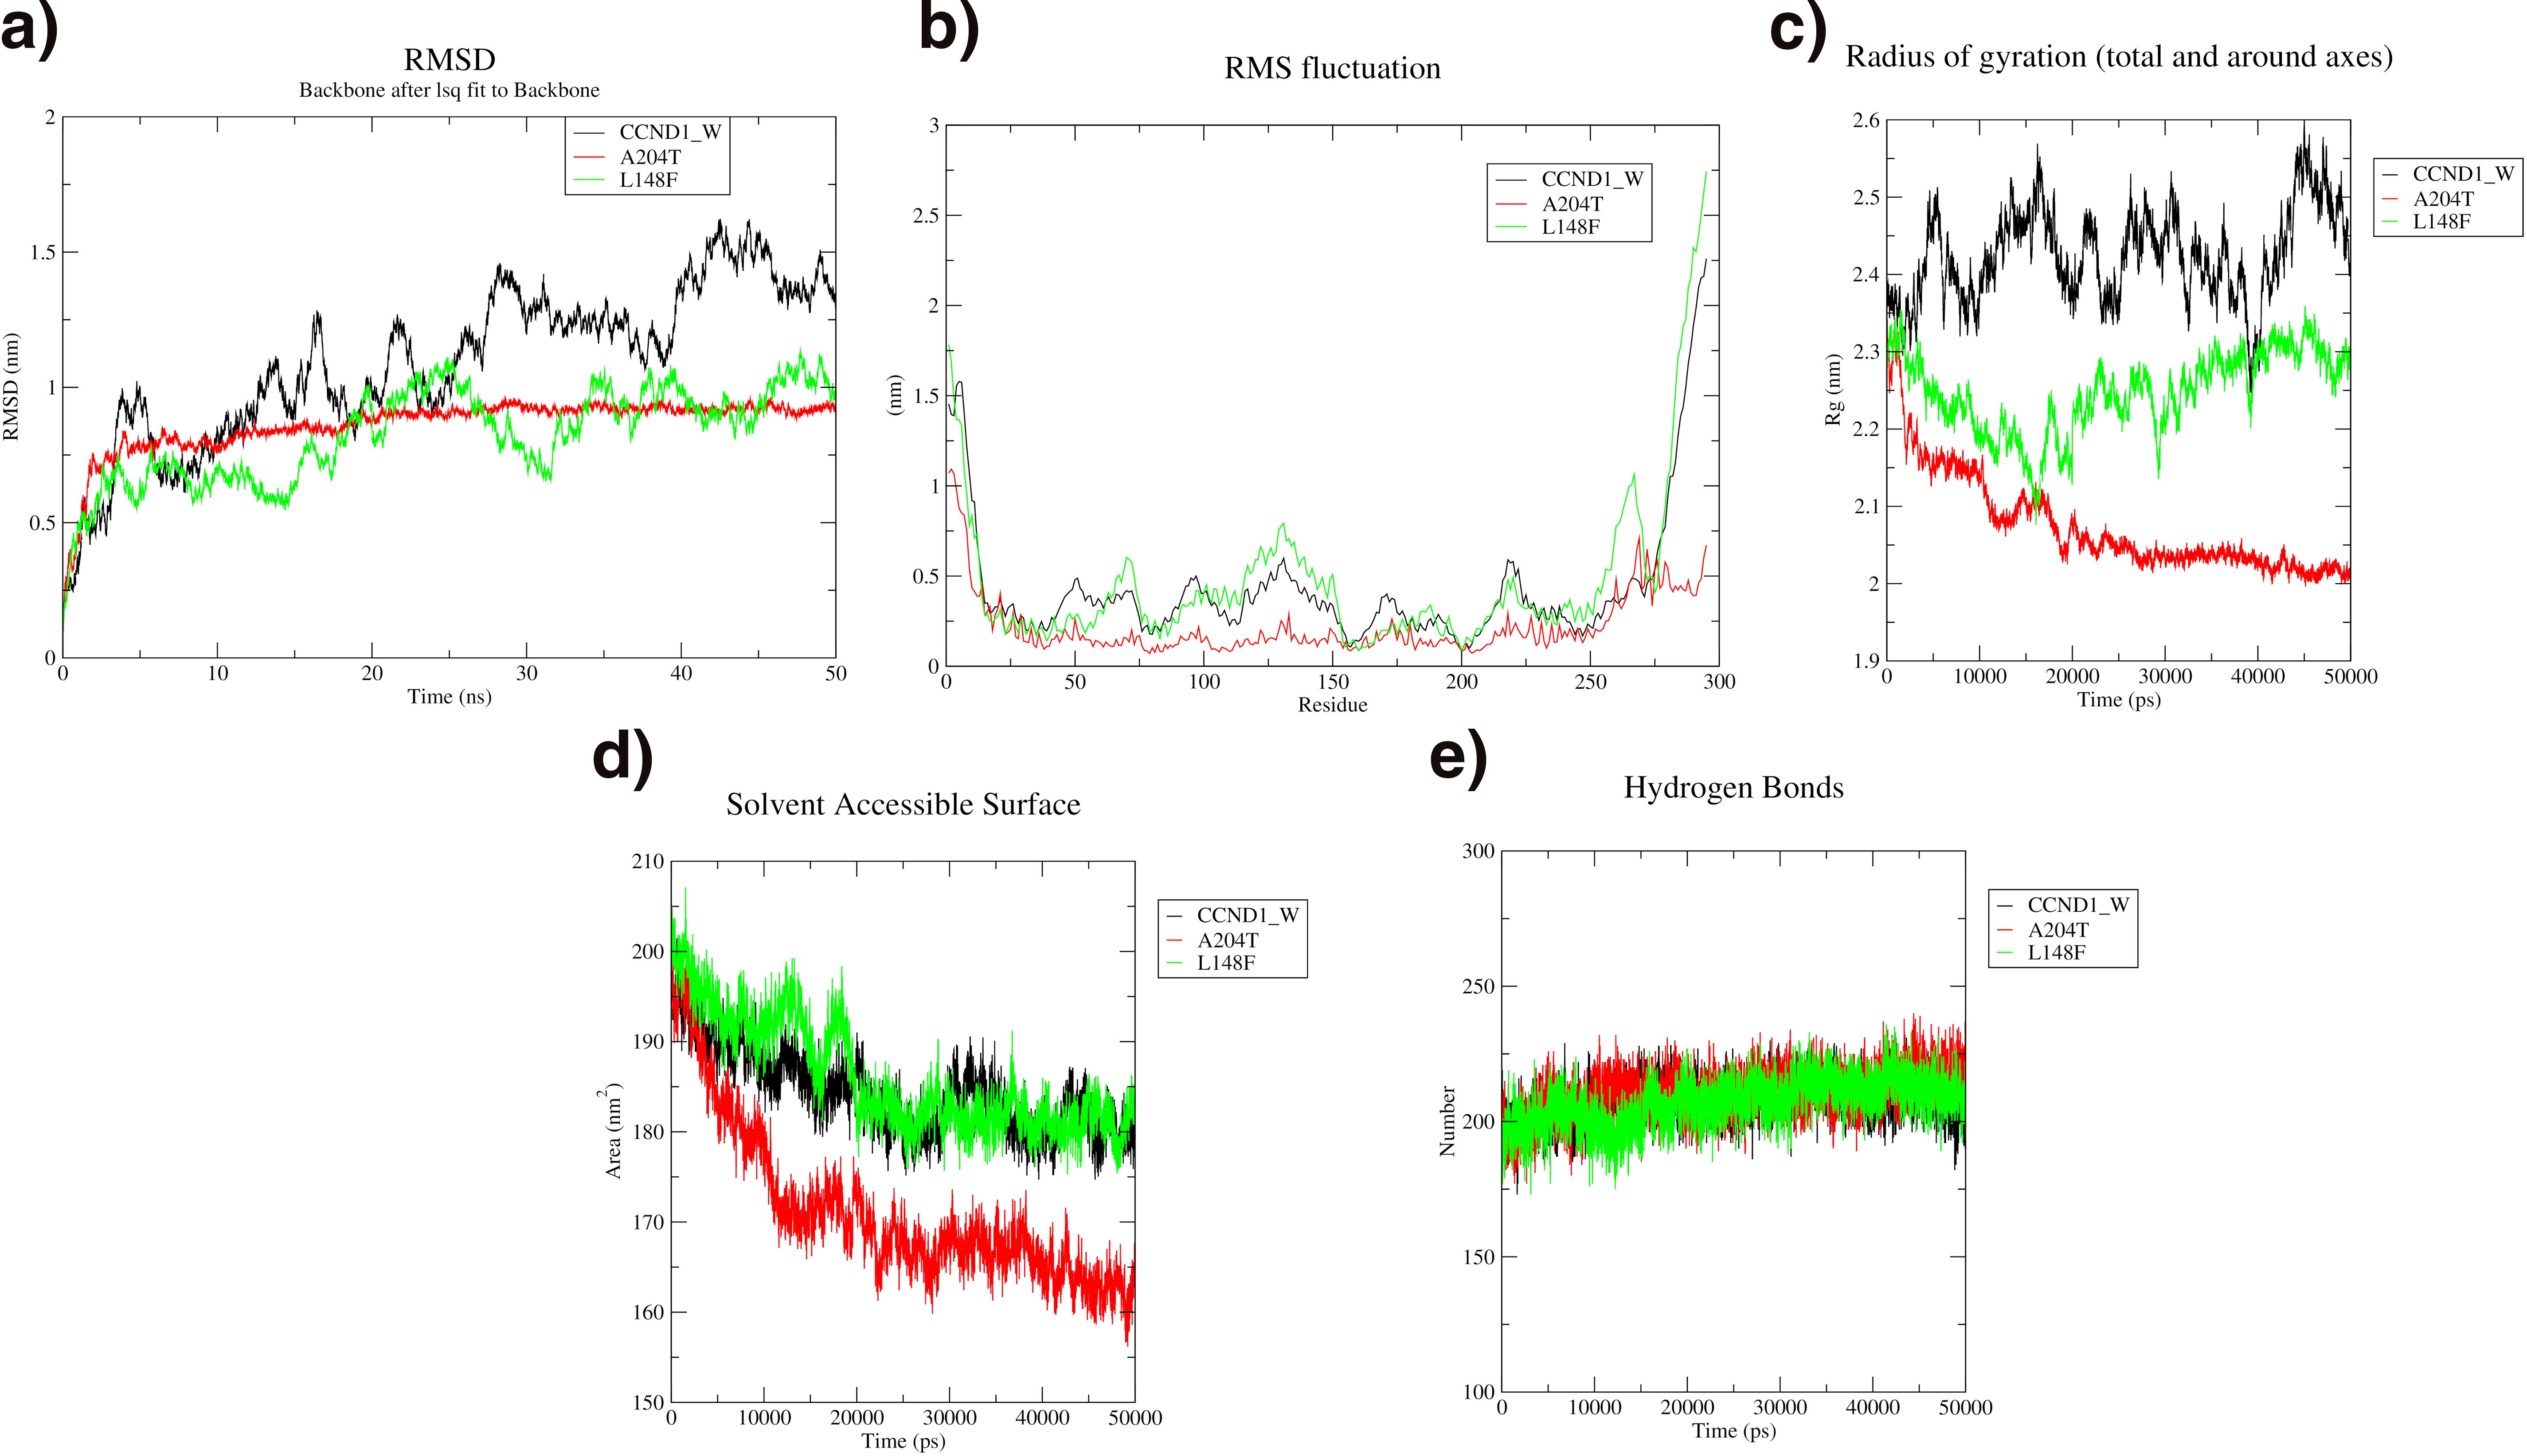
MD simulation analysis of CCND1 wild (Black), A204T variant (Red), and L148F variant (Green).
RELA
RMSD analysis of the RELA wild type and its variants shows significant deviations between 2–2.5 nm, with the V244G variant demonstrating the least deviation and thus greater stability. Significant fluctuations are noted between residues 300 and 530, with the D243H variant exhibiting the highest fluctuations. The system’s compactness decreases over time, as indicated by the radius of gyration, following the order: H86P, R274W, RELA wild type, I250T, D243H, and V244G. The SASA also decreases throughout the simulation, ranging from 500 to 325 nm2. Hydrogen bond analysis shows increased dynamic fluctuations across all variants and the wild type. Overall, the V244G variant is the most stable, exhibiting the least deviation and fluctuation compared with the other variants and the wild type as shown in Figure 5.
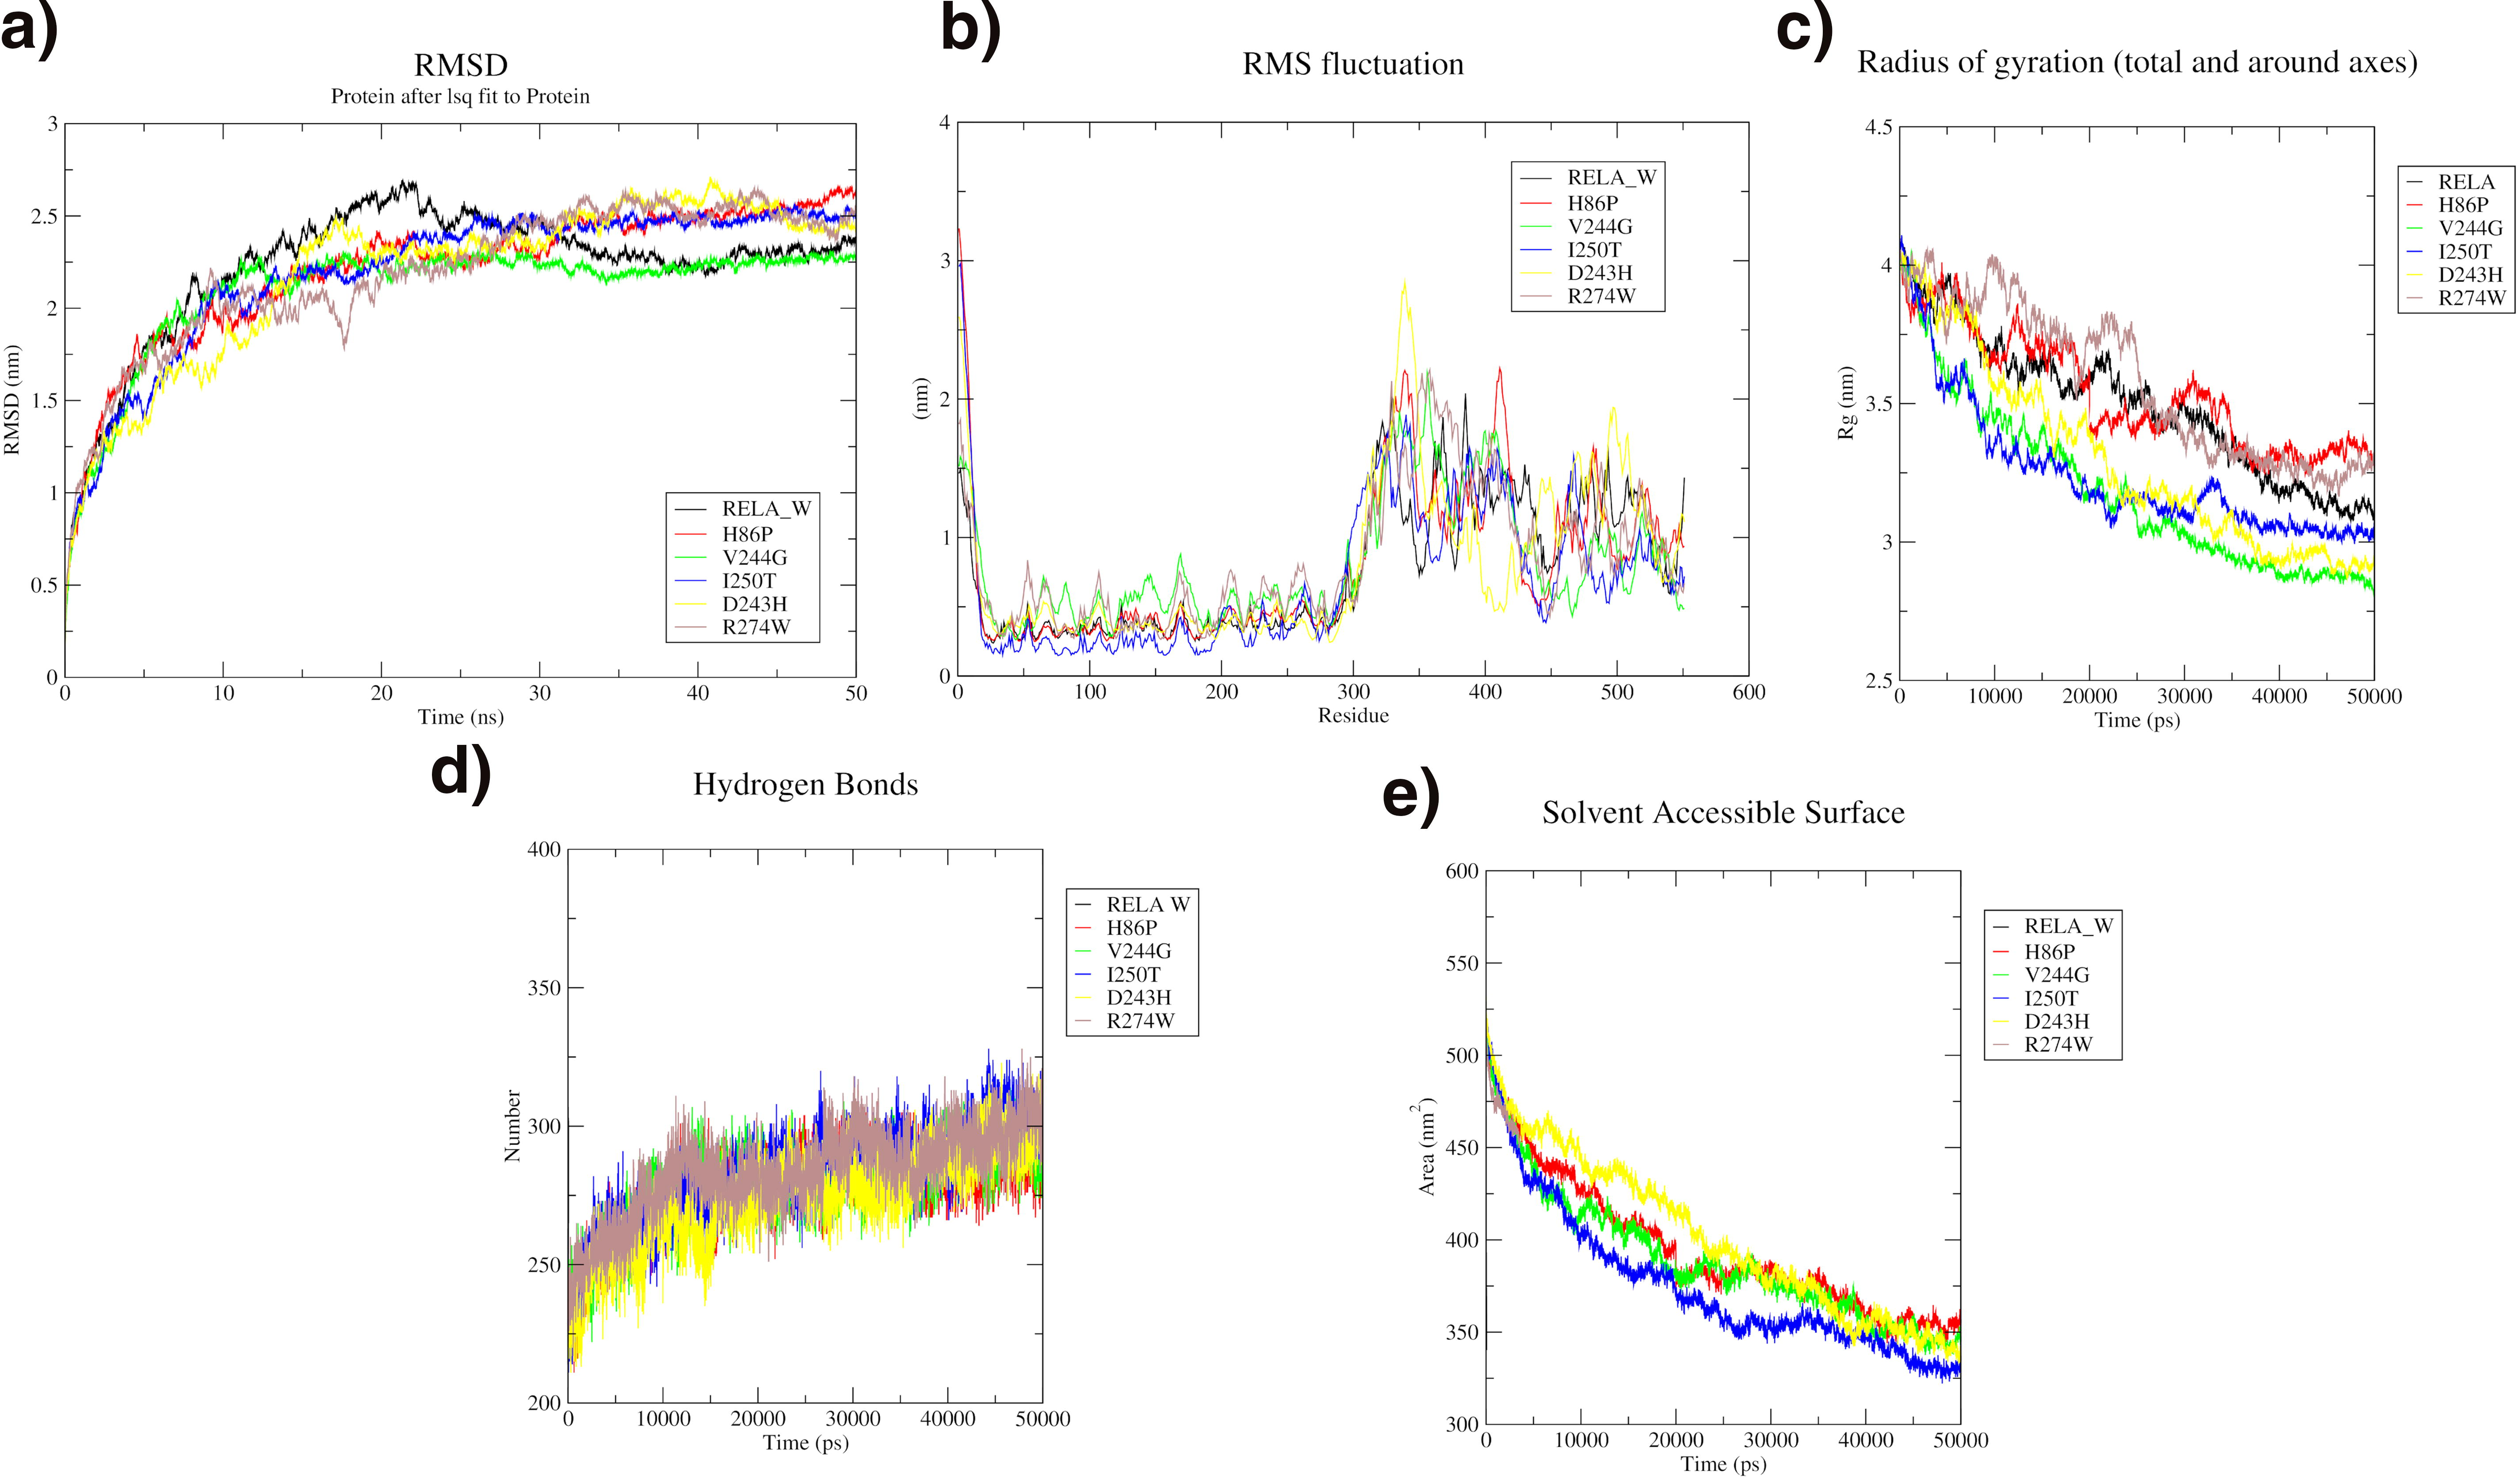
MD simulation analysis of RELA wild (Black), H86P variant (Red), V244G variant (Green), I250T variant (Blue), D243H variant (Yellow), and R274W variant (Brown).
Conclusions
The present computational biology research reports new molecular insights on diabesity candidate genes and the role of nsSNPs that may potentially contribute to diabesity. As diabesity and diabetes continue to be major planetary health challenges, these findings warrant further in vitro and clinical translation research with an eye to precision medicine and therapeutics innovation. In particular, this study aimed to understand the role of nsSNPs in contributing to diabesity, a comorbidity of type 2 diabetes mellitus and obesity, by analyzing their effects on protein stability and function in key genes. The study identified nsSNPs in five key genes EGFR, SRC, SQSTM1, CCND1, and RELA. The nsSNPs in these genes contribute to diabesity by altering protein stability and function, potentially disrupting key pathways related to metabolism, inflammation, and cell proliferation. The identification of destabilizing nsSNPs in these genes highlights their potential as putative biomarkers for early diagnosis of diabesity and as therapeutic targets. Going forward, understanding the differences between wild type and variant proteins is crucial for developing precision medicine and personalized treatments aimed at stabilizing these proteins, thereby offering new possibilities for innovative strategies in the management of diabesity and its associated complications.
Footnotes
Acknowledgment
The computational facility supported by the Department of Biotechnology, Government of India as Bioinformatics Centre (BIC) (BT/PR40163/BTIS/137/31/2021) at the Department of Biotechnology, Anna University, Chennai, is gratefully acknowledged.
Authors’ Contributions
N.K., K.S., and L.K.G. collected the data and performed the study. N.K., K.S., L.K.G., R.B., and K.T. were involved in the analysis and interpretation of data. B.S.L. was involved in the design of the study, analysis, interpretation, and finalization of the article. All authors made a significant intellectual contribution and have reviewed and approved the final article before submission.
Author Disclosure Statement
The authors have no competing interests to declare that are relevant to the content of this article.
Funding Information
The authors thank and acknowledge funding support of the Department of Biotechnology, Government of India through National Network Project (AU-NNP) Grant No: BT/PR40190/BTIS/137/60/2023.

Abbreviations Used
References
Supplementary Material
Please find the following supplemental material available below.
For Open Access articles published under a Creative Commons License, all supplemental material carries the same license as the article it is associated with.
For non-Open Access articles published, all supplemental material carries a non-exclusive license, and permission requests for re-use of supplemental material or any part of supplemental material shall be sent directly to the copyright owner as specified in the copyright notice associated with the article.
