




Abstract
A systems medicine understanding of the regulatory molecular circuits that underpin breast cancer is essential for early cancer detection and precision/personalized medicine in clinical oncology. Transcription factors (TFs), microRNAs (miRNAs), and long non-coding RNAs (lncRNAs) control gene expression and cell biology, and by extension, serve as pillars of the regulatory circuits that determine human health and disease. We report here the development of a regulatory circuit analysis program, miRCuit, constructing 10 different types of regulatory elements involving messenger RNA, miRNA, lncRNA, and TFs. Using the miRCuit, we analyzed expression profiling data from 179 invasive ductal breast carcinoma and 51 normal tissue samples from the Gene Expression Omnibus database. We identified eight circuit types along with two special types of circuits, one of which highlighted the significant roles of lncRNA CASC15, miR-130b-3p, and TF KLF5 in breast cancer development and progression. These findings advance our understanding of the regulatory molecules associated with breast cancer. Moreover, miRCuit offers a new avenue for users to construct circuits from regulatory molecules for potential applications to decipher disease pathogenesis.
Introduction
Breast cancer is a complex, multifactorial disease with heterogeneous clinical phenotypes, and the most frequently diagnosed cancer type among women worldwide (GLOBOCAN, 2020; Polyak, 2011). Breast cancer encompasses numerous subtypes, each exhibiting distinct biological characteristics, treatment responses, and prognostic models (Denkert et al., 2018; Feng, 2023; Kim et al., 2020). Notably, invasive ductal carcinoma (IDC) is recognized as the most prevalent subtype. There is a growing need for new molecular targets that can help foster diagnostic and therapeutic innovation in breast cancer (Marrugo-Padilla et al., 2022; Xu et al., 2024; Zhao et al., 2022). In this context, understanding the mechanisms of gene regulation and identifying the molecular interactions involved in these processes significantly contribute to the identification of new biomarkers (Lu et al., 2021).
For example, transcription factors (TFs), microRNAs (miRNAs), and long non-coding RNAs (lncRNAs) play critical roles in the regulation of gene expression and cell biology, and by extension, serve as pillars of the regulatory circuits that determine human health and disease (Cannell et al., 2008; Lambert et al., 2018; Mitsis et al., 2020; Shaath et al., 2021; Wu et al., 2014).
The regulation of gene expression occurs primarily at two levels: transcriptional and post-transcriptional (Mitsis et al., 2020). While TFs serve as the principal elements in regulating gene expression at the transcriptional level, miRNAs modulate regulatory processes at the post-transcriptional level (Cannell et al., 2008; Lambert et al., 2018). Generally, TFs enhance gene expression levels, whereas miRNAs typically reduce them (Ghafouri-Fard et al., 2021; Lozano-Velasco et al., 2024; Pande, 2021; Rani and Sengar, 2022). Additionally, lncRNAs significantly influence both transcriptional and post-transcriptional regulatory prosses, exerting either positive or negative effects at nearly every stage of gene expression regulation (Shaath et al., 2021; Statello et al., 2021; Wu et al., 2014). Change in the expression of these regulators may alter the expression of other interacting molecules, leading to the development of various diseases, including breast cancer (Dong et al., 2018; Poursheikhani et al., 2021; Rao, 2017; Wang et al., 2017; Yang et al., 2014; Yu et al., 2017; Zhu et al., 2021).
TFs play a critical role in processes such as the proliferation, invasion, and migration of breast cancer cells. For instance, it has been demonstrated that TFs increase invasion in breast cancer cells through signaling pathways (Du et al., 2023; Willis et al., 2015; Wu et al., 2021). Moreover, miRNAs play significant roles in various cancers, with studies revealing that miRNA expression is disrupted in tumor tissues compared with normal tissues (Denli et al., 2004; He et al., 2019; Meltzer, 2005). The repressive effects of miRNAs on target genes contribute to processes such as proliferation, invasion, and metastasis in breast cancer cells (Amir et al., 2016; An et al., 2021). Furthermore, lncRNAs also play a significant regulatory role in cellular processes and can engage with TFs to exert oncogenic functions. Taken together, changes in the expression of these regulatory molecules can alter the expression of other interacting molecules, ultimately laying the foundation for the development of breast cancer. Consequently, understanding the effects of these molecular networks and circuits in breast cancer is crucial for elucidating the pathological mechanisms of the disease and developing targeted and precision/personalized medicine strategies.
Regulatory circuit analysis tools have increasingly gained attention for their potential to elucidate the complex molecular interactions underlying various diseases, including breast cancer. Existing programs, which we summarized in Table 1, are mostly designed for identifying binary relationships, including miRNA-target gene, lncRNA-miRNA, TF-target gene, and miRNA-TF interactions (Li et al., 2018; Liu et al., 2015; Nersisyan et al., 2021; da Silveira et al., 2018; Wang et al., 2022; Wang, 2024). However, these tools are often limited to either binary or triple relationships, leaving a gap in the comprehensive analysis of multi-layered regulatory networks. We report here the development of a regulatory circuit analysis program, miRCuit, constructing 10 different types of regulatory circuits involving messenger RNA (mRNA), miRNA, lncRNA, and TFs, and a robust mechanism for integrating quadruple circuits that helps address this knowledge gap in particular.
Comparison of miRCuit and Different Interaction Programs
DEG, differentially expressed genes; lncRNAs, long non-coding RNAs; mRNA, messenger RNA; miRNA, microRNAs; TCGA, The Cancer Genome Atlas; TF, transcription factors.
Materials and Methods
The present study used publicly available data and did not require informed consent and research ethics board approval. The study was conducted under the overall research ethics oversight of the authors’ institutions.
We identified mRNAs, miRNAs, lncRNAs, and TFs that exhibit significant differential expression between IDC and normal or adjacent normal tissues. Additionally, we developed a circuit analysis tool called miRCuit that elucidates the regulatory interactions among these molecules. The steps both for the differential expression analysis and program development are presented in Figure 1.
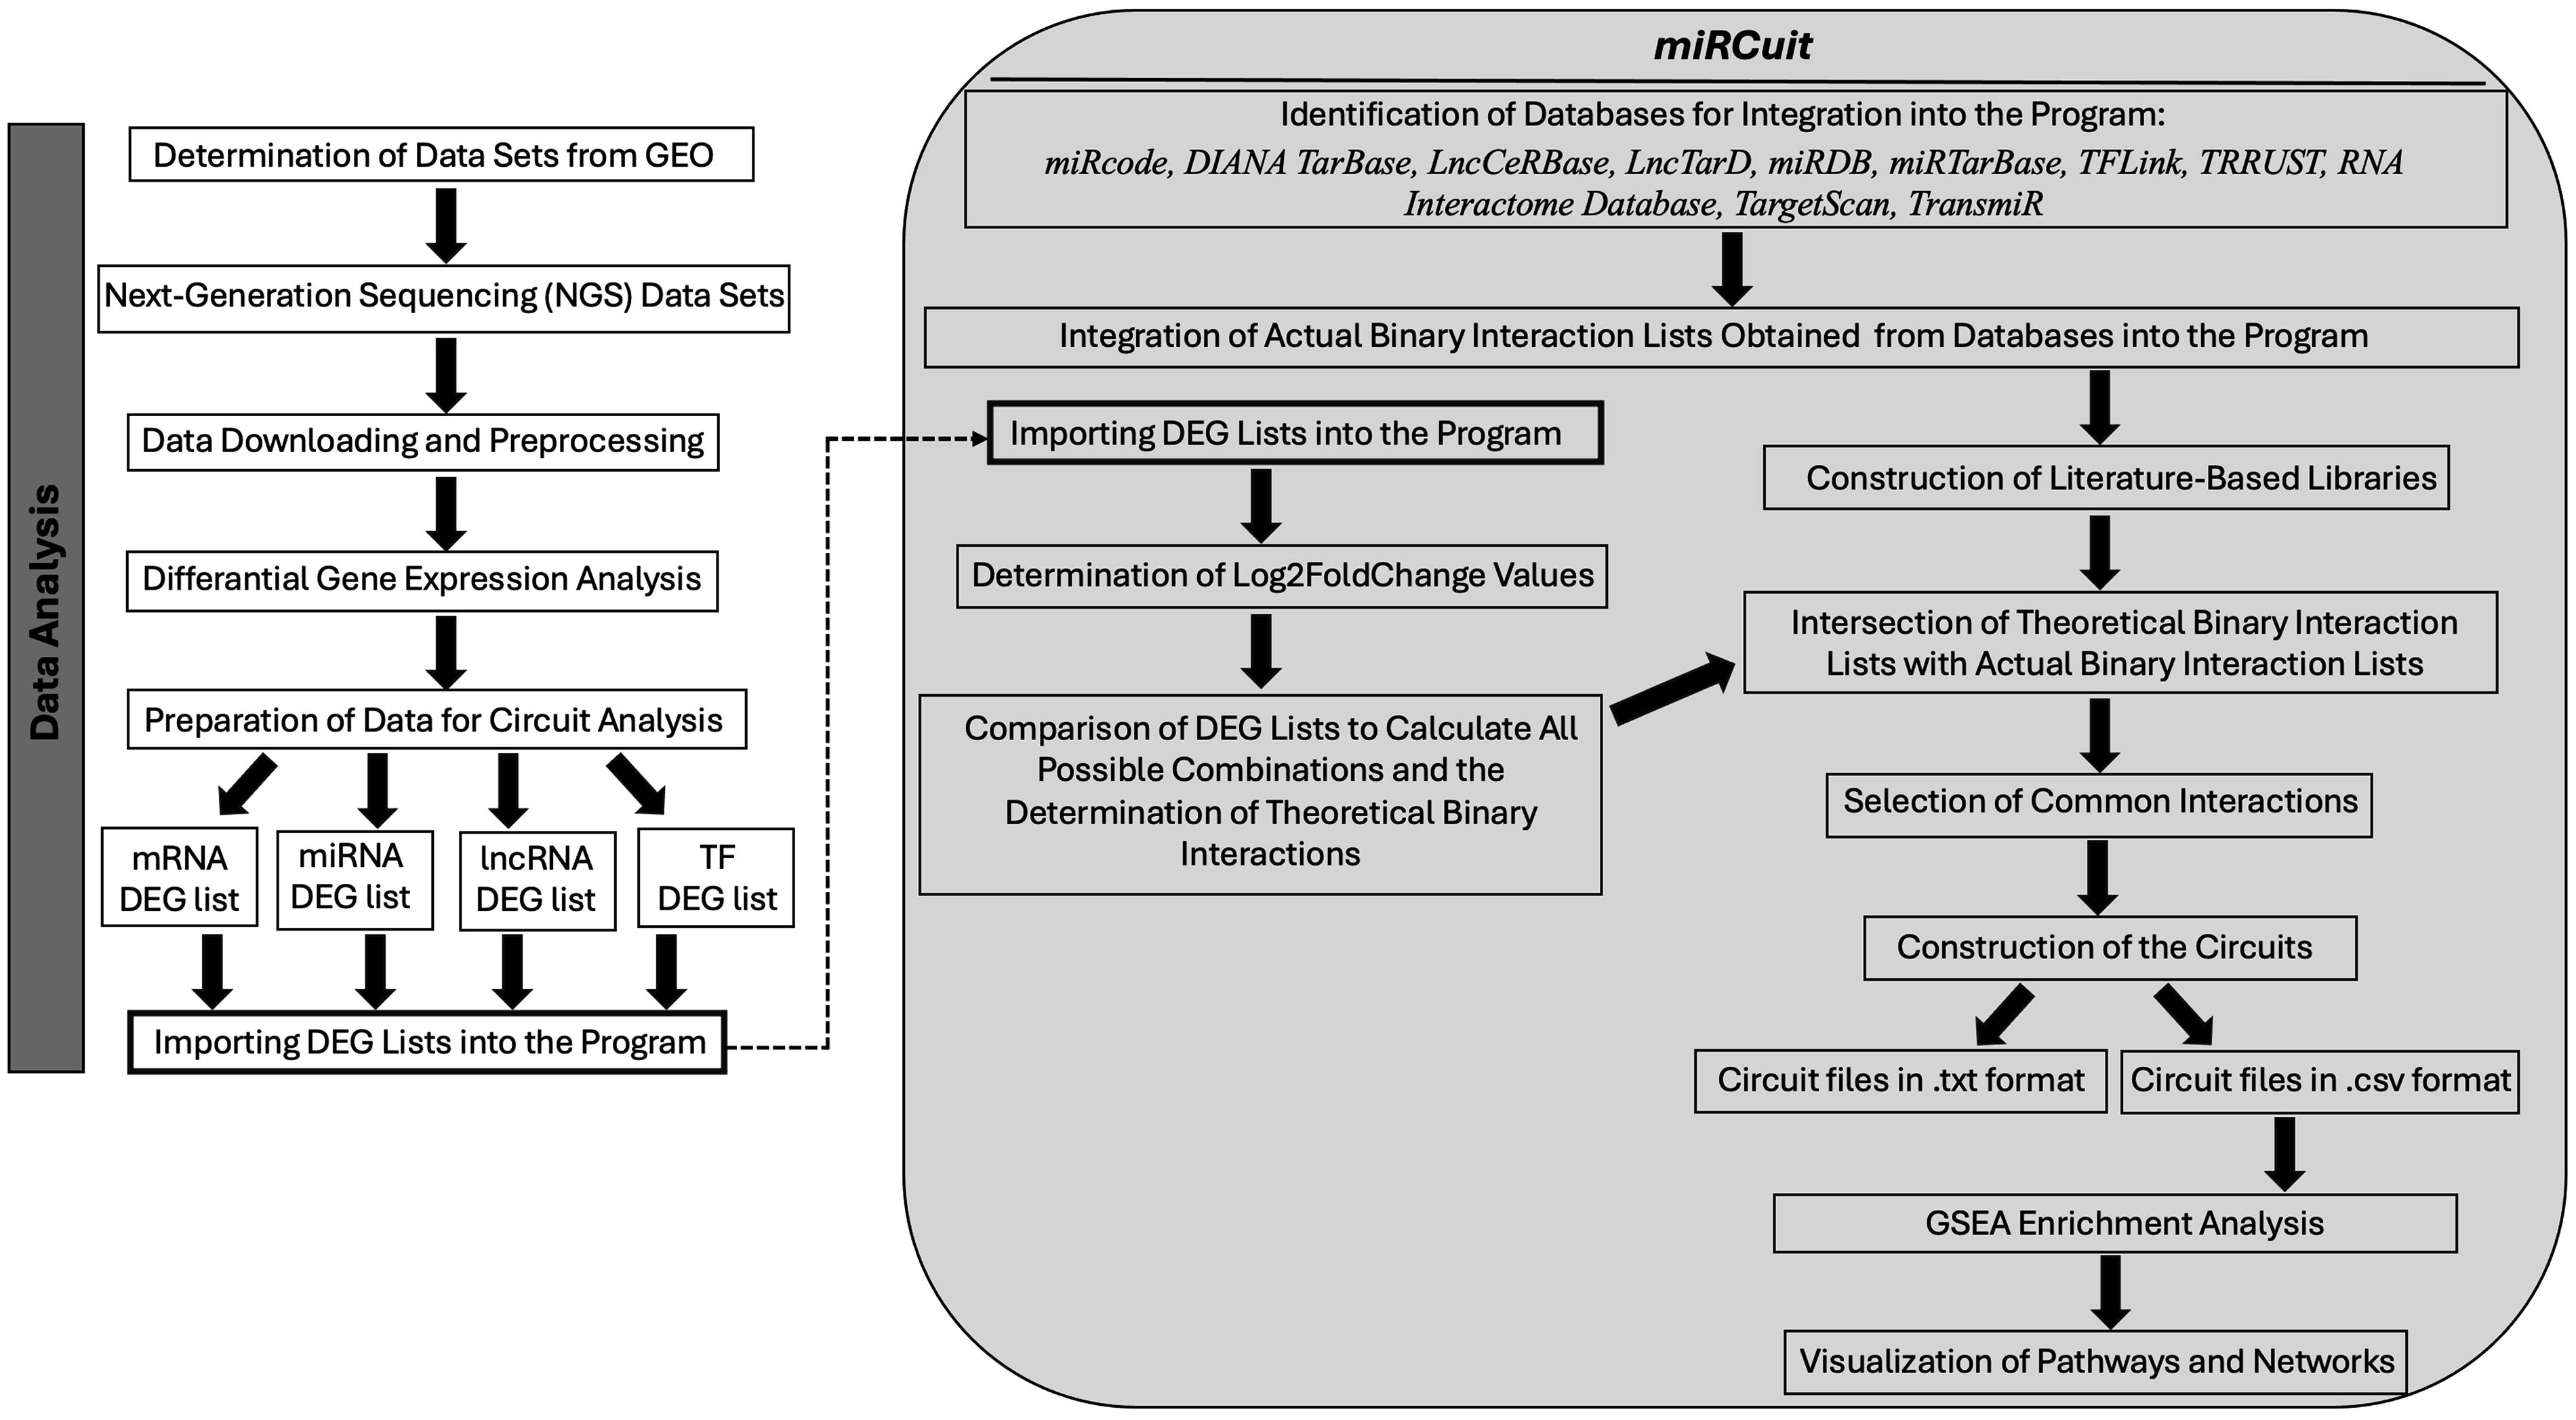
Workflow of the study.
Construction and Analysis of Datasets
Selection of datasets
Next-generation sequencing (NGS) datasets containing invasive breast cancer (IDC) and normal/adjacent normal breast tissues were searched in the Gene Expression Omnibus (GEO) (GEO, 2024) database using the search terms “breast cancer non-coding RNA,” “breast cancer transcriptome,” and “breast cancer RNA-Seq.” Based on these keywords, five studies were identified. The datasets were selected from fresh frozen tissue samples, excluding formalin-fixed paraffin-embedded tissues and cell lines. The datasets were generated without considering differences among the molecular subtypes of the patients. Among five studies identified, three datasets, GSE40049 (Chang and Kuo, 2015), GSE39162 (Persson et al., 2011), and GSE29173 (Farazi et al., 2011), comprised only miRNA data, while the remaining two datasets, GSE71651 (Pang, 2017) and GSE110114 (Kang, 2018), included mRNA, miRNA, and lncRNA data. A total of 179 IDC and 51 normal/adjacent normal samples were included. Details of the datasets are presented in Supplementary Data S1.
RNA-Seq data analysis
Sequence read archive fastq files for the RNA-Seq datasets were downloaded and processed using the fasterq-dump tool (version 2.11.3) (https://hpc.nih.gov/apps/sratoolkit.html) (Maurya et al., 2022). Quality control of the data was performed using FastQC (version 0.11.9) (https://www.bioinformatics.babraham.ac.uk/projects/fastqc/) (Leggett et al., 2013). Given that the Phred score of the data was 30 or higher and that adapter contamination was absent, no trimming was applied. High-quality paired reads were mapped to the human reference genome (NCBI GRCh38.p14) using HISAT2 (version 2.2.1) (Kim et al., 2015). The Sequence Alignment Map (SAM) files obtained were converted to Binary Alignment Map (BAM) format, followed by sorting and indexing using SAMtools (version 1.13) (http://www.htslib.org) (Li et al., 2009). Read counts were obtained using featureCounts (2.0.3) (GENCODE comprehensive gene annotation, version 46) (Liao et al., 2014). Moreover, for RNA-Seq datasets containing only miRNA data, feature counts matrix files were retrieved from the GEO database. DESeq2 method was used to identify differentially expressed genes (DEGs) using the PyDESeq2 (version 0.4.11) (Muzellec et al., 2023) package in Python (version 3.12.0). Ensembl IDs were converted to gene symbols using the sanbomics tool (version 0.1.0) (Sanbomics, 2024) in Python (version 3.12.0).
Preparation of the data for circuit analysis program
The results obtained from the analysis involved mRNAs, miRNAs, lncRNAs, and TFs data collectively. To prepare the data for the circuit analysis program, the four regulatory molecules were separated into distinct lists. Subsequently, the lists of the four types of molecules from all studies were merged to create a single comprehensive list that included differentially expressed mRNAs, miRNAs, lncRNAs, and TFs. These lists were named as mRNA DEG list, miRNA DEG list, lncRNA DEG list, and TF DEG list throughout the text. Additionally, miRNA names in different formats were standardized by removing the “hsa” prefix and replacing it with the “miR” prefix.
The Development of the Circuit Analysis Program
Determination of the databases and construction of the literature-based libraries
Eleven different databases demonstrating molecular interactions were identified to explore the regulatory circuits. These databases include miRcode (Jeggari et al., 2012), DIANA TarBase (Vlachos et al., 2015), LncCeRBase (Pian et al., 2018), LncTarD (Zhao et al., 2023), miRDB (Chen and Wang, 2020), miRTarBase (Hsu et al., 2011; Huang et al., 2022), TFLink (Liska et al., 2022), TRRUST (Han et al., 2018), RNA Interactome Database (Kang et al., 2022), TargetScan (Agarwal et al., 2015), and TransmiR (Tong et al., 2019), and the interactions between molecules are presented in Supplementary Data S2.
The literature-based libraries were constructed by importing binary molecular interactions from the databases into the circuit analysis program and lists with different formats were standardized to a uniform format using Python (version 3.12.0).
Integration of DEG list files into the program and identification of binary interactions
DEG lists of mRNAs, miRNAs, lncRNAs, and TFs were integrated into the circuit analysis program. Log2FoldChange values were determined to be 1.5-fold between IDC and normal/adjacent normal tissues for each molecule type. Subsequently, all possible combinations that could reveal potential interactions between the molecules were determined. As a result, theoretical binary interactions were identified, including TF-mRNA, TF-miRNA, TF-lncRNA, miRNA-mRNA, miRNA-TF, miRNA-lncRNA, lncRNA-mRNA, lncRNA-miRNA, and lncRNA-TF (Fig. 2A). The actual binary interaction lists obtained from the literature-based library (Fig. 2B) were intersected with the theoretical binary interaction lists to identify common interactions. Finally, all interaction lists were prepared for the circuit analysis (Fig. 2C).

Theoretical and actual binary molecular interactions and the formation of regulatory circuits. () Positive regulation, (), negative regulation, () the direction of the interaction is known, but the regulation can be either positive or negative, () Both molecules regulate each other, but the regulation can be either positive or negative.
Construction of regulatory circuits
The regulatory circuits were based on the principle of merging two interaction lists by identifying a common molecule and determining the direction of regulation. The proposed method is based on the following principles: (1) miRNAs repress their target genes, (2) TFs act to activate their target genes, and (3) lncRNAs can exert either positive or negative effects on their targets, as they are involved in both transcriptional and post-transcriptional regulation (Bartel, 2004; Hauptman and Glavač, 2013; Klug et al., 2019; Liu et al., 2014; Maston et al., 2006; Mercer et al., 2009).
Consequently, eight distinct types of regulatory circuits were constructed using the circuit analysis tool (Fig. 3A). In addition, two special lncRNA-containing circuit types were also generated: the miRNA-dependent lncRNA regulatory circuit and TF-dependent lncRNA regulatory circuit, both were created using the circuit analysis tool (Fig. 3B). All circuits were initially obtained in .txt format. However, for further analysis, the circuit files were converted to .csv format and saved as tables in .csv format within the circuit analysis program.

Eight different types of regulatory circuits and special regulatory circuits (miRNA-dependent lncRNA regulatory circuit and TF-dependent lncRNA regulatory circuit). () Positive regulation, () negative regulation, () the direction of the interaction is known, but the regulation can be either positive or negative, () both molecules regulate each other, but the regulation can be either positive or negative.
Integration of gene set enrichment analysis
Gene set enrichment analysis (GSEA) was integrated into the circuit analysis program. GSEA was performed using the pre-rank module (Yoon et al., 2016) from the gseapy library (version 1.1.3) in Python (version 3.12.0). For the analysis, the column containing mRNA data extracted from the circuits .csv files was used. The parameters for the pre-rank module were set as follows: MSigDB_Hallmark_2020 for the gene set, 1000 for the number of permutations, 2 for the minimum gene number, 5000 for the maximum gene number. The genes were selected based on the condition of complying with a false discovery rate (FDR q-val) <0.25 among the obtained results (Subramanian et al., 2005). The results were visualized using the gseapy (version 1.1.3) (Fang et al., 2023), matplotlib (version 3.9.1) (Shopbell et al., 2005), and networkx (version 3.3) (Hadaj et al., 2022) libraries in Python (version 3.12.0).
Development of a User Interface for the Circuit Analysis Program
A user interface for the circuit analysis program was developed using the PyQt5 library (version 5.15.11) (PyQt5 Reference Guide, 2023) in Python (version 3.12.0), as shown in Supplementary Data S3. The user interface operates by allowing users to upload the DEG lists of mRNAs, miRNAs, lncRNAs, and TFs, including gene symbols and expression values, in .csv formats. Following the file uploads, threshold values are set for the uploaded data, corresponding to the two investigated conditions (e.g., IDC/normal tissue) and start the analysis. As a result of the analysis, the program constructs circuits in eight distinct types along with two special types and saves the resulting files in both .txt and .csv formats. In addition, the option to conduct GSEA is available to users. Utilizing this option, users can enrich their selected gene sets with the Molecular Signatures Database (MSigDB) (Liberzon et al., 2015). The results and plots obtained from the GSEA analysis are documented under a distinct section.
The name of circuit analysis program is derived from combination of “miRNA” and “Circuits,” resulting in “miRCuit.” The developed local program is uploaded to the GitHub platform. The GitHub link for the program is https://GitHub.com/miRcuit/miRcuit, where installation documentation and a detailed manual are provided.
The Cancer Genome Atlas Data Analysis
To validate the interactions among the circuit members identified by miRCuit, The Cancer Genome Atlas (TCGA) breast cancer data analysis was performed by using Xena Browser (Goldman et al., 2018).
Results
Differential expression gene analysis of NGS datasets
We identified 156 statistically significant miRNAs in GSE29173, 181 in GSE39162, and 232 in GSE40049, which contains only miRNA data. The results of DEG lists obtained from other RNA-Seq analyses were as follows: 885 mRNAs, 9 miRNAs, 233 lncRNAs, and 59 TFs were obtained from GSE71651, while GSE110114 produced 7783 mRNAs, 21 miRNAs, 1242 lncRNAs, and 718 TFs. A summary table is presented in Supplementary Data S4. The lists of regulatory molecules obtained from all datasets were combined, revealing a total of unique 8171 mRNAs, 354 miRNAs, 1389 lncRNAs, and 740 TFs.
Designing regulatory circuits with “miRCuit”
DEG list files, including gene symbols and Log2FoldChange values, were uploaded to the circuit analysis program miRCuit. A 1.Fivefold threshold option was selected for all files and circuit analysis was conducted resulting in the identification of seven distinct type regulatory circuits and two special-type circuits. These circuits were named according to the types defined in Figure 3. The total number of regulatory circuits for each type is as follows: Type 1 comprises 202,635 circuits, Type 2 comprises 54,914 circuits, Type 3 comprises 39,583 circuits, Type 4 comprises 106,894 circuits, Type 5 comprises 4443 circuits, and Types 6 and 7 each comprise 3 circuits, while no circuits were generated for Type 8.
GSEA of identified regulatory circuits
Among all regulatory circuit types, Type 4 was selected for GSEA analysis, due to its higher number of circuits (106,894) with the inclusion of all regulatory elements. The GSEA analysis results using the mRNA list from circuits Type 4 show that the genes were predominantly enriched in “G2-M Checkpoint,” “E2F Targets,” “Mitotic Spindle,” “Interferon Gamma Response,” and “Interferon Alpha Response” pathways (FDR < 0.25), according to MSigDB. All enriched pathways are listed in Supplementary Data S5.
The dot plot and network visualization of the enriched pathways resulting from the analysis are presented in Supplementary Data S6.
We aimed to decipher the roles of lncRNAs in breast cancer in this study. Hence, we designed miRCuit to generate special lncRNA-based circuits. As a result, a total of 7 circuits were created for miRNA-dependent lncRNA regulatory circuits, while a total of 169 circuits were created for TF-dependent lncRNA regulatory circuits (Supplementary Data S7). Among these specialized regulatory circuits, CASC15 emerged as a prominent lncRNA shared by two distinct circuit types. miR-130b-3p and KLF5 were identified as its key regulatory partners (Fig. 4).
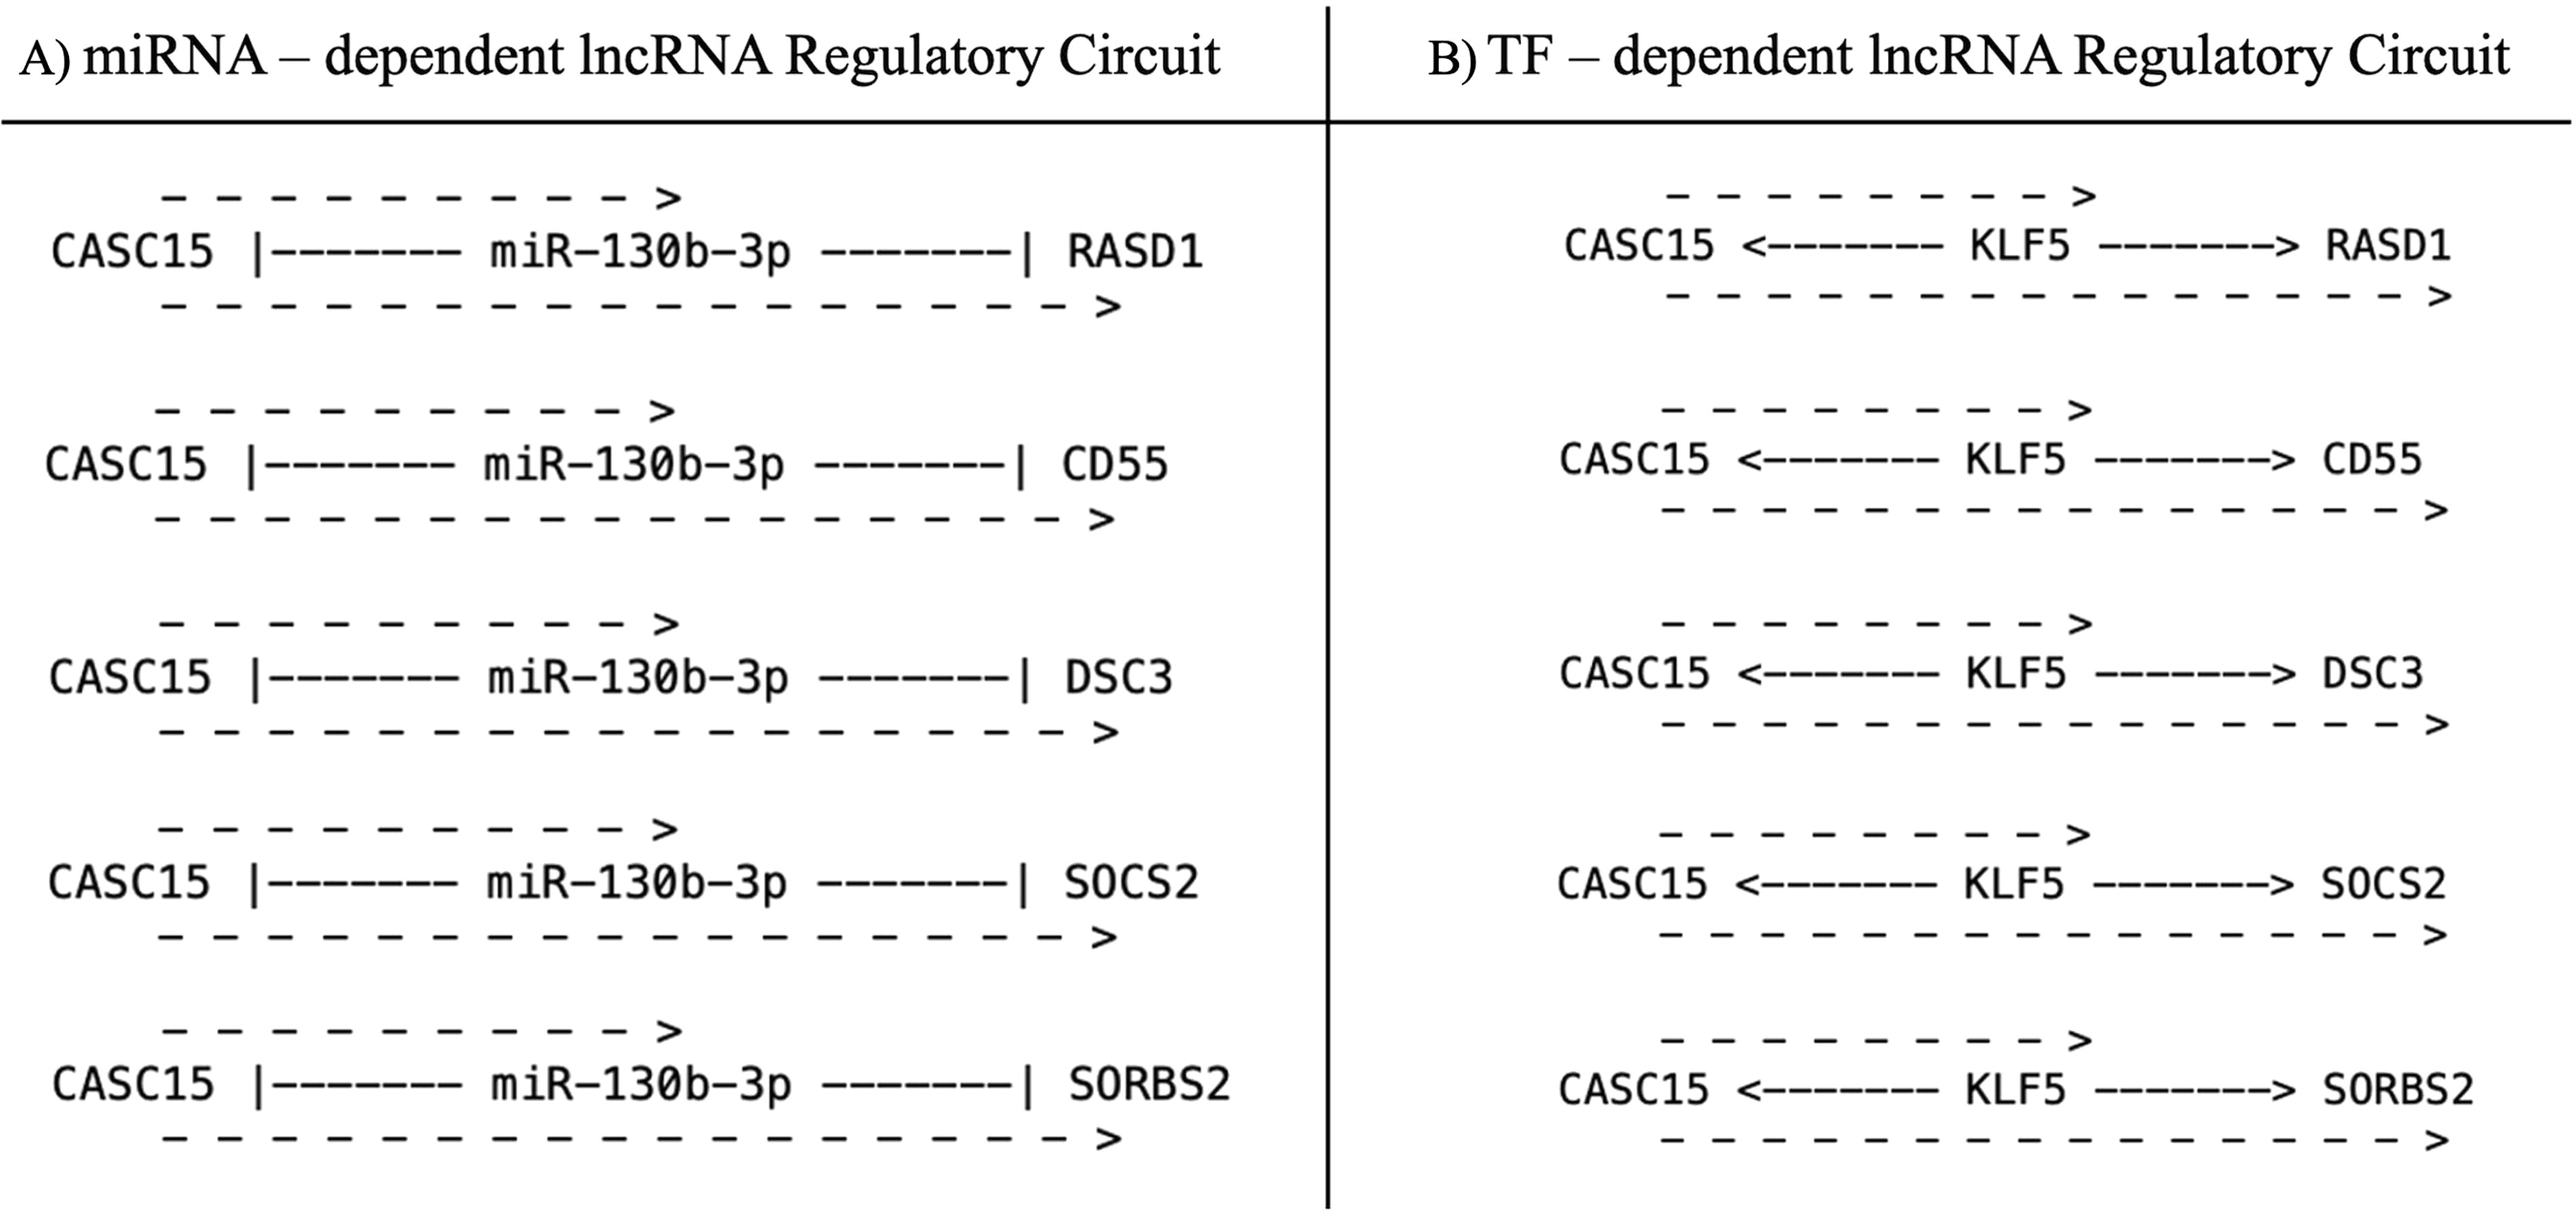
miRCuit-generated CASC15-dependent special circuits.
TCGA Data Analysis
For the verification of relations between members of circuits obtained from miRCuit with an independent data set, we analyzed the expression profiles of CASC15, miR130b-3p, KLF5, and their targets provided in Figure 4 by using TCGA breast cancer data set (GDC BRCA) via UCSC (University of California, Santa Cruz) Xena Browser. miR-130b-3p was found to be significantly upregulated in breast tumor tissues compared with normal tissues while the other genes and lncRNA CASC15 were significantly downregulated in tumor samples compared with normal samples (Supplementary Data S8).
Discussion
Breast cancer is a major planetary health burden. A systems medicine approach that integrates the role of regulatory molecules and networks in cancer pathogenesis is essential for precision/personalized medicine in the oncology clinic. In the present study, we report, first, the development of miRCuit, and second, our findings from expression profiling data from 179 invasive ductal breast carcinoma (IDC) and 51 normal tissue samples from the GEO database.
Currently, numerous web tools have been designed to identify binary relationships, such as miRNA-target gene, lncRNA-miRNA, TF-target gene, and miRNA-TF interactions (Jung et al., 2015; Nersisyan et al., 2021; da Silveira et al., 2018; Wang, 2024; Yang et al., 2023). Moreover, research on regulatory circuits involving triple relationships primarily focuses on constructing miRNA or lncRNA-centric circuits by using currently available online tools or programs (Ke et al., 2022; Liu et al., 2021; Taheri et al., 2022; Xu et al., 2016). Considering the regulatory roles of these molecules within cells, such circuits may prove inadequate in explaining biological processes, systemically (Fabian et al., 2010; Mendell and Olson, 2012; Yang et al., 2014; Yong and Dutta, 2009). Recent studies emphasize the importance of interactions among mRNA, miRNA, lncRNA, and TF molecules in understanding various diseases, including breast cancer and in developing new therapeutic approaches (An et al., 2021; He et al., 2019; Li et al., 2017; Sideris et al., 2022).
However, there is currently no active program that constructs a comprehensive regulatory interaction encompassing these interactions (Gao et al., 2020, 2022; Guzzi et al., 2015; Hao et al., 2024; Wan et al., 2022; Wang et al., 2021; Wang et al., 2022; Ye et al., 2018, 2020; Zhao et al., 2021; Zhou et al., 2019). Other than the current programs mentioned in Table 1 (Li et al., 2018; Liu et al., 2015; Nersisyan et al., 2021; da Silveira et al., 2018; Wang et al., 2022; Wang, 2024), our circuit analysis program, miRCuit, presents this gap by providing a comprehensive framework for analyzing these regulatory networks, specifically presenting a holistic approach to mRNA-miRNA-lncRNA-TF quadruple circuits. However, the program is not web-based and requires users to access it via GitHub, necessitating specific installations and downloads before reaching the interface. This could be perceived as a limitation of the study. Nonetheless, the comprehensive instructions available on GitHub greatly enhance the usability and accessibility of miRCuit for users. On the other hand, miRCuit is compatible with any expression data, as it utilizes DEGs, miRNAs, lncRNAs, and TFs as input. Therefore, expression data obtained from NGS or microarray platforms across various diseases can be analyzed, and disease-related circuits can be identified.
miRCuit has strategies that define all binary interactions to construct circuits, thereby presenting all relationships to users as intermediate outputs, thus providing them with different circuit types ranging from Type 1 to Type 8, which is presented in Figure 3A. Additionally, miRCuit offers users two special regulatory circuits: miRNA-dependent lncRNA regulatory circuits and TF-dependent lncRNA regulatory circuits (Fig. 3B). In this process, the data obtained from 11 distinct databases play an essential role in constructing the circuits.
The obtained circuits are presented in a linear format, providing convenience for both usage and analysis. In addition to visual files provided in linear format, there are also table format files among the outputs that users can utilize for advanced analysis. Additionally, miRCuit sets itself apart from other tools by allowing users to choose threshold values for each expression file providing a section for researchers to indicate how much expression variation they want to consider in their analyses between groups of samples such as disease/control or treatment/non-treatment (Supplementary Data S3).
Another potentially valuable application of the program is its ability to perform GSEA using gene lists obtained from the analysis, allowing users to list enriched genes and create graphs and networks based on the most enriched pathways.
On the other hand, the need of gene expression data is the main limitation for the program. Additionally, the requirement for a list containing a sufficient number of genes suitable for performing GSEA constitutes another limitation of miRCuit (Fang et al., 2023).
We conducted GSEA exclusively on Type 4 regulatory circuits because of the limitations associated with GSEA mentioned above. Furthermore, these circuits included the maximum number of interactions with four regulatory elements (mRNA, miRNA, lncRNA, and TF) simultaneously, which is crucial for capturing the complexity of regulatory interactions. When we analyze the pathways identified through GSEA, it becomes evident that they are significantly associated with cancer-related pathways like “G2-M Checkpoint,” “E2F Targets,” and mTORC1 Signaling” pathways, which underscores the reliability of the tool we developed.
In this study, we considered the expression of 179 IDC samples and 51 normal/adjacent normal tissues. Based on the results obtained, we focused on special-type circuits and emphasized the role of lncRNAs in cancer development, driven by the increasing interest in their regulatory functions. We identified 7 lncRNA-miRNA-mRNA circuits and 169 lncRNA-TF-mRNA circuits. In these circuits, concordant with the literature, the lncRNA CASC15, miR-130b-3p, and TF KLF5 emerged as the most prominent molecules in breast cancer development. The TCGA data analysis that we performed validated the inhibitory effect of miR-130b-3p on its targets together with the positive relation between KLF5 and CASC15. The findings are consistent with the identified regulatory circuits, highlighting the importance of understanding lncRNA-miRNA-TF-mRNA interactions in the pathogenesis of breast cancer.
LncRNA CASC15 is known to function mostly as an oncogene in various cancers, including breast cancer, and shows high-expression levels along with TF KLF5 in breast cancer tissues and cells (Gu et al., 2021; Shen et al., 2024; Shi et al., 2019; Yu et al., 2018). Moreover, it has been demonstrated that miR-130b-3p plays an important role in breast cancer cell invasion and migration. Therefore, it is considered that the miR-130b-3p may be a potential biomarker for breast cancer metastasis (Shui et al., 2017). Hence it could be valuable to reveal the biomarker potential of the circuit, CASC15, KLF5, and miR-130b-3p in breast cancer. Additionally, the regulatory circuits provided by miRCuit that are concordant with the literature supported the robustness and reliability of our program. In this context, the other circuits constructed by miRCuit are worth to investigate for their potential biomarker roles.
Conclusions
We identified eight circuit types along with two special types of circuits one of which highlighted the significant roles of lncRNA CASC15, miR-130b-3p, and TF KLF5 in breast cancer development and progression. These findings advance our understanding of the regulatory molecules associated with breast cancer. Moreover, miRCuit offers a new avenue for users to construct circuits from regulatory molecules for potential applications to decipher disease pathogenesis.
Footnotes
Acknowledgments
The authors thank Efe Dallı for technical support in data acquisition and acknowledge Prof. Dr. Hasan Oğul for his valuable assistance in supporting the Python learning process.
Authors’ Contributions
B.K.: investigation, methodology, data curation, formal analysis, visualization and writing–original draft. B.G.D.: conceptualization, methodology, data curation, formal analysis, supervision, writing–review & editing.
Author Disclosure Statement
The authors declare they have no conflicting financial interests.
Funding Information
The authors received no funding for this article.

Abbreviations Used
References
Supplementary Material
Please find the following supplemental material available below.
For Open Access articles published under a Creative Commons License, all supplemental material carries the same license as the article it is associated with.
For non-Open Access articles published, all supplemental material carries a non-exclusive license, and permission requests for re-use of supplemental material or any part of supplemental material shall be sent directly to the copyright owner as specified in the copyright notice associated with the article.
