
Abstract
Spirometry is an important tool in the diagnosis and management of pediatric pulmonary diseases. Reference equations enable the comparison of an individual's lung function to that of a healthy reference population of the same age, sex, height, and race/ethnicity. This comparison is important both in distinguishing health from disease and in monitoring the lung function of a growing child over time. A range of reference equations exist, and no single equation is ideal for all situations. However, there are important considerations to understand when choosing an equation. This article reviews how reference equations are created, how to use them to interpret lung function measurements, and how to choose appropriate reference equations, highlights current limitations, and suggests areas for future research and collaboration.
Introduction
This article reviews how reference equations are created, how to use them to interpret lung function measurements, and how to choose appropriate reference equations, highlights current limitations, and suggests areas for future research.
How Reference Equations Are Created
Reference equations are generally derived from population-based samples of healthy individuals, utilizing standardized equipment and measurement techniques. Sources of variability between equations include differences in populations, equipment, measurement techniques, and statistical methods. 8 Because of the large effects of race, ethnicity, height, age, and sex on lung function, the most important population differences are in these anthropometric characteristics. 2 Other population differences include the definition of health and the dates of sampling, although these latter characteristics in general have smaller effects on predicted lung function.7,9 In defining “healthy,” some cohorts have minimal exclusion criteria, whereas others exclude individuals based on exposure to cigarette smoke, asthma, or respiratory symptoms. Physician-diagnosed asthma appears to lower median FEV1 in children by 1.5%–3%, whereas a history of ever wheezing in the absence of diagnosed asthma lowers median FEV1 by 0.3%–0.6%. 9 Changes in nutritional status, health status, and environmental exposures over time may introduce cohort effects rendering older equations out of date.2,10–12 Secular trends in lung function may be of greatest concern in reference populations from rapidly developing countries. 9 A recent publication found no such trend in spirometric indices among Caucasian children in Europe and the United States over the past 30 years. 7
An important distinction between equations is whether they are derived from cross-sectional or longitudinal data. Because of the substantial resources required for repeated measurements in a large, population-based sample, most equations are based on cross-sectional data.13–15 However, equations based on longitudinal data9,16–18 more accurately describe the relationship between spirometric measures, age, height, and growth. 19 These issues are discussed further later.
In terms of statistical methods, most reference equations have been developed using linear regression techniques expressing spirometric measurements as a function of both height and age, with separate equations for males and females.9,13,14,16 The relationship between lung function, height, and age is complex, particularly during adolescence, when somatic and lung growths are not synchronous.6,8,20–25 The association of lung volume and standing height changes with maturation because of differences in the growth rates of central and peripheral parts of the body. 19 Thus, it can be difficult to develop 1 equation appropriate for a broad range of ages. Various strategies have been employed to optimally model the relationships of lung function, height, and age, including linear,13,14 logarithmic,9,16 and age-specific 9 models. More recently, the lambda, mu, sigma (LMS) method, 26 widely used to construct somatic growth charts, has been employed to develop all-age reference equations.15,27 The LMS method is an extension of regression analysis that depends on fewer assumptions. Rather than a reference equation, the output of the model is height-, age-, and sex-specific values of the median (mu), coefficient of variation (CV) (sigma), and skewness (lambda) for each lung function parameter, with which an individual's measurement is converted to a Z score (see below), percentile or percent-predicted value.
How to Use Reference Equations in Interpreting Spirometry Results
Reference equations can be used to diagnose abnormal lung function as well as to monitor lung function over time. As reference equations are developed using specific spirometric protocols, the clinical pulmonary function laboratory should utilize the same protocol employed in the reference population. When interpreting spirometry, the first step is to inspect the flow-volume curves to ensure that the maneuvers performed by a given patient meet guidelines for acceptability.28,29 Poorly performed or poorly reproducible maneuvers may give the appearance of disease where none is present. Next, the patient's results are compared with the predicted value from the chosen reference equation. The interpretation should also take into account the patient's clinical history and symptoms.
Clinicians are most familiar with expressing the comparison of the patient's results with the predicted value as a percentage of predicted ([patient result/predicted value]×100). The limitation to use percent-predicted values is that it does not take into account the natural variability of the measurement in healthy individuals, which is different depending on lung function parameter, age, height, sex, and race/ethnicity. For example, as shown in Fig. 1, for FEV1 in 20–30-year-old adults, the between-subject CV (standard deviation/mean×100) is 10%, so the “normal” range (encompassing 95% of the population at a given age) corresponds to 80%–120% predicted. However, at older and younger ages, the CV is higher, leading to a broader range of “normal.” For 6-year-old males, the CV for FEV1 is closer to 20%, so the “normal” range is 60%–140% predicted.
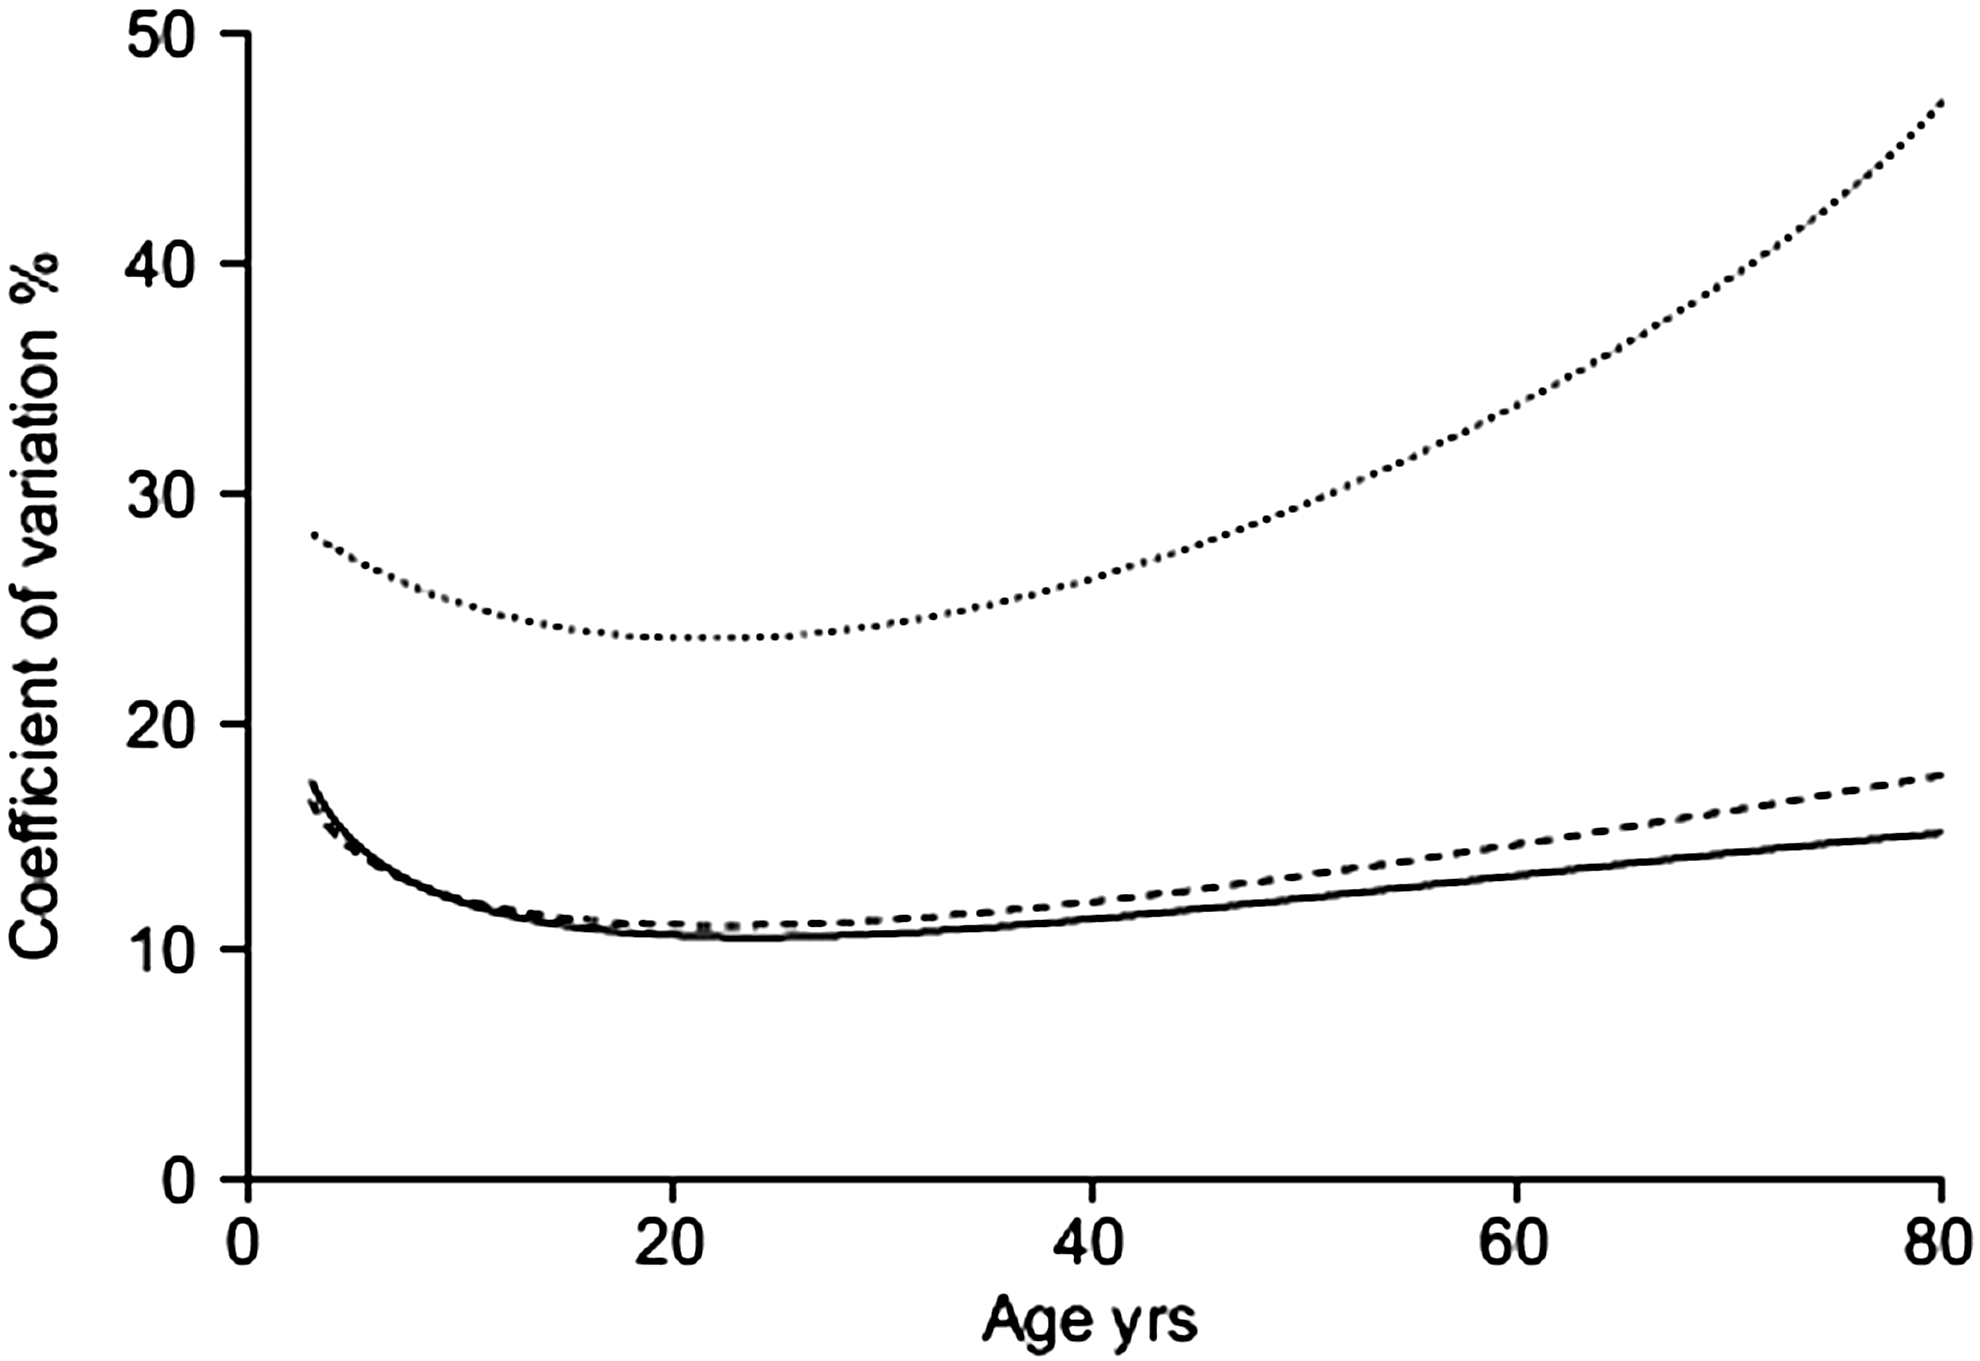
Between-subject variability for FVC (solid line), FEV1 (dashed line), and FEF25–75 (dotted line) in males measured by the coefficient of variation (CV=100×standard deviation/median). CV is 10% for FEV1 and FVC in young adults, leading to a normal range of 80%–120% predicted. In younger and older subjects, CV is larger, leading to a broader range of normal percent-predicted values. CV, coefficient of variation. Reprinted with permission from Stanojevic et al. 8
An alternative to percent-predicted value is the Z score, which accounts for between-subject variability. The Z score is the number of population standard deviations (SD) the individual's result is from the population mean—in this case, the predicted value. Thus, the Z score=(patient result–predicted value)/(population SD). 30 A Z score of 0 corresponds to the population mean (the 50th percentile). About 68% of the reference population's values lie within 1 standard deviation of the mean (Z scores between −1 and +1), and about 95% lie within 2 standard deviations (Z score of −2 to +2).
Importantly, the Z score provides an index that remains constant during growth and can be compared across different sexes, races/ethnicities, and lung function indices. Thus, a particular Z score has the same interpretation regarding the degree of abnormality, regardless of age, gender, race, or lung function parameter. As can be seen in Fig. 1 and as reported by many investigators,31–34 a fixed percent of predicted as the lower limit of normal (generally 80% predicted) can lead to significant age-dependent bias in clinical decision making, whereas the lower limit of normal (the 5th percentile of the distribution in the reference population, corresponding to a Z score of −1.64) has the same interpretation regardless of age, sex, or race. We are, in fact, all familiar with Z scores, as they are similar to the percentiles in pediatric growth grids. Table 1 shows the relationship between Z scores and percentiles for the normal distribution. Because a Z score provides standardized information about the degree of abnormality of lung function, it is recommended over percent-predicted value.
There is not a universal consensus regarding the categorization of the severity of lung function impairment. Such a consensus is urgently needed, particularly for Z scores. Although categories based on percent-predicted values have been suggested,1,2,35 the number of categories and cut-points are arbitrary 2 and can lead to misclassification.31–34 Ideally, severity score should relate pulmonary function to patient-reported indices of function, morbidity, or prognosis. 2 Lung function, whether reported as a percent-predicted value or Z score, should never be used in isolation to define disease severity. 8
Serial measurements of lung function are important in the monitoring of disease, whether assessing for disease progression or treatment response. However, as discussed earlier, almost all published reference equations are based on cross-sectional13–15 as opposed to longitudinal 9 data. There is an assumption that a cross-sectional sample will mimic lung growth for any given person, which has been shown to be inaccurate. 19 Quanjer et al. 16 demonstrated that, whether using Z scores or percent-predicted value, none of 5 widely employed cross-sectional equations13,15,16,36,37 accurately described the relationship between spirometric indices, age, and height in either sex. Each equation showed a pattern of diminished actual FEV1 and FVC relative to the predicted value before age 12, followed by a rise toward adulthood (Fig. 2). This pattern has important clinical implications, as lung function appears better at a young age and at the end of adolescence compared with the early teenage years. This trend should be kept in mind when monitoring an individual's lung function over time, employing cross-sectional reference equations. Although following Z scores enables changes in the degree of abnormality with growth to be appreciated, the use of Z scores does not overcome the limitations of using reference equations derived from cross-sectional data. Further, short- and longer-term intraindividual reproducibility data are urgently needed to assist in interpreting whether an individual's change in lung function is clinically meaningful.

Median values of Z scores for FEV1, FVC, and FEV1/FVC for a cross-sectional data of healthy Dutch children aged 8–18 years, by 5 different reference equations. Reprinted with permission from the American Thoracic Society, Copyright © American Thoracic Society from Quanjer et al. 19
How to Choose Reference Equations
A number of investigators have demonstrated that the choice of equation can influence the clinical interpretation of results.4,5 Thus, rather than relying on the default reference equations in commercial spirometers, an informed choice should be made. The American Thoracic Society and European Respiratory Society have provided specific recommendations regarding the selection and use of reference values (Table 2).2,38 The composition of the reference population should be similar to that of the patients being tested in terms of age, height, and race/ethnicity.2,38 Instruments and lung function testing protocols should be similar in the clinical lab and the reference population. Extrapolation beyond the ages and heights of the reference population should be avoided,2,38 as this practice may significantly over- or underestimate disease burden.4,5 This is particularly relevant when evaluating very young patients, particularly those with growth restriction, such as many patients with cystic fibrosis. For example, in very young, short children, percent-predicted FEV1 is significantly overestimated by the Knudsen equations and underestimated by the Hankinson equations. 5 Employing reference equations generated from a population that includes children of the heights and ages of the children being tested in the laboratory will avoid this problem.
SD, standard deviation.
The European Respiratory Society does not recommend a particular set of reference equations. The American Thoracic Society 2 recommended in 2005 using spirometry reference equations derived from the National Health and Nutrition Examination Survey (NHANES) III 13 for children aged ≥8 years and the equations of Wang et al. 9 for children aged 6–8 years. The NHANES III dataset is one of the few references spanning childhood and adulthood and is also nationally representative and generalizable. However, particularly for pediatric pulmonary function laboratories, it is limited by a lack of subjects <8 years of age, which can result in reference data being inappropriately extrapolated to younger patients or discontinuities when reference equations are changed. The equations of Wang et al. were also derived from a large, nationally representative sample and are based on longitudinal data, but are only available for persons 6–18 and >25 years of age. The discontinuities that are introduced when switching from one reference equation to another may be confusing to clinicians and families.
Since the 2005 ATS recommendations, Stanojevic and colleagues have published a single set of reference equations for Caucasians aged 3–80,15,27 which are based on a large sample size and broad age range, employ LMS modeling techniques, and report results in Z scores or percent-predicted values. These investigators collated the NHANES III data with a number of smaller international datasets from pediatric patients, particularly those <8 years of age. Thus, the Stanojevic equations perform similarly to the Hankinson equations for children >8 years of age, but use of their all-age equations avoids the discontinuities introduced when switching equations at age 8 and is more representative of non-U.S. populations. The Stanojevic reference ranges are becoming increasingly available on commercial spirometers.
The ERS Global Lung Initiative, an international consortium, is just completing reference ranges similar to those of Stanojevic et al. for a wide variety of races and ethnicities. Within this consortium, 64 centers from 28 countries across 5 continents have now shared spirometric data on almost 150,000 healthy, lifelong nonsmokers aged 2.5–95 years. 7 The overall aim of the group is to derive specific prediction equations for different ethnic groups worldwide. This group recently demonstrated the comparability of spirometry datasets comprising >1,000 individuals and a lack of secular trends over the last 30 years, providing a rational for collating datasets. 7 The published Stanojevic equations were developed for non-Hispanic Caucasians. The Global Lung Initiative all-age ethnic-specific equations will be available in 2011 at www.lungfunction.org.
Impact of Race/Ethnicity on Choice and Use of Reference Equations
It has long been established that lung function (volumes and flows) vary by race, even when adjusted for age and height.13,39–48 These differences are in part due to differences in thorax-to-leg length ratios49,50; FVC and FEV1 may be as much as 15% lower in blacks than whites of the same standing height. 13 Quanjer et al. elegantly showed differences in spirometric measures among several races, with the most marked being between Caucasians, Blacks, and Asian Indians. 6 The use of race-specific equations is recommended, when available, over the use of racial correction factors.2,38
Although development of all-age spirometric reference equations for multiple races will represent a significant advance in the sophistication of available reference equations, issues will remain. These equations will not be available for all identified racial and ethnic groups. Even among patients self-reporting the same race, there is significant diversity of genetic backgrounds, which may influence lung function. 41 For instance, patients classified as “African-American” or “Black” in the United States may claim heritage from any of the African or Caribbean nations, may include Caucasian, Native American, or Hispanic (among others) ancestry in their lineage, and may be new immigrants or trace back generations as residents of the Americas. The same can be said for any of the other broad racial categories currently employed for most reference equations.
Although there is no ideal solution to spirometric testing within a racially varied population, particularly one including multiracial individuals, a few considerations can be made to provide as accurate measures as possible. First, the same racial classification should be used at each testing session for a given patient. Consistent racial classification minimizes the impact of any inaccuracies due to race, as the clinician is able to track pulmonary function over time. In addition, we suggest that the pulmonary function technologist inquire as to each patient's racial/ethnic background. This will avoid potential inaccurate assumptions based on appearance and is consistent with methods used to create spirometric reference equations (most of which rely on subject self-reporting of race).9,13,15
Summary and Future Directions
Spirometry is an immensely valuable tool for the assessment and monitoring of pulmonary diseases. Reference equations are a key to spirometric interpretation, both to distinguish health from disease and to monitor individual lung function over time. There are a wide range of available equations, without a single “best” equation for all patients or all clinical laboratories. Several limitations to currently available equations should be acknowledged. Most reference equations are derived from cross-sectional rather than longitudinal data. The number of equations for specific racial and ethnic groups is limited, as is the inclusion of data from children <6–8 years of age.
The Global Lungs Initiative (www.lungfunction.org) is currently creating race and ethnic-specific all-age reference equations based on height and age for individuals aged 3–95 years, using collated cross-sectional data. While acknowledging the significant resources required, the development of race-specific all-age equations based on longitudinal data would be another significant achievement. The evaluation and inclusion of additional anthropomorphic measures such as sitting height could potentially reduce the need for ethnic- or race-specific equations. Given the familiarity of pediatricians with percentiles from growth charts, reporting the percentile to which the Z score corresponds would allow for increased utilization of Z scores, with the improved utility of reference equations that this change would bring.
Clinicians and pulmonary function technicians can only use the tools available. Commercial spirometry device manufacturers could rapidly improve the interpretation of spirometry results by providing a warning if the height and/or age of the patient being tested falls outside the range of the reference population, reporting Z scores as well as percent-predicted values, adding all-age reference ranges 27 to the available reference equations, implementing all-age race- and ethnic-specific equations (www.lungfunction.org) when they become available, and providing software updates with new reference equations in a timely manner in the future. In addition, algorithms employing data on intrasubject test-to-test reproducibility could be developed to assist in deciding whether a patient's change in lung function from a prior visit is clinically significant.
Footnotes
Author Disclosure Statement
No competing financial interests exist.