
Abstract
The aims of this study were to identify hub genes and to analyze gene expression patterns related to infants with acute respiratory infections (ARI) of respiratory syncytial virus (RSV), human rhinovirus (HRV), and influenza A. Transcriptome data of GSE38900 were obtained from the Gene Expression Omnibus database. The differentially expressed genes (DEGs) related to three groups (RSV, HRV, and influenza A) were respectively identified based on the Linear Models for Microarray Data package, comparing samples infected with one virus (cases) to those infected with the other two viruses as well as healthy matched subjects (controls). Prediction of microRNAs and transcription factors were performed based on the Molecular signatures database. The protein–protein interaction (PPI) network and its modules were constructed. Functional and pathway enrichment analyses were performed based on the expression analysis systematic explore test. We identified 840 common DEGs among the three groups. Several microRNAs and transcription factors were revealed. The PPI network of common DEGs was constructed, and five modules in the PPI network were mined. CTNNB1, YWHAE, DDB1, RPL5, PLCG1, SHC1, PPP2R2B, and PML were hub genes in the dysregulation network. These genes were involved in ribosomal function, biochemical reaction activity, signal transduction, and cell death. In conclusion, this study presented hub genes in infants with ARI of RSV, HRV, and influenza A (ARIs-RHI). Moreover, the dysregulation of ribosomal genes combined with gene expression patterns in ARIs-RHI were also revealed.
Introduction
T
Modulation of host gene expression is a battle between the virus and the host's antivirus immune response.12,13 The host's immune response could be enriched in several pathways. New antiviral therapeutics have often been developed by understanding the effects of infections on the host gene response. For RSV, both the highly upregulated gene IFI27 and the significant downregulated gene CLC were identified in the whole blood of infants hospitalized with RSV and other types of ARI.5,14,15 In HRV infection, enhanced immune-related genes (e.g., IL-6 and IL-8) 16 and mucin-related gene expression (e.g., MUC4, MUC5AC, and MUC8) 17 were observed in nasal epithelial cells. Therefore, lycopene, which offers protection from the adverse effects of inflammation, may be helpful. 18 For influenza A, agents with antiviral and antioxidant activities, such as N-acetyl-L-cysteine, were potential drugs of choice for the treatment of patients with severe influenza A–associated complications, 19 since suppressing the SOD1 gene enhances virus replication. 20 Nevertheless, treatment of viral infection was still limited because of the lack of clinical studies. 21
Therefore, it is important to identify the gene expression response for respiratory-related infections compared with normal subjects in order to discover the underlying pathogenesis of novel human genome targets, as well as to seek novel treatment of viral infection and prevention of related complications. Interestingly, recent studies on global gene expression during viral infection showed that several genetically distinct respiratory viruses modulated common host proteins and biological pathways. 22 This provides opportunities for developing drugs that potentially affect multiple viral pathogens by targeting common host proteins and pathways, as well as reducing the evolution of drug resistance by constraints of activation of essential host pathways for viral proliferation. 23
In the present study, through whole blood RNA transcriptional profiles of infants, differentially expressed genes (DEGs) were identified in RSV, HRV, and influenza A groups, and common sets of genes (referred to as common DEGs) were determined among the three groups. Subsequently, microRNAs and transcription factors were predicted based on the common DEGs. Since proteins seldom perform their functions in isolation, it is important to understand the interaction of these proteins by studying larger functional groups of proteins. The biomolecular interaction networks with biological relevance were integrated into a unified conceptual framework. Study on disease-related gene expression networks, which are involved in ARIs of RSV, HRV, and influenza A (ARIs-RHI), has an impact on the discovery of mechanisms, the diagnosis and classification of disease, and the design of therapies. 24 To this end, the protein–protein interaction (PPI) network and modules involved in the PPI network were constructed. Finally, common DEGs were researched by function and pathway enrichment analysis.
Materials and Methods
Identification of gene expression data sets
In the present study, three groups of DEGs (RSV, HRV, and influenza A) were examined and compared with controls. The publicly available transcriptome data sets were extracted from the National Center for Biotechnology Information Gene Expression Omnibus (accession number: GSE38900). In the present study, the single Illumina platform was used, and all non-normalized gene expression data from whole blood RNA samples were obtained using the Illumina Human WG-6 v3 platforms with 49,576 probes.25,26
Samples of GSE38900 27 with healthy age- and sex-matched controls were collected from infants <2 years old who suffered from ARIs caused by the three different viruses.
Whole blood samples collected from RSV patients (RSV group) contained 107 samples, which were divided into two batches. Batch 1 included 91 patients from Dallas, Texas, while batch 2 included 16 patients from Turku, Finland. Whole blood collected from infants infected with HRV (HRV group) included 30 patients from Dallas, Texas. Samples infected with influenza A (influenza A group) included 16 patients also from Dallas, Texas. Whole blood samples collected from healthy controls were divided into two batches: 27 subjects from Dallas, Texas, and four subjects from Turku, Finland. Infants with documented bacterial co-infections, viral co-infections, chronic lung disease, and other such diseases were excluded. 27
Data processing and identification of common DEGs
Illumina Bead Studio/Genome Studio software was used to remove the background and to scale the average samples' signal intensity, as described in the original studies.25–28 The platform annotation files for Illumina Human WG-6 v3 platforms were used to map the relationship between the probes and gene symbols.
Next, signals were normalized to the median intensity of that probe across all samples. The probe-level non-normalized data in TXT files were normalized and converted into expression measures in the R environment.29–31 Briefly, if the signal intensity values was <10, the fluorescent units were set as equal to 10. The probe was filtered if there is no corresponding gene symbol. For the normalization of each gene, the median intensity for each probe across the median of each control group was obtained. Then, the signal intensity of each probe in each sample was normalized by this median intensity. This normalization process was applied across all probes in all samples.
The normalized data were converted into the ExpressionSet object in the R environment. After setting the cases and corresponding controls, the average value of the gene symbol with multiple probes was obtained.
DEGs were identified based on the Linear Models for Microarray Data package. 32 The false discovery rate was controlled with the Benjamini Hochberg test. 33 Only the genes that met our criterion (p<0.05) were selected as DEGs between cases and controls. Three groups of DEGs (RSV, HRV, and influenza A) were respectively displayed, comparing samples infected with one virus to that infected with the other two viruses as well as the healthy matched controls. For example, we identified the DEGs of the RSV group using the experiment samples of those infected with RSV as cases, and the samples of those infected with HRV and influenza A, and the healthy controls. Next, the three groups of DEGs were combined (intersection) as the common DEGs for further analysis.
Prediction of microRNAs and transcription factors
The molecular signatures database 3.0 was used for the prediction of microRNAs and transcription factors.34,35
As an important regulatory element, microRNAs and transcription factors can regulate gene expression. Taking upstream sequences of the common DEGs as the analyzed object, the related microRNAs and transcription factors with their potential binding sites were predicted. 36
The hypergeometric statistical test
37
was used in the predictions with the WEB-based Gene Set Analysis Toolkit. Suppose that there are n genes in the interesting gene set (A) and N genes in the reference gene set (B), while there are k genes in A and K genes in B that are in a given category (C). If B represents the population from which the genes in A are drawn, Gene Set Analysis Toolkit uses the hypergeometric test to evaluate the significance of enrichment for category C in gene set A.
In this test, the p-values needed to be adjusted for multiple tests, and the Benjamini Hochberg test was used to adjust the p-values. A threshold of >2 genes and a p-value of <0.01 were considered significant. All of the predictions were performed using the Web-based Gene Set Analysis Toolkit.37–39
Construction of PPI network and modules
In the present study, the PPI data were downloaded from Search Tool for the Retrieval of Interacting Genes/Proteins database (http://string.embl.de/). Subsequently, the common DEGs were imported into the interaction network, and they were screened with both end nodes.
The biomolecular interaction network was integrated using a general-purpose modeling environment, which was an open source project named Cytoscape. In PPI networks, the node represents the protein (gene), and the edge represents the interaction of proteins (genes). The degree of a node represents the number of edges that connect with the nodes. Hub genes are important disease-related candidate genes extracted from the networks, which have the potential to affect many other genes due to higher connectivity. 40 Genes with a higher degree of connectivity (i.e., top 1%) are hub genes. Because of the higher connectivity, hub genes have an important biological function during disease progression.
To find highly interconnected regions in the network, the network was detected using a molecular complex detection algorithm.41,42 This algorithm is able to recognize the specific functional modules by selecting the clusters with densely connected nodes from the network. 42 Nodes represent biomolecules, and the edges between the nodes indicate physical or functional interactions in a molecular network. A node score cutoff of 0.2, K-core of 3, and Max.depth of 100 were set as the parameters to detect modules for the common DEGs.
Functional and pathway enrichment analysis
To identify the biological functions and perturbed pathways of common DEGs, gene ontology (GO) enrichment analysis and Kyoto Encyclopedia of Genes and Genomes (KEGG) pathway enrichment analysis were performed. 43 Both the GO and KEGG analyses were performed based on the Database for Annotation, Visualization, and Integrated Discovery. 43 Bioinformatics resources in the Database for Annotation, Visualization and Integrated Discovery, which contain an integrated biological knowledgebase and analytic tools, could systematically extract biological meaning from a large number of genes or proteins.
The Expression Analysis Systematic Explore test was applied to detect the significant categories in the functional and pathway enrichment analysis. 44 The Expression Analysis Systematic Explore test of the regulated genes indicated molecular functions and biological processes unique to each category. 45 An Expression Analysis Systematic Explore score of <0.01 and >2 genes for the corresponding term were considered significant for a category.
Results
Identification of common DEGs
After normalization and processing of the data sets, a total of 840 common DEGs were revealed. The 840 common DEGs were identified from infants with ARIs, which were caused by the three different viruses. These 840 common DEGs were selected for further research. In addition, genes that associated with ribosomal functions, such as RPL14, RPL17, RPL21, RPS18, and EEF2, were present in the 840 common DEGs.
Prediction of microRNAs and transcription factors
For the prediction of microRNA targets, the top-10 terms were identified (Table 1). Terms of miR-15A, miR-16, miR-15B, miR-195, miR-424, and miR-497 were most significant, which bound the target sequence TGCTGCT, with a p-value of 5.44×10⁻⁹.
The maximum p-value in the hypergeometric statistical test controlled by the Benjamini Hochberg test is 0.01; the minimum number of genes for the corresponding potential microRNA (Count) is 2.
For the prediction of the transcription factor targets, transcription factors with their binding site motifs were revealed. The top-10 predicted transcription factors were shown in Table 2. The most significant transcription factor was SP1, with a p-value of 8.94×10⁻²³. SP1 may regulate the target genes by binding the target sequence GGGCGGR.
The maximum p-value in the hypergeometric statistical test controlled by the Benjamini Hochberg test is 0.01; the minimum number of genes for the corresponding potential transcription factor (Count) is 2.
Construction of PPI network and modules
The main component of the PPI network, including 366 common DEGs, was selected (Fig. 1). As shown in Figure 1, common DEGs were tightly connected with each other and were attended in a whole network. In this paper, these genes with degrees >14 (top 1% of degree) were identified as hub genes. Among the nodes, CTNNB1 showed the highest degree (21), followed by YWHAE, DDB1, and RPL5, with degrees of 20, 17, and 16 in the network, respectively. PLCG1, PPP2R2B, and SHC1 were also significant, with a degree of 15. In addition, PML gene was also significant, with a degree of 14 in the network. Hub genes were labeled in the PPI network with dark purple circles. Topological parameters on centrality in the main component of the PPI network are shown in the Supplementary Data (Supplementary Data are available online at www.liebertpub.com/ped).
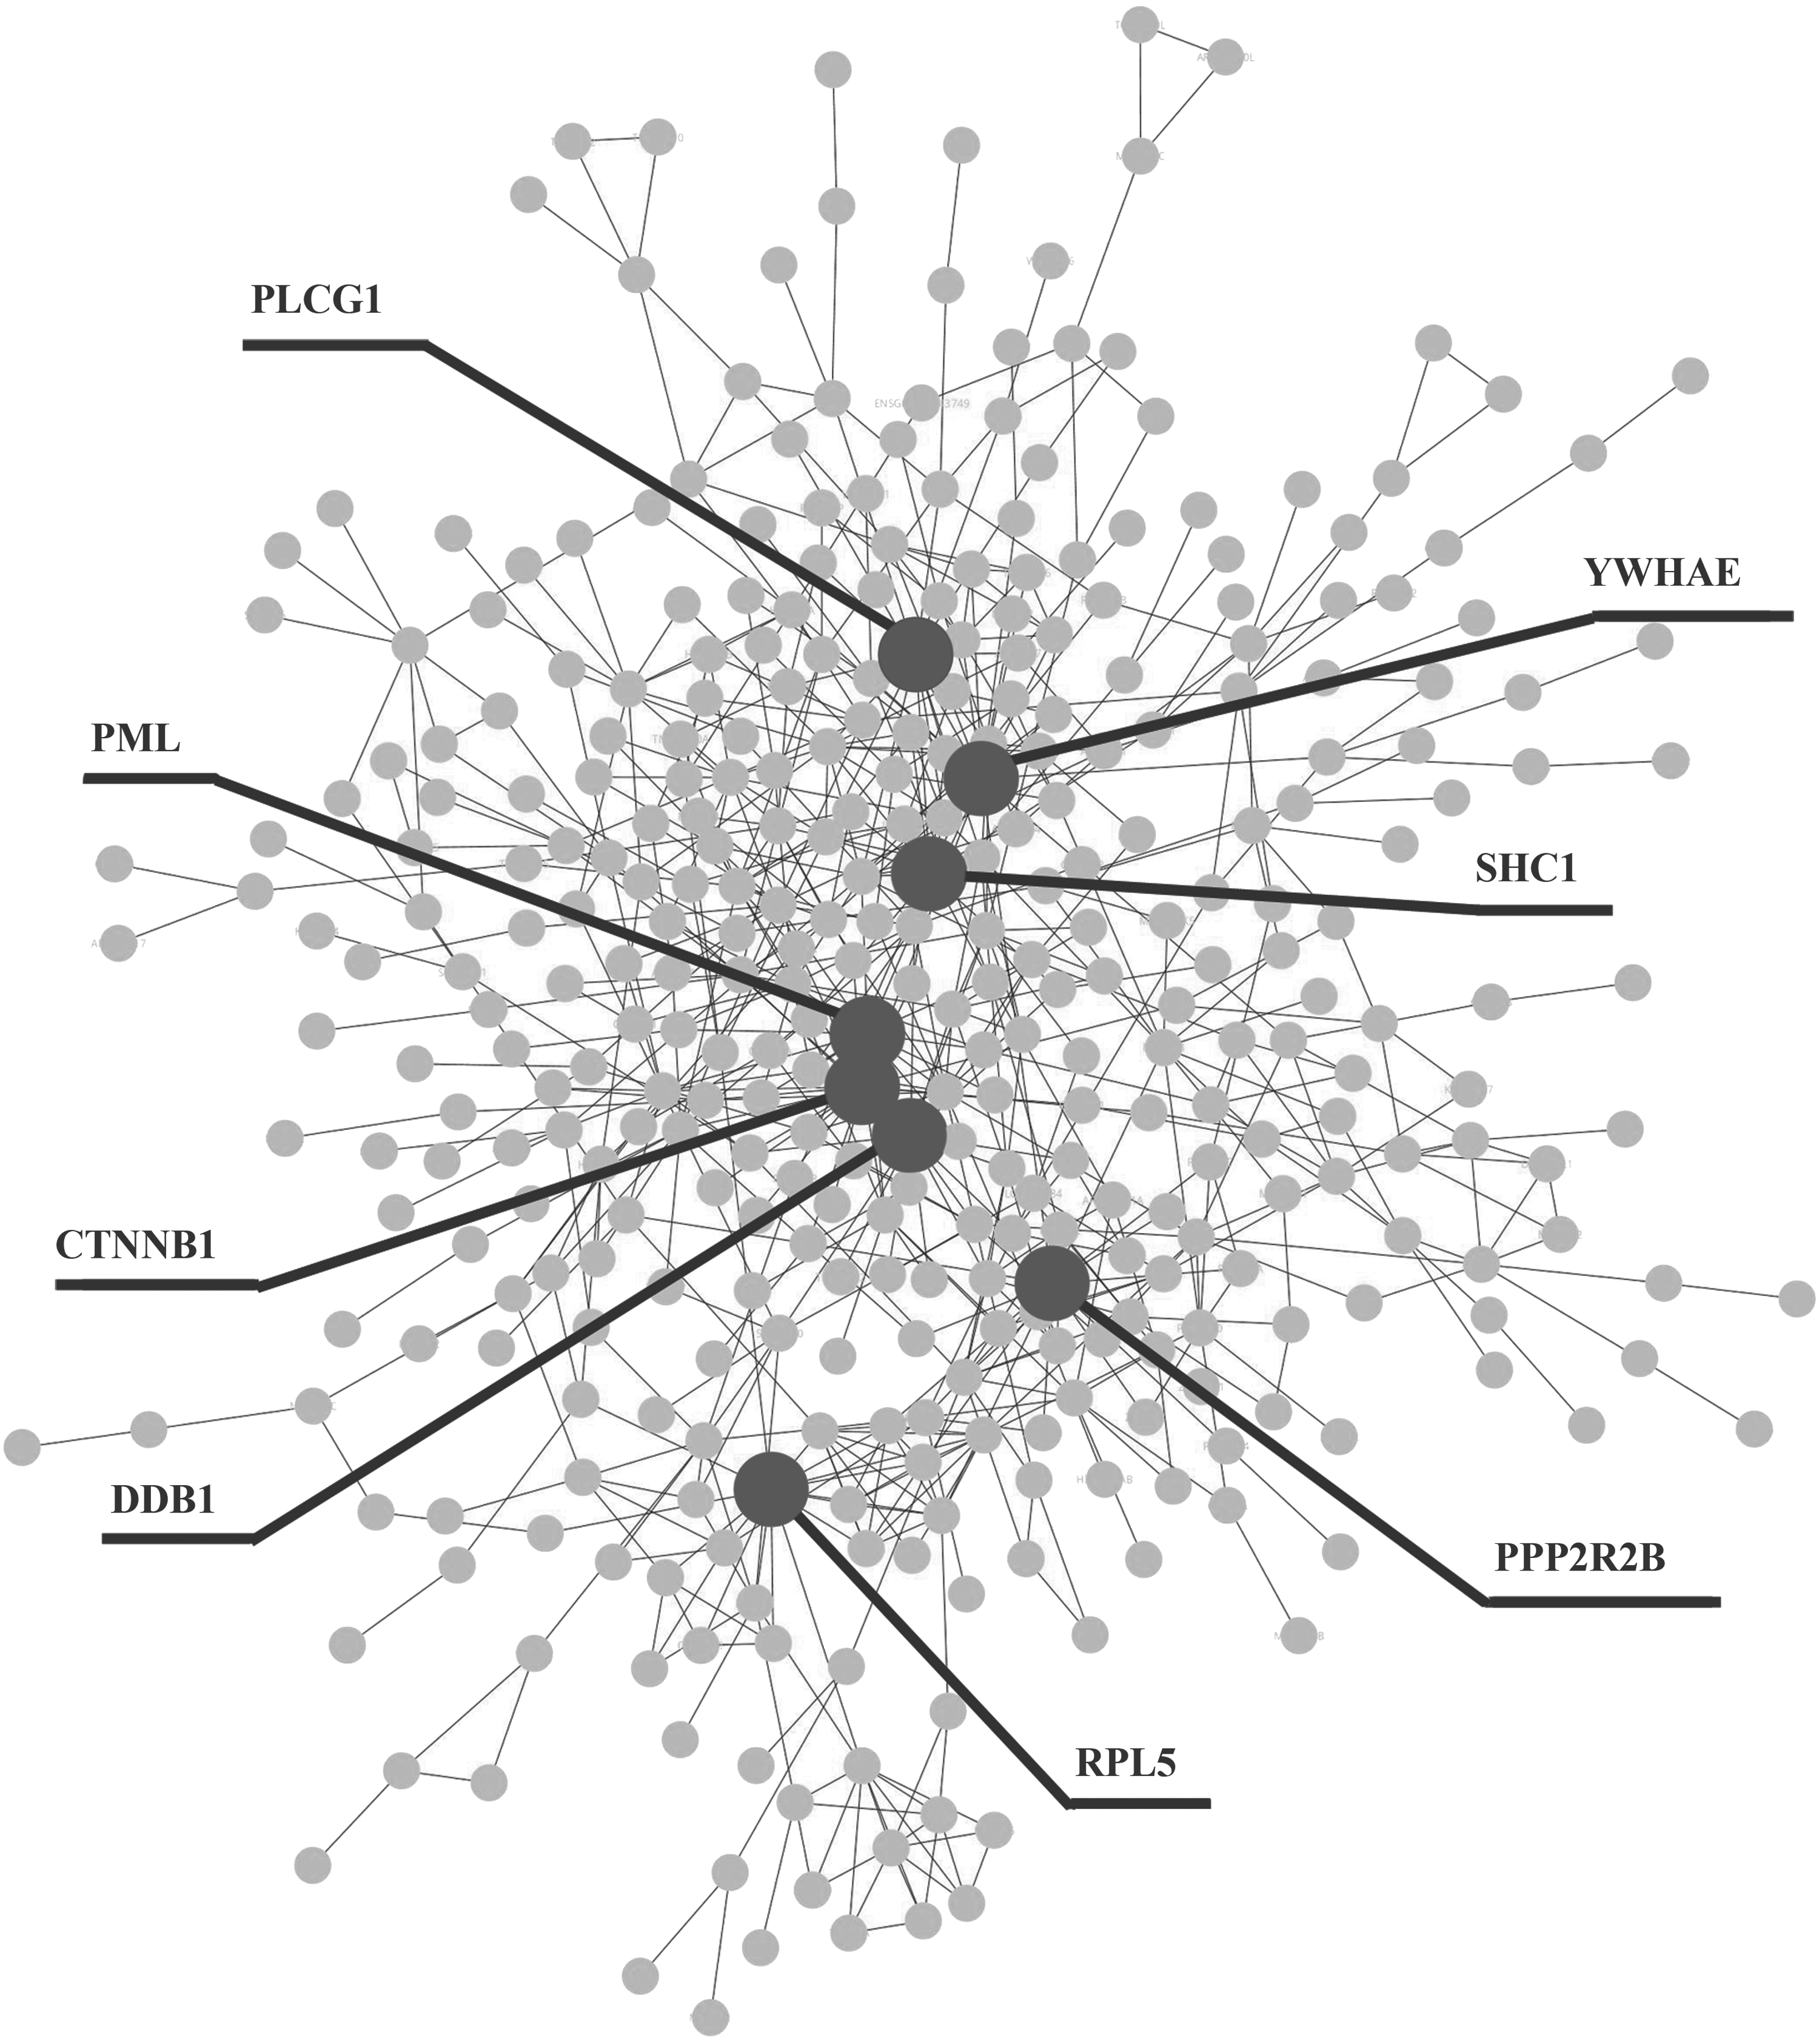
The protein–protein interaction (PPI) network of the common differentially expressed genes (DEGs; main component). The nodes represent the genes, while the edges represent the interactions. Dark gray circles indicate the hub genes.
The molecular complex detection algorithm was used to mine modules that were involved in the PPI network. When the node score cutoff was set to 0.2, the K-core to 3, and the Max.depth to 100, five modules were revealed, which were shown in Figure 2. The hub genes in the PPI network were present in modules 1, 2, and 5. Notably, eight genes related to ribosomal functions—RPL5, RPL13A, RPL14, RPL17, RPL21, RPS18, RPSA, and EEF2—were involved in module 1. A total of 14 genes including YWHAE and DDB1 were included in module 2.
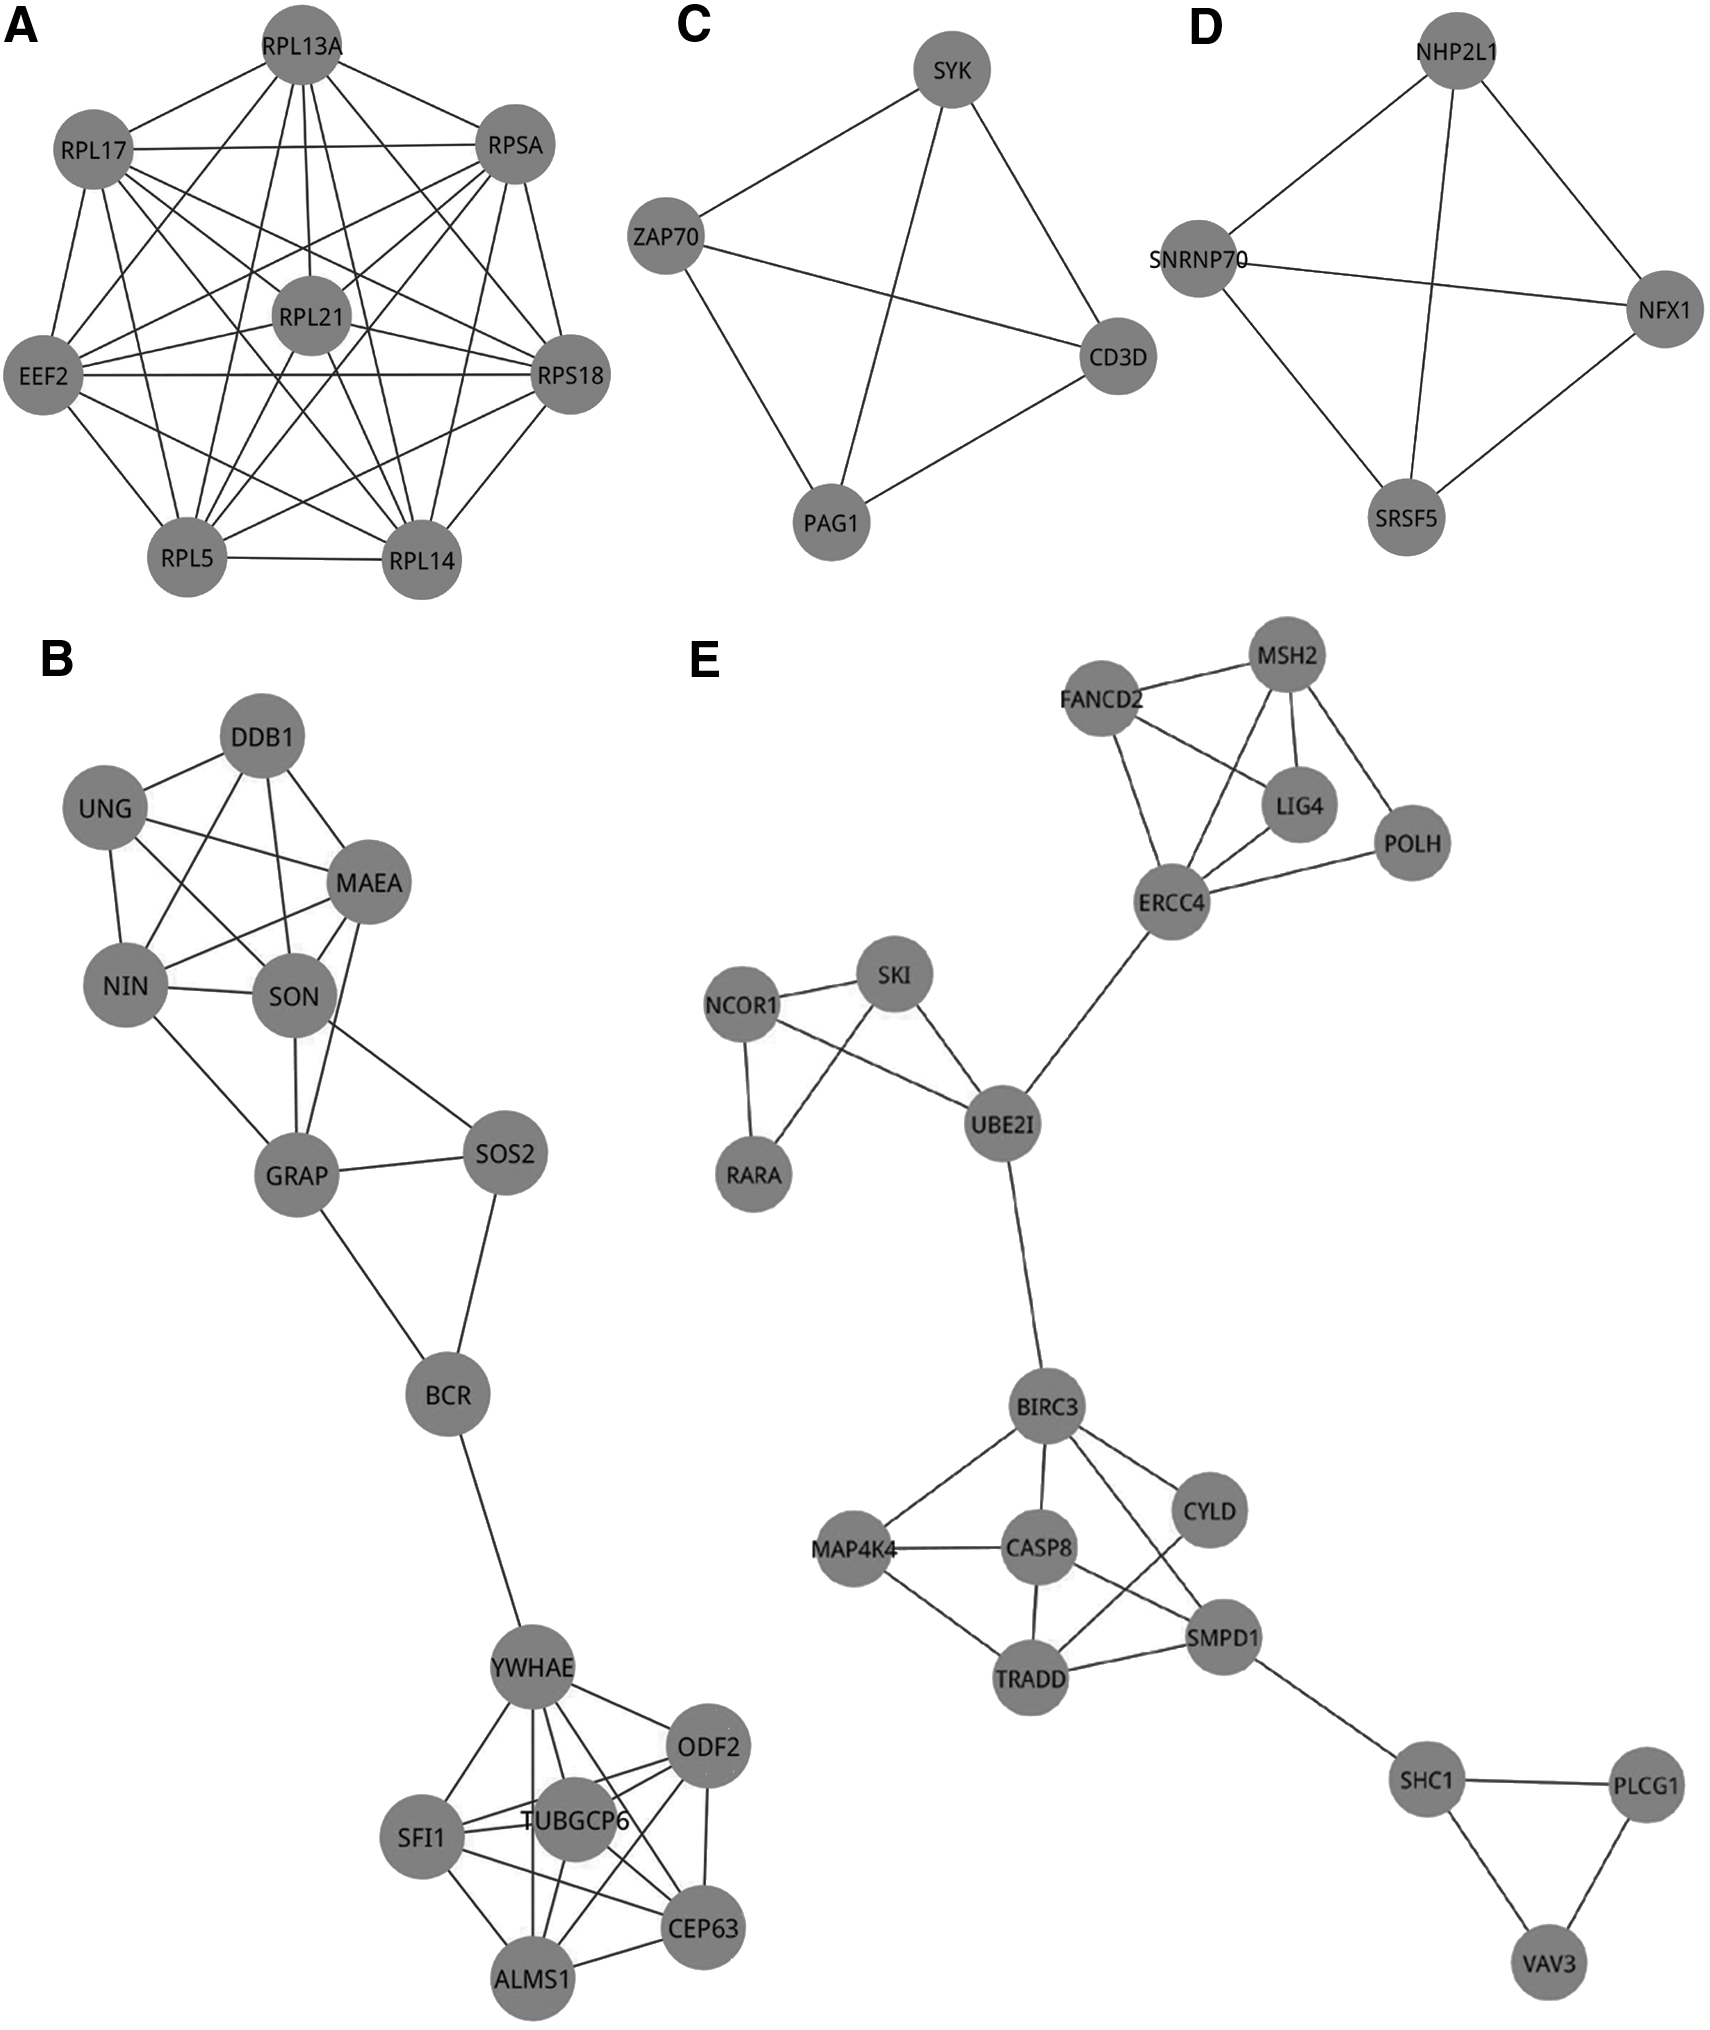
The five modules revealed by the molecular complex detection algorithm. The nodes represent the genes, while the edges represent the interactions.
Functional and pathway enrichment analysis
For GO enrichment analysis, the common DEGs were significantly enriched in 14 molecular functions, 30 biological processes, and seven cellular component terms. The most significant term of molecular functions was guanyl-nucleotide exchange factor activity (p=6.27×10⁻⁹). Among the 14 molecular function terms, 10 were related to biochemical reaction activity. The most significant term of the biological processes was regulation of Rho protein signal transduction, with a p-value of 4.75×10⁻⁶. Among the 30 biological process terms, six were related to signal transduction, while nine were related to cell death. The most significant cellular component term was the centrosome (p=6.10×10⁻⁵). The top-10 terms of functional enrichment were shown in Table 3.
The maximum Expression Analysis Systematic Explore score (p-value) is 0.01; the minimum number of genes for the corresponding GO category (Count) is 2.
DEGs, differentially expressed genes; GO, gene ontology.
Pathway enrichment analysis was carried out for common DEGs. Common DEGs were significantly enriched in four pathways (Table 4; p<0.01). The most significant pathway was the neurotrophin signaling pathway (p=0.00223). All the enriched pathways were signaling pathways.
The maximum Expression Analysis Systematic Explore score (p-value) is 0.01; the minimum number of genes for the corresponding pathway (Count) is 2.
KEGG, Kyoto Encyclopedia of Genes and Genomes.
Discussion
For GSE38900, Asuncion Mejias 27 displayed the gene expression profiles of the whole blood of infants infected with RSV specifically compared with HRV, influenza A, and healthy controls. In the present study, the change of gene expression pattern in infants infected with ARIs-RHI was discovered, including the associated modules and signal pathways. Furthermore, several hub genes were identified and the ARIs-RHI-related dysregulation of ribosomal genes was revealed.
Among the modules in the PPI network, module 1 was a crucial ribosomal-relevant sub-network. All the genes (RPL5, RPL13A, RPL14, RPL17, RPL21, RPS18, RPSA, and EEF2) in module 1 were associated with ribosomal function. The hub gene of RPL5 (ribosomal protein L5) is a typical gene encoding ribosomal proteins in module 1. The RPL5 protein is a component of the 60S subunit of ribosome, which belongs to the L18P family of ribosomal proteins.46,47 Two ribosomal proteins (RPL5 and RPL11) together with 5S rRNA were delivered into nascent ribosomes, recruited by two assembly factors (Rpf2 and Rrs1). 48 In addition, RPL5 participated in ribosome biogenesis, binding the nucleocytoplasmic transport of 5S rRNA in yeast. 49 Mutations in four ribosomal proteins, including RPL5, accounted for a high frequency of around 50% of all cases of the Diamond–Blackfan anemia cohort. 50 Furthermore, eukaryotic translation elongation factor 2 (EEF2) in module 1 encodes a member of the GTP-binding translation elongation factor family. The eukaryotic translocase EEF2 was commonly found to be connected with the ribosome-dependent GTPase interaction.51–54 It promotes the GTP-dependent translocation of the nascent protein chain from the A-site to the P-site of the ribosome. EEF2 was complexed to empty re-associated 80S ribosomes in the presence of an non-hydrolyzable GTP analogue. 55 Investigated by an increase in the accessibility of Glu554 to proteinase Glu-C, the interaction of ribosomal proteins with EEF2 produced opposite conformational transitions in EEF2, in the presence and absence of GTP and GDP. 51 Significantly, EEF2 was differentially expressed in human primary bronchial epithelial samples, infected with Pseudomonas aeruginosa. 56
The effect of ribosomal biological processes on the development of viral etiology respiratory infection has been reported. It is shown that ribosome carries out the function of replication in some specific viral infections. 57 ARIs developed severe clinical manifestations such as cough, dyspnea, or a fever. A ribosomal immunotherapeutic agent is effective in preventing recurrent symptomatic respiratory tract infections in infants. 58 In the coronavirus associated with severe acute respiratory syndromes, the mRNA direct elongating ribosome shifted in reading frame by 1 base in the 5′ direction.59,60 Moreover, ribosomal frameshifting, which was interfered by cell-penetrating peptide-antisense peptide nucleic acids, might lead to inhibition of coronavirus replication of severe acute respiratory syndromes. 61 Gholamreza Ahmadian also indicated the expression of the open reading fracme-2 of the M2 gene, which was initiated by a ribosomal termination-dependent re-initiation mechanism for the human RSV, suggesting ribosomal functions involved in the development of ARIs-RHI. 62
The hub gene of CTNNB1 (catenin beta 1), which encoded the protein of beta-catenin, is also present in ARIs-RHI. This multifunctional protein, which was present in many types of cells and tissues, was part of a complex of proteins that constitute adherens junctions, cell adhesion, and signal transduction. 63 Mutations or otherwise deregulation of CTNNB1 was observed in a variety of cancers, including thyroid carcinoma, prostate carcinoma, and nasopharyngeal carcinoma.63–65 Dysregulation of CTNNB1 as well as its nuclear localization was identified in the progression of aggressive thyroid tumors, was significantly associated with tumor differentiation and poor prognosis. 63 Downregulated CTNNB1 and ZEB2 together with some different mRNAs played distinct roles in supporting the development and progression of nasopharyngeal carcinoma targeted by miR-200a, which inhibited nasopharyngeal carcinoma cell growth, migration, and invasion. 64 Moreover, enhancement of intercellular adhesion molecule-1 expression was observed in epithelial cells infected with RSV, indicating that biological processes such as adherens junctions and cell adhesion may be related to the development of ARIs-RHI. 66
In conclusion, the hub genes and the dysregulation of ribosomal genes were present in ARIs-RHI. Common DEGs of ARIs-RHI were identified in the current study. In addition, potential microRNAs such as miR-15A and transcription factors, including SP1, were predicted. Moreover, the PPI network was constructed and modules involved in the PPI network were mined. Eight hub genes in the PPI network were identified. The most significant module of the PPI network, which was related to ribosomal function, was also discovered. The involved functional and pathway enrichments were introduced as well. Most importantly, the dysregulation of ribosome genes, known as a large and complex molecular machine and biological protein synthesizer in the cell, was present in ARIs-RHI. Therefore, ribosomal genes might be a therapeutic target for ARIs-RHI. However, because of the limit of the original GSE38900 database and the lack of a nonvirus pathogen infection as a control, while it is possible to say that those hub genes are common DEGs among ARIs-RHI, it is not possible to say that they are particular to viral infections. Further validation and in-depth studies are needed to elucidate the interaction among hub genes, ribosomal genes, and ARIs-RHI.
Footnotes
Author Disclosure Statement
No competing financial interests exist.
References
Supplementary Material
Please find the following supplemental material available below.
For Open Access articles published under a Creative Commons License, all supplemental material carries the same license as the article it is associated with.
For non-Open Access articles published, all supplemental material carries a non-exclusive license, and permission requests for re-use of supplemental material or any part of supplemental material shall be sent directly to the copyright owner as specified in the copyright notice associated with the article.