
Abstract
Background:
Vitamin D (VitD) enhances the anti-inflammatory effects of glucocorticoids (GC) in vitro. It was hypothesized that VitD3 (colecalciferol) treatment could have an impact on the expression of glucocorticoid receptors (GRs) in a group of children with low VitD levels, with or without asthma.
Methods:
Asthmatic children and healthy controls, all with low serum VitD levels (25-hydroxyvitamin D [25(OH)D] level <30 ng/mL) were recruited. VitD3 treatment at a dose of 300,000 IU was given orally. Blood samples were obtained at admission and 1 month after the treatment to examine serum 25(OH)D levels and the relative gene expression (RGE) of GR-α and -β in peripheral blood mononuclear cells.
Results:
Twenty-four children with asthma (Mage 11.1 ± 2.1 years) and 14 healthy controls (Mage 11.5 ± 1.7 years) were studied. The expression of GR-β was significantly higher in the control group at baseline compared with those with asthma (p = 0.006). With VitD3 treatment, there was a decrease in GRβ expression at 1 month in the control group (p = 0.05), but not in the asthma group. When analyzing the change in the relative expression of GRβ (change in 1st month to baseline), the decrease in GRβ was significantly higher in the control group compared with the asthma group (p = 0.002). A negative correlation was detected between the change in the asthma control test score (ACT) and the change in 25(OH)D values (r = −0.51, p = 0.01).
Conclusion:
VitD3 supplementation led to a decrease in the expression of GRβ in control subjects with low baseline VitD levels, whereas no such change was observed in asthmatic children. Meanwhile, better asthma control was achieved by VitD3 treatment, possibly through mechanisms not related to GR expression.
Introduction
V
Glucocorticoid (GC) insensitivity is increasingly being recognized in the management of several chronic inflammatory diseases, including asthma, with up to 25% of asthmatic patients being unresponsive to corticosteroids.8,9 Several studies have focused on the role of glucocorticoid receptor (GR)-mediated signaling to understand the mechanisms that modulate steroid sensitivity and resistance. 10 Earlier studies demonstrated that patients with GC-insensitive asthma have alterations in peripheral blood mononuclear cell (PBMC) GR ligand and DNA binding affinity, which was attributed to the increased expression of GR-beta.11,12 Further supporting the role of GR-β in severe asthma, a postmortem tissue study demonstrated increased number of GR-β-positive cells in both the small and large airways. 13 In the meantime, the expression of GR-β was cytokine inducible in PBMCs and reversed to normal levels in GC-insensitive cells incubated in the absence of cytokines. 11
In vitro, VitD demonstrated anti-inflammatory and corticosteroid-enhancing effects in monocytes of patients with steroid resistant, as well as steroid sensitive asthma. 14 VitD pretreatment enhanced dexamethasone-induced GR binding and histone acetylation in monocytes from both patient groups. However, the responses to corticosteroids in patients with steroid resistant asthma remained significantly lower than in those with steroid sensitivity. Zhang et al. reported that VitD enhancement of cellular responses to dexamethasone in human monocytes was mediated by MKP-1, possibly accounting for the steroid-sparing effects of VitD. 15 This study investigated the role of Vit D treatment on the regulation of the expression patterns of GR-α and -β in children with low VitD levels, with or without asthma.
Patients and Methods
The study design and flow of the participants is shown in Figure 1. After a run-in period and randomization process, 24 children with asthma who had low serum 25-hydroxyvitamin D (25[OH]D)levels were enrolled in the study, who were followed in the Pediatric Immunology and Allergy outpatient clinic at Ondokuz Mayıs University, Samsun, Turkey. The control group consisted of 14 age- and sex-matched healthy children who also had insufficient VitD levels (serum 25-hydroxyvitamin D [25(OH)D] level <30 ng/dL), with no systemic disease or allergic manifestation. All subjects were recruited to the study in June 2011. The diagnosis and severity of asthma was based on the Global Initiative for Asthma (GINA) guidelines. 16 Informed consent was obtained from all children and their parents.
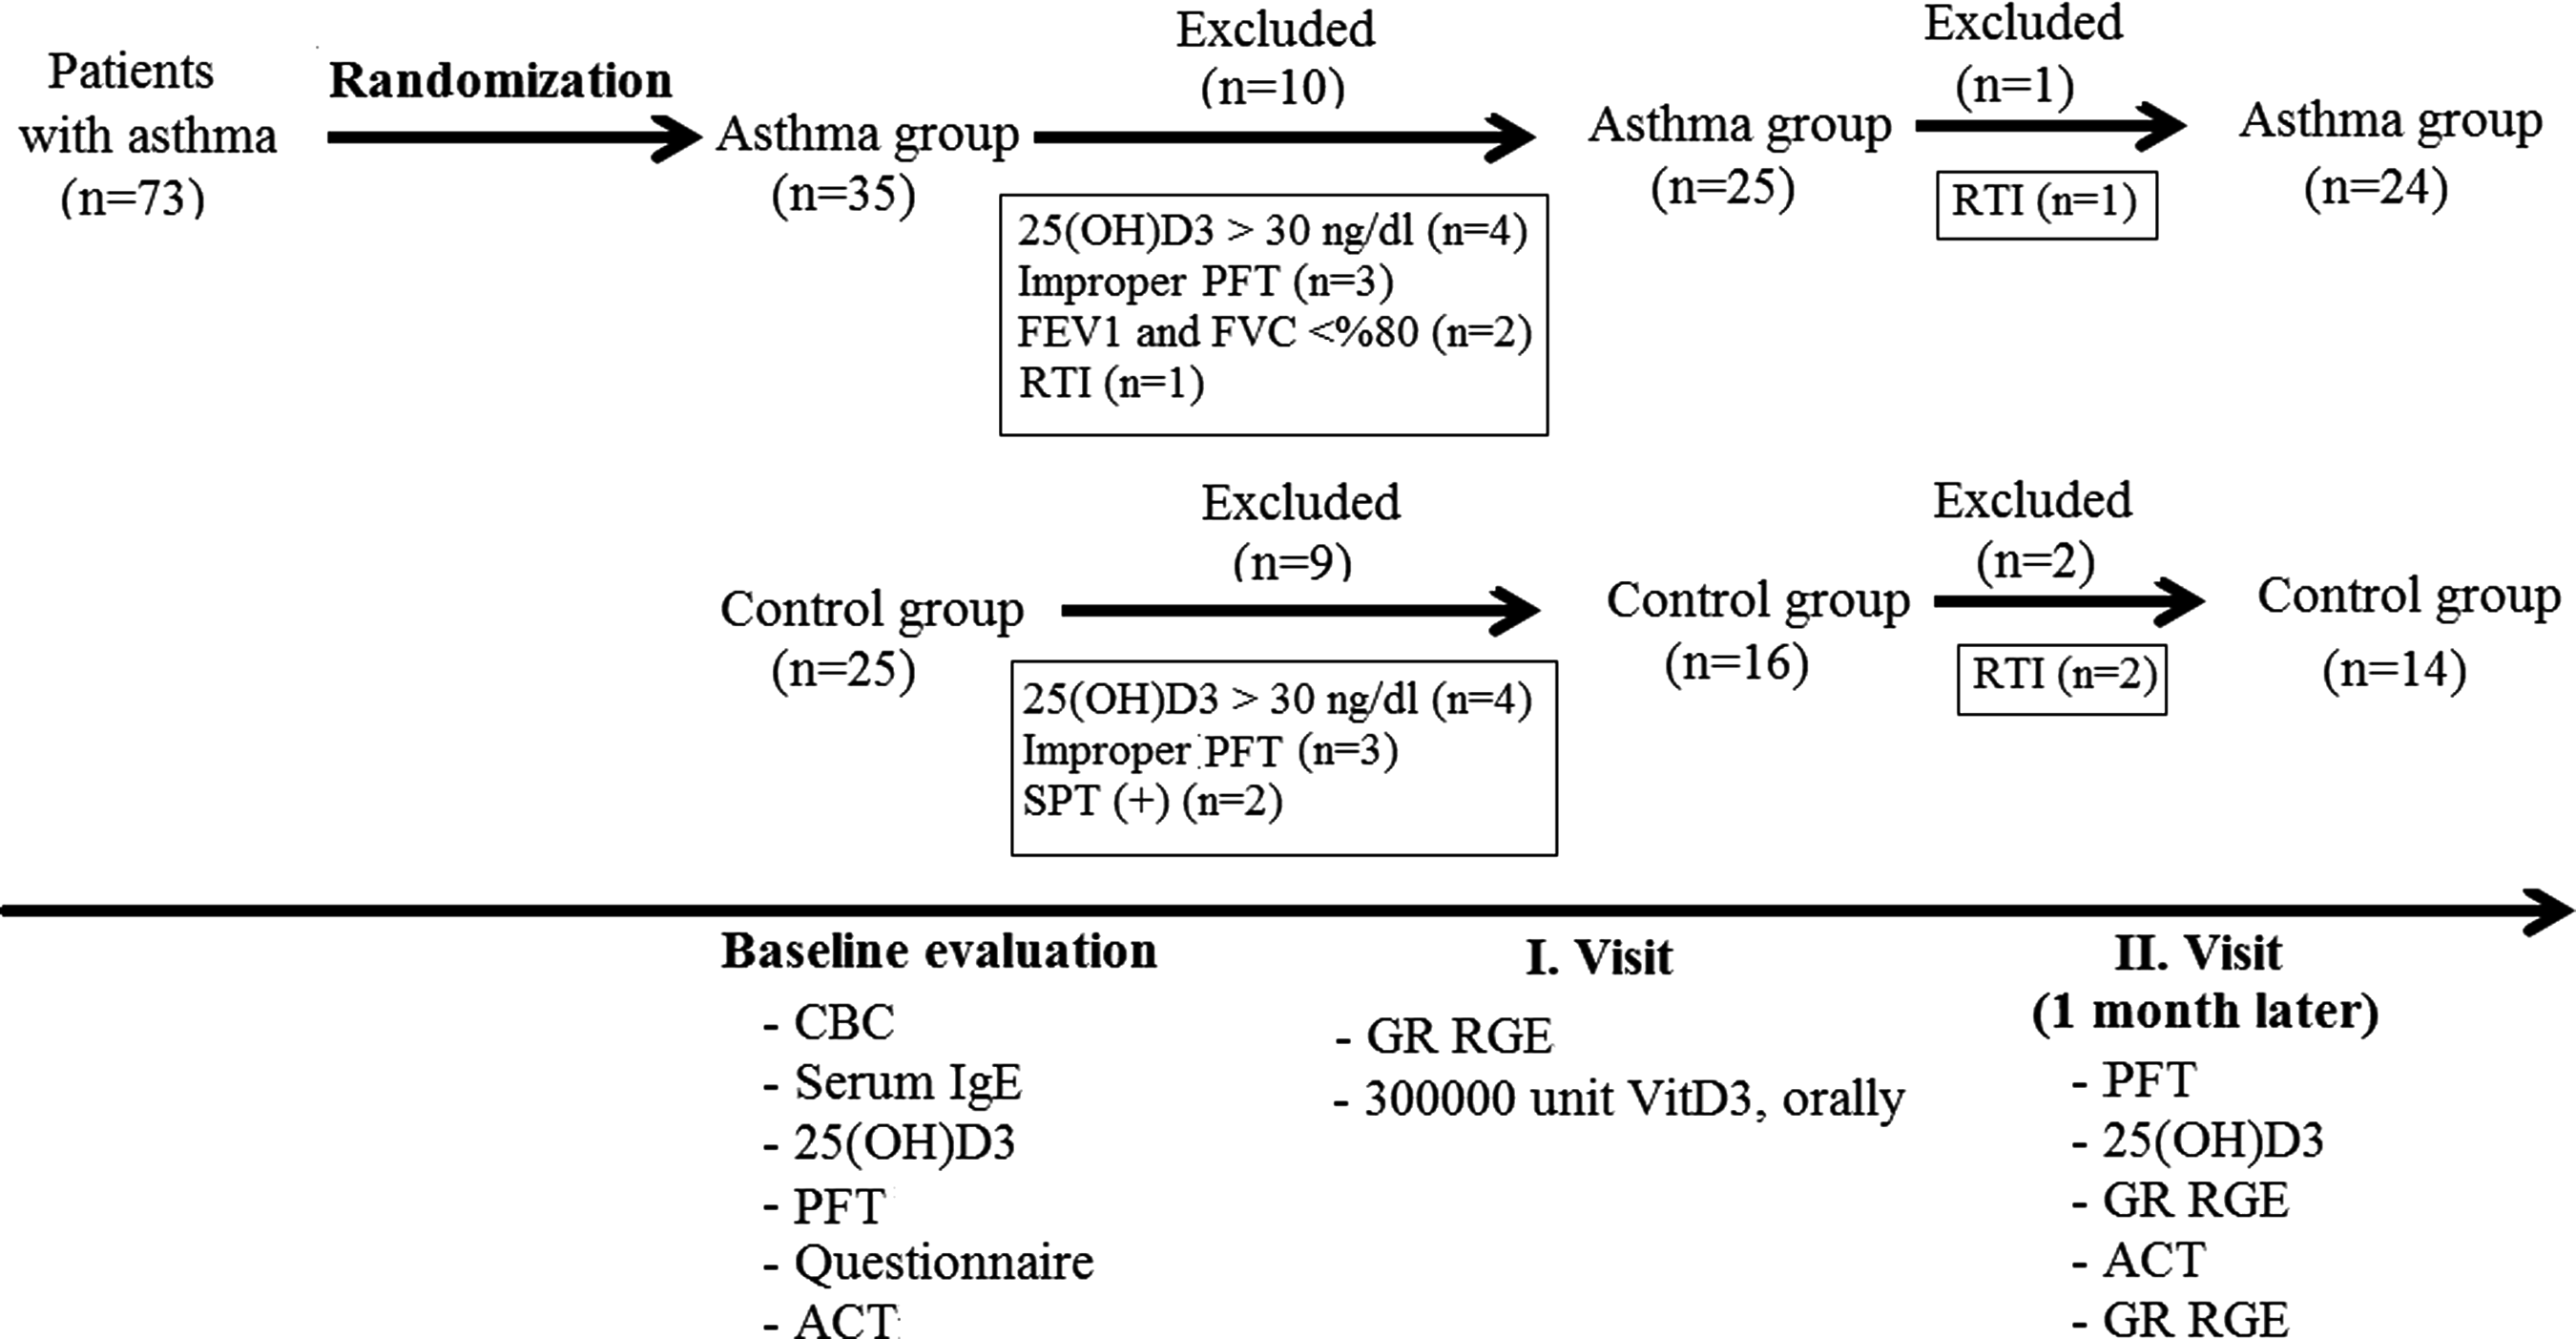
Study design. ACT, asthma control test; CBC, complete blood count; FEV1, forced expiratory volume in 1 sec; FVC, forced vital capacity; GR RGE, glucocorticoid receptors relative gene expressions; PFT, pulmonary functional test; RTI, respiratory tract infection.
The asthma group included children who had been receiving regular ICS treatment (budesonide inhaler 200–400 μg/day or fluticasone propionate 100–250 μg/day) for at least 6 months, with Dermatophagoides pteronyssinus (Der p1) positivity on skin prick testing, forced vital capacity (FVC) on pulmonary function test (PFT), forced expiratory volume in 1 sec (FEV1) values >80%, and a serum 25-hydroxyvitamin D (25[OH]D) level <30 ng/dL prior to the study and >30 ng/dL following treatment. Exclusion criteria included asthma attacks during the previous month, any hospital admissions due to a severe asthma attack during the previous year, history of infections during the last 15 days, personal tobacco smoking, and abnormal growth pattern (<10th or >90th percentiles for the weight-for-height and height-for-age indexes). A 49-item questionnaire was completed by the same investigator (S.N.G.) through face-to-face interviews with the study subjects and their parents. The questionnaire included demographic and clinical features such as sex, age, body mass index, birth weight, delivery mode, smoking habits, family educational level, family income; asthma diagnosing time, comorbid disorders such as allergic rhinitis, urticaria, food allergy, last asthma attack time, attack with exercises, hospitalization, treatment planning, and asthma control test scoring chart.
Data collection
Blood samples were obtained from all participants to determine the baseline serum 25(OH)D levels, blood eosinophil counts, and serum immunoglobulin (Ig)E levels. Those children with VitD levels <30 ng/dL were recruited to study blood GR-α and -β relative gene expressions (RGE) in early morning blood samples (08:00–08:30 am). Oral VitD3 treatment at a dose of 300,000 IU was given at enrollment. Repeat examination was performed at 1 month of the study to obtain blood samples for the determination of 25(OH)D and GRs. Skin prick testing was performed for common aeroallergens (Dermatophagoides farinae, Dermatophagoides pteronyssinus, Aspergillus fumigatus, Alternaria alternata, cat and dog dander, ragweed, trees [Ulmus, Quercus, Populus, Platanus, Salix], and certain grasses [Poa mix, Cynodon dactylon, Poa pratensis, Dactylis glomerata, Avena sativa, Festuca; Laboratorie des Stallergenes). The test was considered positive if the wheal diameter was at least 3 mm greater than the negative control. Pulmonary function testing (PFT) was performed at baseline and at 1 month of the study using a flow-sensing spirometer (ZAN 100, Handy™) by the same technician. At the end of the measurements, FVC, FEV1, peak expiratory flow (PEF), and mid-expiratory flow (MEF) values were recorded.
The Asthma Control Test (ACT), adapted into Turkish and consisting of seven standardized questions, was performed for the asthmatic children at baseline and at 1 month. The total score ranges from 0 to 27, with higher scores indicating better asthma control. The questionnaire uses a single cut point of a score of 19 to identify children whose asthma is not well controlled. The totals of their scores were determined and recorded separately as described previously. 17
Examination of samples
Serum IgE levels were measured in IU/mL with a Siemens BN II nephelometer™ and N Latex IgE Mono kit. The determination of VitD serum level was set by Agilent 1100 series UV detector 265 nm, high-performance liquid chromatography (HPLC).
Peripheral venous blood samples were drawn into BD Vacutainer CPT tubes (ref. 362753; Becton Dickinson). Monocytes were isolated by positive selection from the PBMCs using CD14 MicroBeads kit (order no. 130-050-201), MACS columns, and MACS separators (Miltenyi Biotec), according to the manufacturer's protocol. The purity of the separated CD14+ cells was determined by flow cytometry–based analysis on complete blood count (CBC) autoanalyzer on Advia 2012i (Siemens AG), and was found to be >98%.
RNA isolation and cDNA synthesis
Total RNA was isolated from cells using High Pure RNA Isolation (Roche Diagnostics), according to the manufacturer's recommendations. cDNA was synthesized from RNA with anchored-oligo(dT)18 primer according to the manufacturer's instructions using Transcriptor First Strand cDNA Synthesis Kit (Roche Diagnostics GmbH).
Real-time polymerase chain reaction quantitation
Real-time polymerase chain reaction (RT-PCR) using the Roche Lightcycler 480 (Roche) was performed for each of the samples using the Roche RT-PCR master mix (Lightcycler 480 Probes Master) in combination with Roche Universal Probe Library (UPL) assays. Assays were designed to publicly available human gene sequences (NCBI) using Roche UPL design software (ProbeFinder v2.45). All assays were designed to span an intron–exon boundary to prevent amplification of DNA.
Glyceraldehyde-3-phosphate dehydrogenase (GAPDH) was used as a housekeeping gene in order to normalize GR-α and GR-β expression levels. Probes and intron spanning primers for each gene assay were designed using the UPL Assay Design Center (www.roche-applied-science.com/sis/rtpcr/upl/adc.jsp; Roche Applied Science). In the patients and controls, gene expression analysis of GR-α and GR-β was performed using the Relative Expression Software Tool 2005 (REST©).
Statistical analysis
SPSS Statistics for Windows v15.0 (SPSS, Inc.) was used as the statistical analysis program to assess the data. Tests of normality were conducted to compare the general properties of the patient and control groups. Chi-square and Fisher's exact tests were used to compare the differences between the frequency rates of the categorical data. Numeric data that complied with normal distribution were given as mean ± standard deviation, whereas those that did not comply with normal distribution were given as median (minimum–maximum). Student's t-test and Mann–Whitney U-test were used to compare the difference between the averages of the data that did and did not comply with normal distribution, respectively. The sample related to the repetitive measurements was evaluated by one-way analysis of variance. For all the results, a significance level was specified a p < 0.05, and the confidence interval (CI) was determined as 95%.
Results
The study group consisted of 24 asthmatics (9 girls), and the control group 14 healthy children (6 girls; Fig. 1). The characteristics of the study subjects are presented in Tables 1 and 2. The study and control groups were similar in terms of socioeconomic variables and environmental characteristics. A family history of allergy was more common in patients with asthma compared with healthy controls (54.2% vs. 14.3%; p = 0.04).
Statistically significant values are shown in bold.
Values shown are M ± SD, unless otherwise indicated. Statistically significant values are shown in bold.
Values shown are median (min–max).
BMI, body mass index (weight in kg/height in m2).
There was a significant and positive correlation between baseline 25(OH)D level and IgE(log10) in the asthma group (r = 0.44; p = 0.03), but not in the controls (r = −0.42; p = 0.13; Fig. 2).
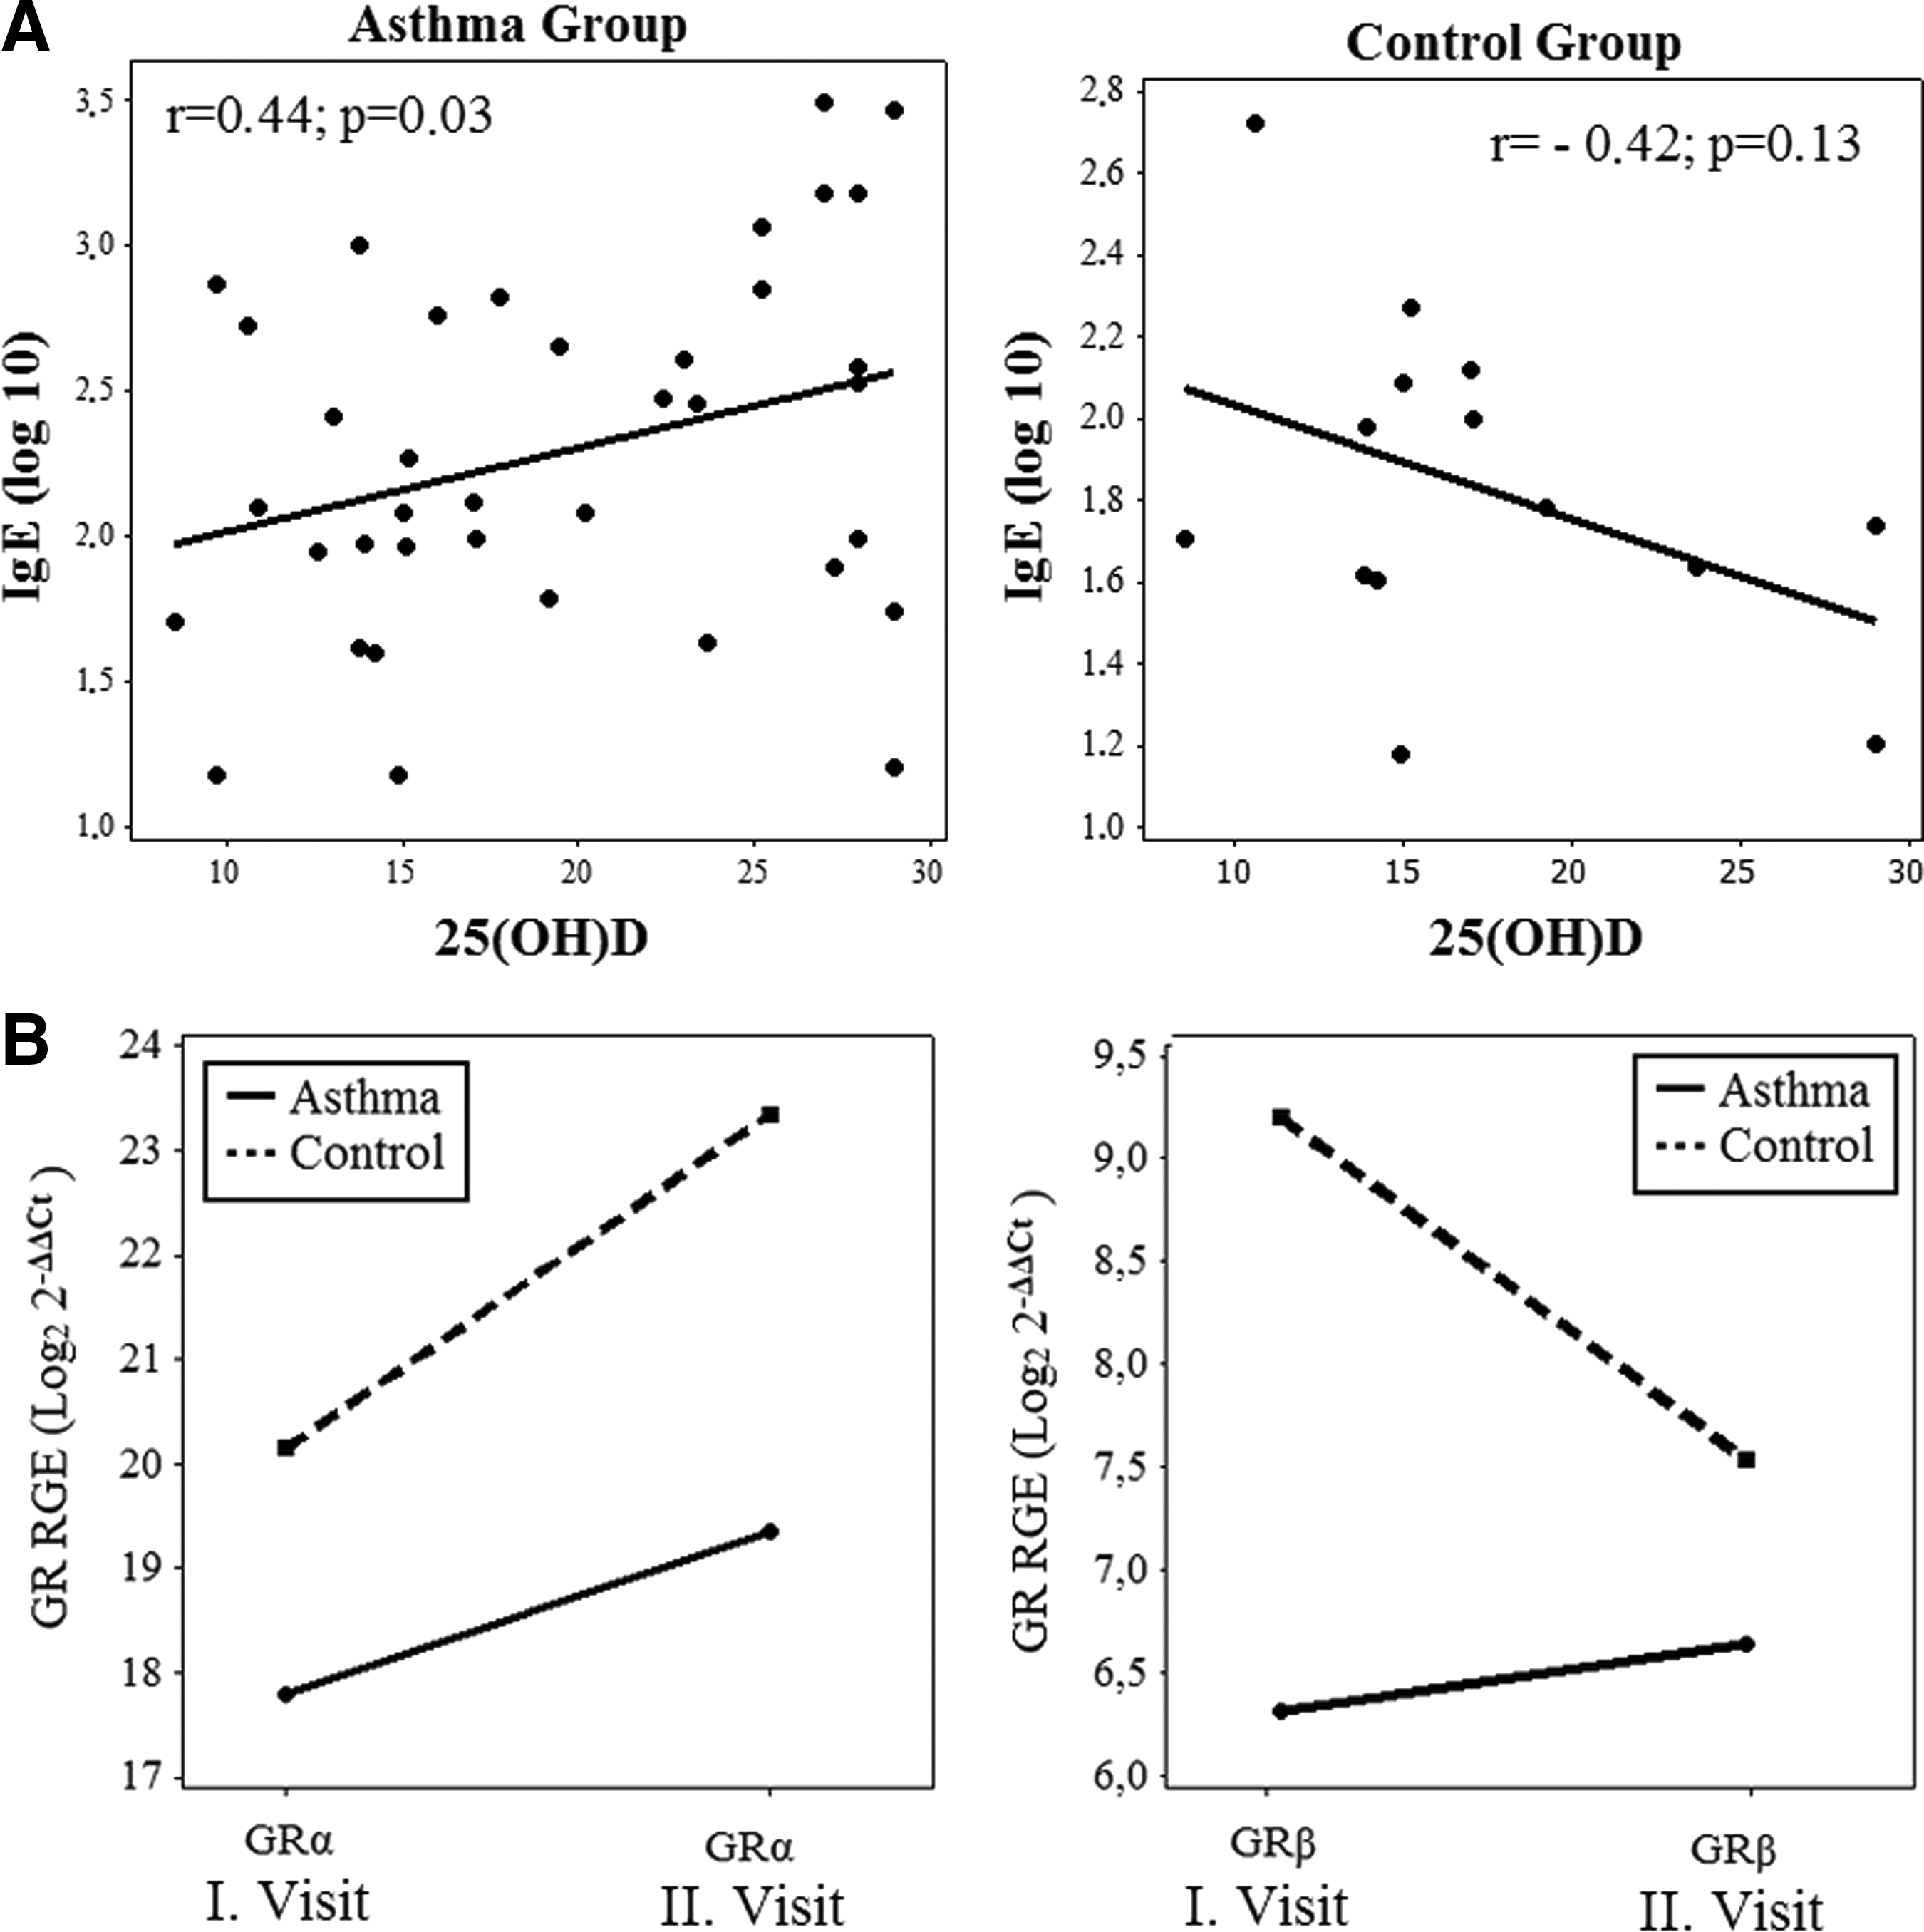
Baseline correlations and relationships between 25(OH)D and IgE(log10) for asthma and control groups. (
In the asthma group, the FEV1 and MEF25–75 values and FEV1/FVC ratio increased significantly at 1 month compared with baseline, despite no change in the ICS dosage (Table 3). The ACT total scores were 20.9 ± 4.1 for the first visit and 23.5 ± 3.4 for the second visit. When evaluating the differences in ACT total scores, 25(OH)D levels, and PFT measurements between the 1st month and baseline assessments, there was a negative correlation between ΔACT score and Δ25(OH)D value and positive correlations between the ΔFEV1, ΔFEV1/FVC, and ΔMEF25–75 values (Fig. 3).
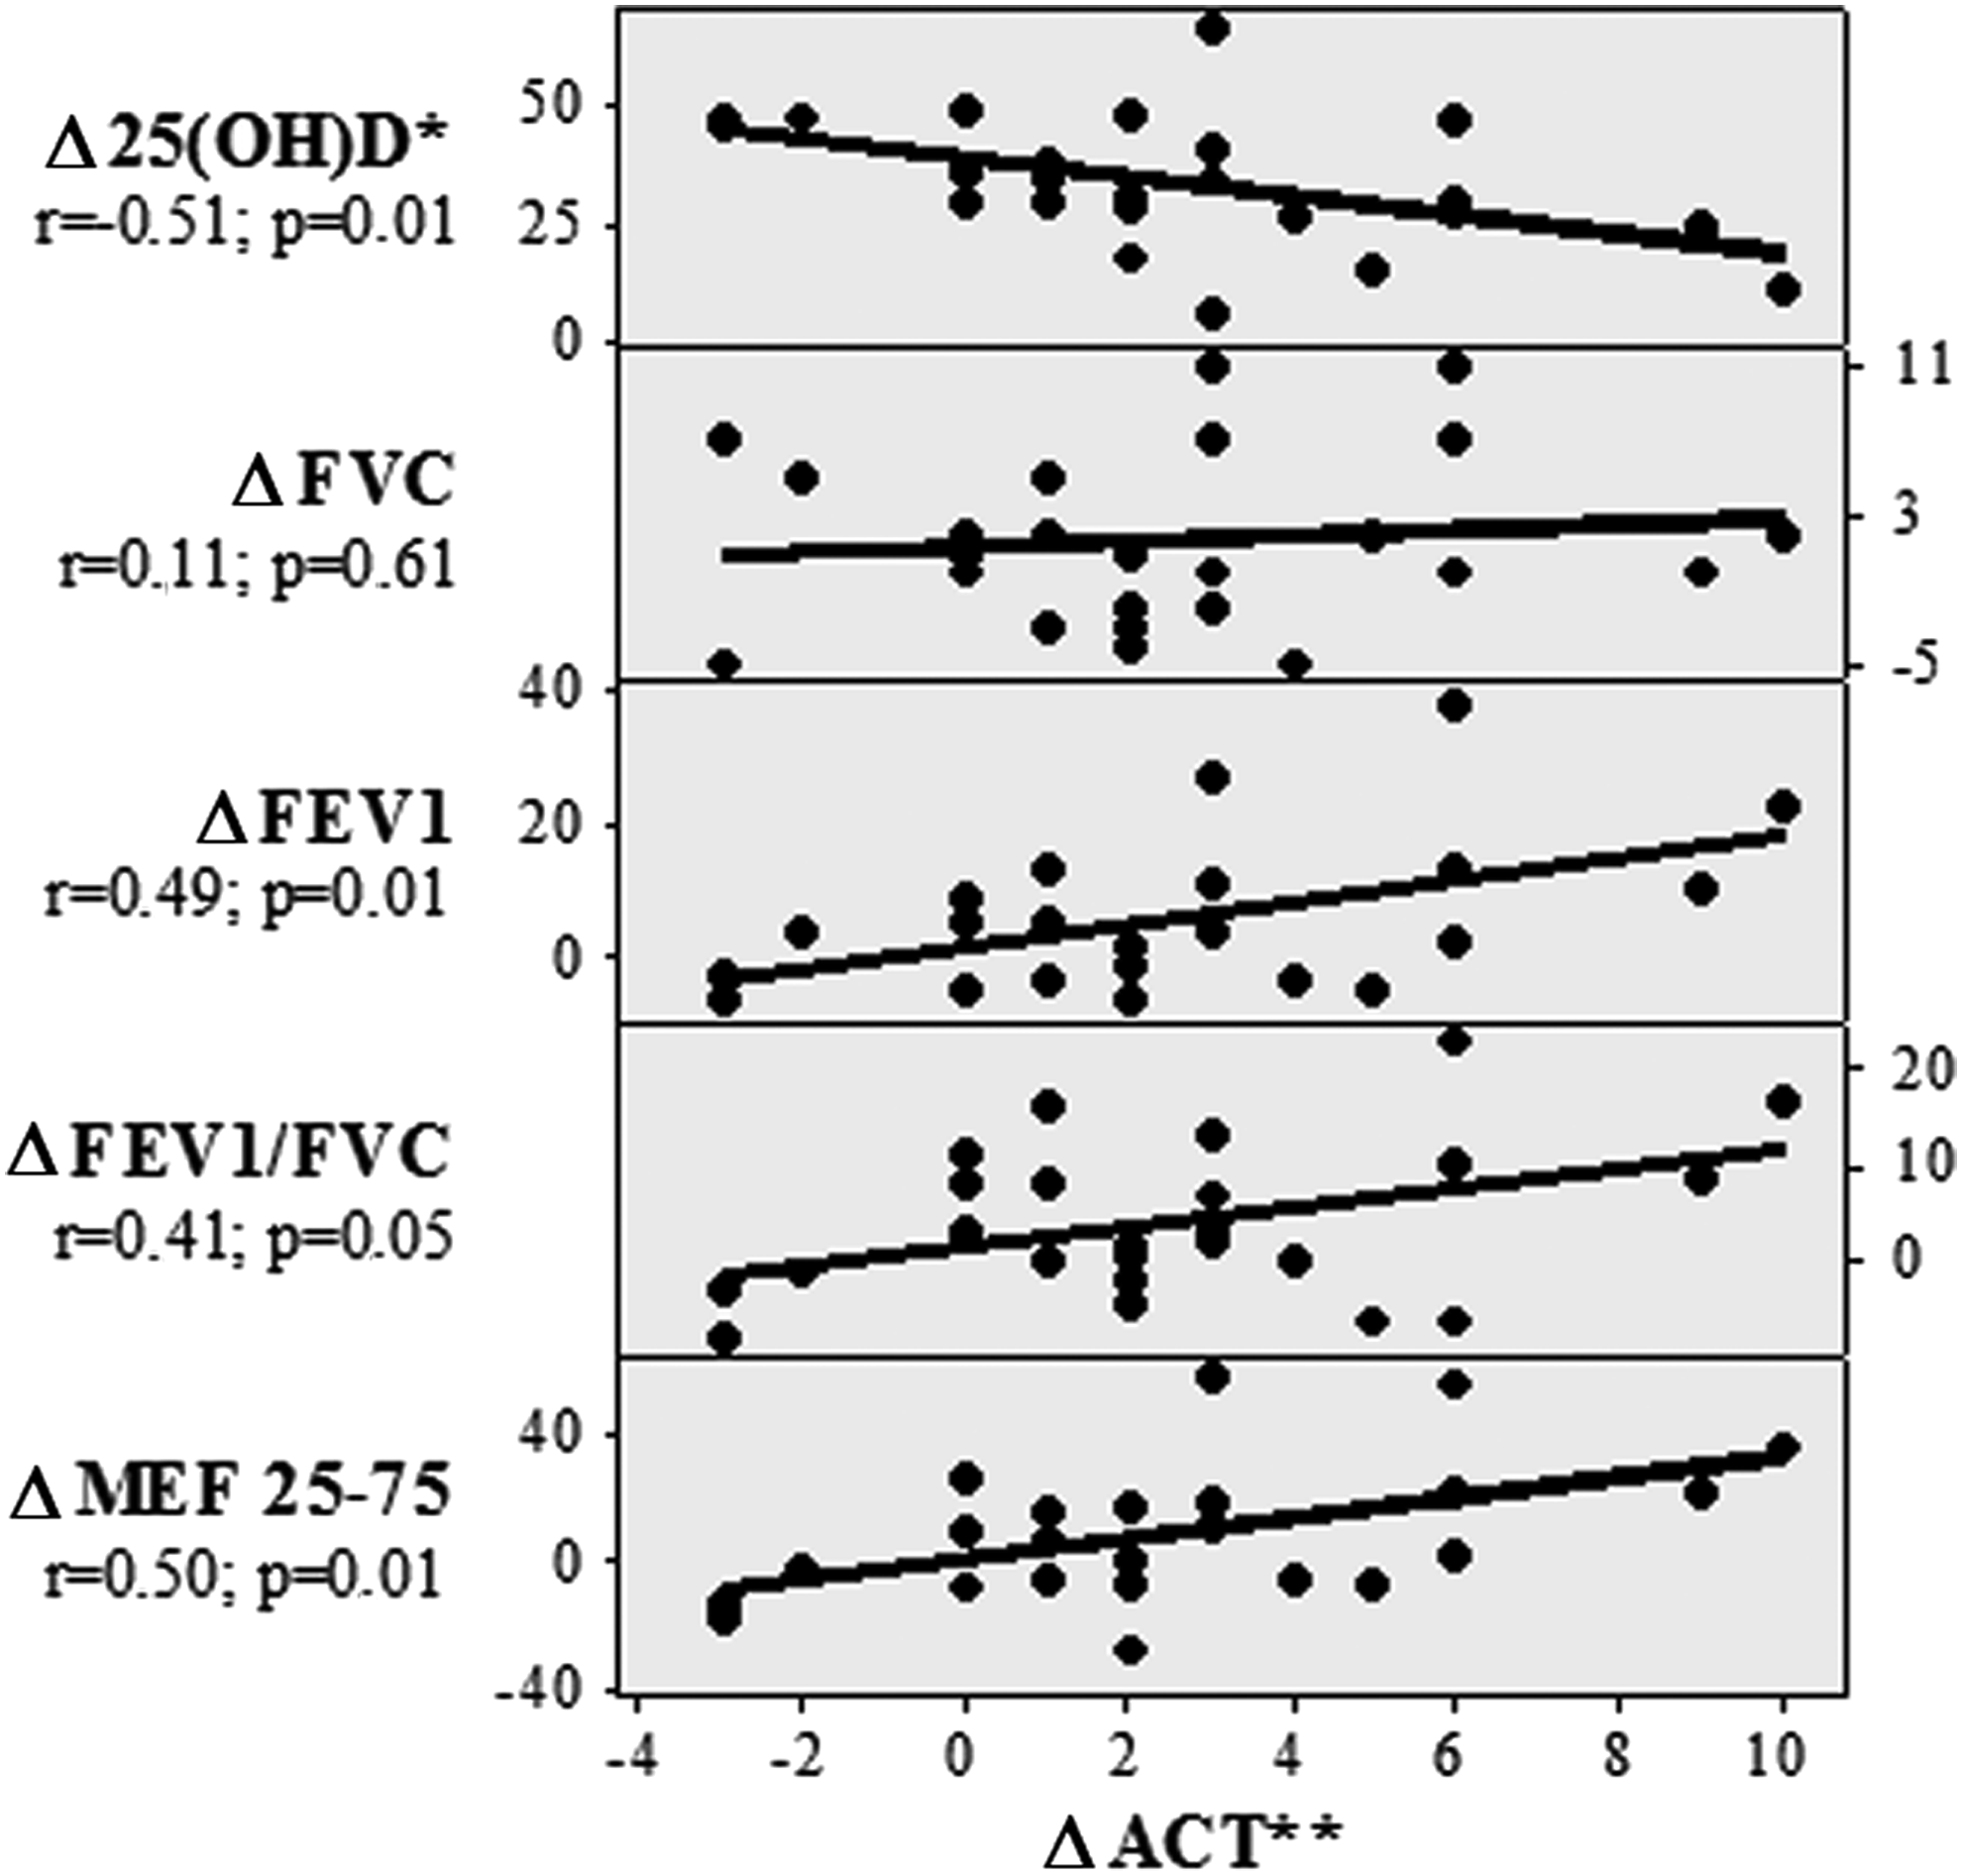
Correlations between asthma control test score and delta values for PFT and serum 25(OH)D levels (between the 1st month and baseline) in the asthma group. *Delta values for the differences between the 1st month and baseline; PEF, peak expiratory flow; MEF25–75, maximum expiratory flow (25–75).
Statistically significant values are shown in bold.
Comparing the group differences between the delta changes of the baseline and the first month.
FVC, forced vital capacity; FEV1, forced expiratory volume in 1 sec; PEF, peak expiratory flow; MEF25–75, maximum expiratory flow (25–75).
As expected, serum 25(OH)D levels increased significantly in both groups at the 1st month compared with the baseline, while no significant differences were detected in between-group analyses (Table 4). When the GR RGEs were analyzed, no significant differences were detected between the baseline and the 1st month values in within-group comparisons for GR-α (Fig. 4). On the other hand, there was a decrease in the GR RGE values for GR-β in the control group, which was close to statistical significance (p = 0.05), but not in the asthma group (Fig. 4). The relative change in the GR RGE value for GR-β (change in 1st month to baseline) was significantly different between the two groups (p = 0.002); a negative trend was observed in the controls, whereas there was a slight increase in the asthma group (Fig. 4). Of note, no such differences were observed for the GR-α RGE values. Comparison of the relative changes in the ratios of GR RGEs over 1 month (change in 1st month to baseline GR-β/GR-α ratio) revealed no significant differences between the two groups.
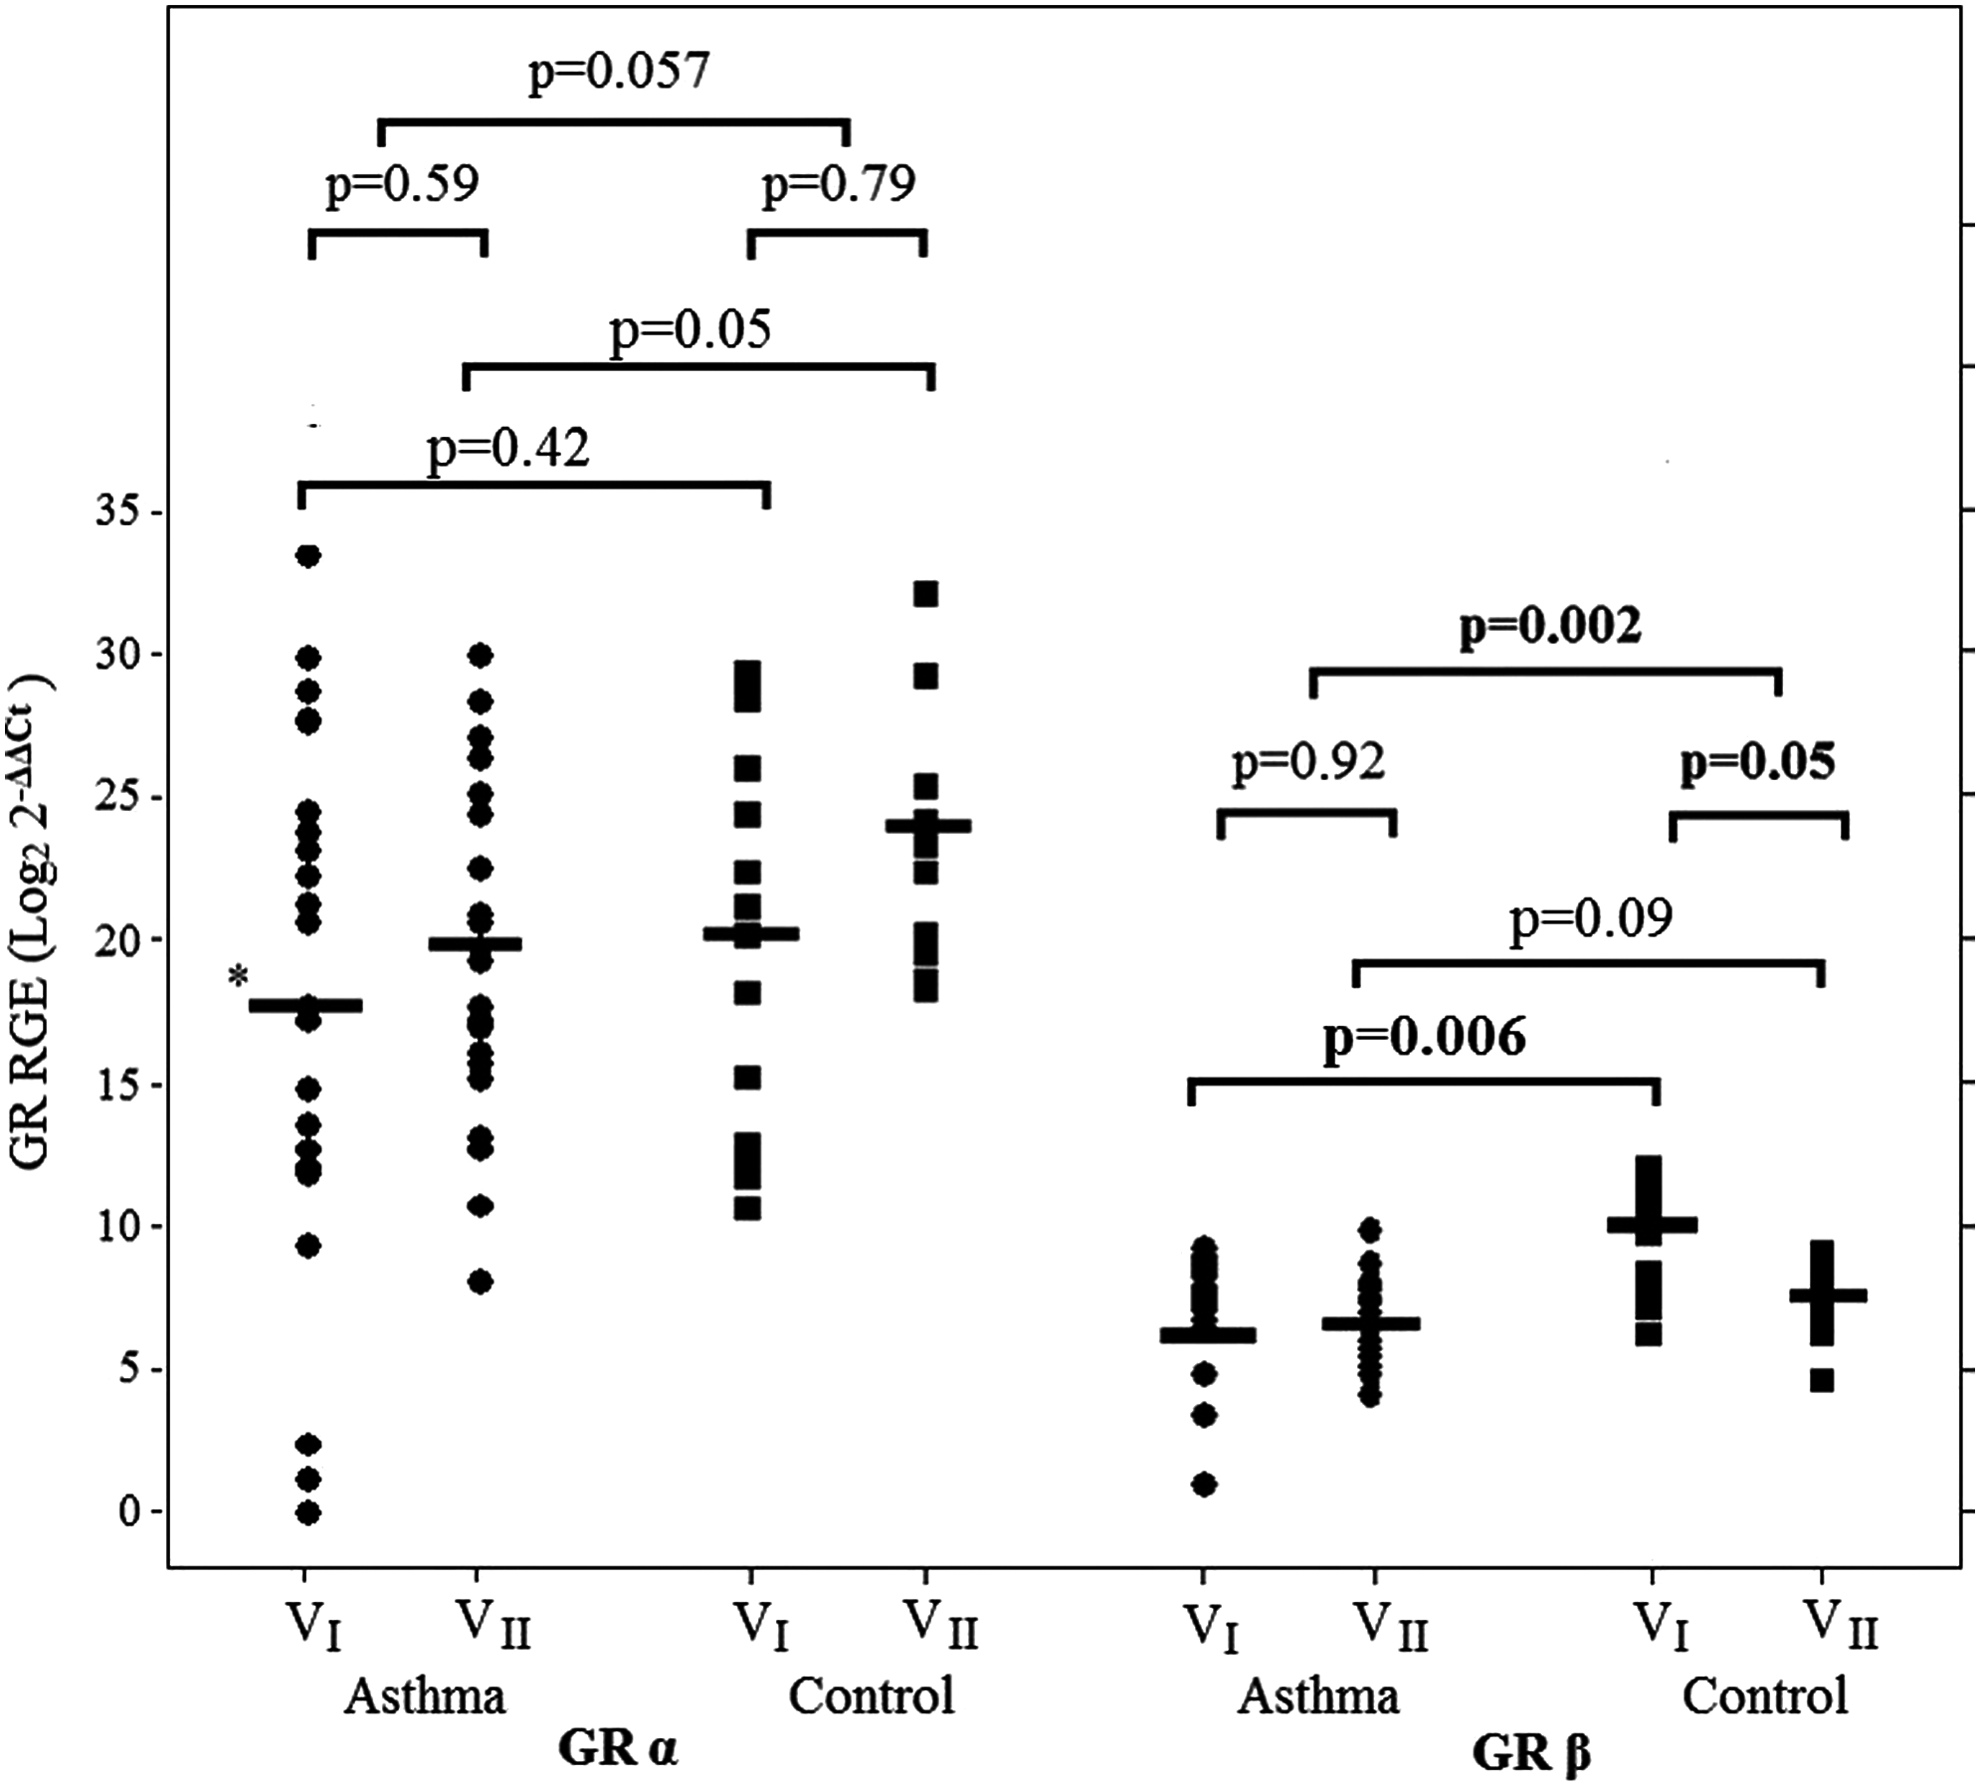
Comparison of GR-α and GR-β RGEs of the study groups.
Statistically significant values are shown in bold.
Serum 25(OH) vitamin D level (ng/dL).
Log 2
Comparing the group differences between the delta changes of the baseline and the first month.
GR, glucorticoid receptor; RGE, relative gene expression.
There was no significant difference in the expression of GR-α between the asthma and control groups at baseline (p = 0.42), whereas GR-α RGE was higher in the control group at 1 month (p = 0.05). However, while GR-β was significantly higher in the control group at baseline (p = 0.006), there was no significant difference at the 1st month examination (p = 0.09).
Discussion
In a group of children with VitD insufficiency, the expression of GR-β at baseline was significantly higher in the control group compared with those with asthma. With VitD3 supplementation, there was a reduction in the expression of GR-β in the control subjects, but not in the asthma subjects. When comparing the two groups, the decrease in the expression of GR-β (change in 1st month to baseline) was significantly higher in the control group compared with those with asthma. Interestingly, the increase in VitD level with treatment was accompanied by a clinical improvement in asthmatic children, despite the use of the same anti-asthma medications throughout the follow-up period.
The human GR gene is encoded on chromosome 5q31.3 and consists of nine exons. 18 Alternative splicing of the exon nine of the GR gene generates two receptor isoforms: GR-α and GR-β. 19 Whereas anti-inflammatory effects of glucocorticoids are mediated by the GR-α,20–23 GR-β is not able to bind GCs, resides constitutively in the nucleus of cells, and does not transactivate GC-inducible reporter genes. 24 Steroid resistance observed in some inflammatory disorders has been attributed to the elevated levels of GR-β and, more specifically, to an increase in the ratio of GR-β/GR-α. It was demonstrated that proinflammatory cytokines and other immune modulators can selectively increase the expression of GR-β, resulting in glucocorticoid resistance.25,26 GR-β is associated with glucocorticoid resistance and has negative effects on the mechanisms of transactivation and transrepression through GR-α receptors. 27 In addition to its role in competing with GR-α, GR-β also exerts intrinsic transcriptional properties, such as the inhibition of histone deacetylase 2, as found in allergic asthma.28,29 An increase in levels of GR-β RGE were found in the asthma group, whereas a decrease was found in controls. In in vitro cell cultures of steroid resistance, VitD augmented the activity and immunosuppressive effect of dexamethasone in a dose-dependent manner. 30 In the present study, GR-β RGE was suppressed by VitD3 treatment in the control group but not in the asthma group. It could be speculated that ineffective suppression of the negative feedback mechanism would cause insufficient activity of glucocorticoids (secretion of proinflammatory cytokines and defective regulatory cell functions) and result in lung tissue damage, bronchial hyperactivity, and finally asthma. Thus, modification of the expression patterns of GRs might be an appealing strategy for the management of glucocorticoid-resistant asthma
In the current study, the difference in the lowest and highest measured GR-α RGE values was 223 times, whereas it was 212 for GR-β RGE values. GR-α RGE was approximately 1,000 (210) times more than GR-β RGE in both the asthma and control groups. This figure has been reported to vary from 600 to 1,000 times in the literature.31,32 Following VitD3 treatment, GR-α RGE levels increased roughly 12 (23.6) times in the asthma group and 8 (23) times in the control group (p = 0.95). It was recently demonstrated that glucocorticoid treatment downregulates GR-α by inducing expression of miR-124, thereby limiting the anti-inflammatory effects of glucocorticoids. 33 Likewise, steroid treatment has been suggested to aggravate glucocorticoid resistance in patients with high GR-β levels. 34 In the current study, the variable response to VitD3 treatment in terms of the expression of GR- β in patients with asthma versus controls might be related to the ongoing use of inhaled corticosteroids in the former group.
Several lines of evidence suggested a relationship between VitD status and asthma. Analysis of data on adults demonstrated that higher VitD levels were associated with better lung function measures. 34 A study on children with asthma demonstrated a significant association between rising VitD levels and reduced use of anti-inflammatory medication in the previous year. 35 It was shown that VitD plays a key role in the immune responses generated by lymphocytes and antigen-presenting cells. VitD receptors (VDRs) have been identified essentially on every cell of the immune system, including T cells, B cells, neutrophils, macrophages, and dendritic cells (DCs). 36 Picomolar concentrations of 1,25-dihydroxyvitamin D decreased IL-2 activity and inhibited the proliferation of mitogen-activated lymphocytes. 37 Moreover, 1,25-dihydroxyvitamin D decreased proliferation of both Th1 and Th2 cells, and lowered the production of IFN-γ, IL-2, and IL-5. However, studies produced conflicting results with respect to whether VitD favors a shift in the helper T cell balance toward Th1 versus Th2 dominance, possibly due to the differences in the absolute amount of VitD exposure, the baseline VitD status, and the timing of exposure. More likely, at pharmacologic levels, VitD may inhibit both Th1 and Th2 cell activation. 38
In the present study, VitD3 treatment was associated with an improvement in asthma symptoms after 1 month. However, this beneficiary effect was not accompanied by a change in the expression of GRs, suggesting other pathogenetic mechanisms. Several studies provided evidence that VitD affects glucocorticoid signaling pathways. In a study of steroid-resistant asthmatics, the addition of VitD and dexamethasone to cultures of CD4+ T regulatory cells enhanced the secretion of IL-10 to levels comparable to those in steroid-sensitive patients receiving dexamethasone alone. 39 Furthermore, VitD enhanced dexamethasone-induced MAP kinase phosphatase-1 (MKP-1) expression in PBMCs, 40 an important pathway by which glucocorticoids exert their anti-inflammatory effects. In steroid-resistant cell models, VitD increases the activity and immunosuppressive function of dexamethasone, depending on its dosage. 5 These data raise the question as to whether VitD3 supplementation could potentially produce a steroid sparing effect in asthma.
In the current study, the main outcome parameter was the relative expression patterns of GRs. Only those children with low VitD levels were included in order to evaluate the role of VitD3 treatment in this group of children. It could be of potential interest to study those children with even lower levels of VitD. A follow-up duration of 1 month might be considered too short to assess a beneficiary role of VitD3 treatment on asthma control confidently. VitD3 has a fairly long circulating half-life of 15 days. 41 However, given that VitD was restored at 1 month, a putative effect of this treatment on asthma should be in place even at this stage. There may be some suspicions about the efficacy and safety of treating VitD deficiency with high-dose VitD3. It has, however, been shown with randomized controlled trials that an oral dose of 300,000 or 600,000 IU VitD3 in the treatment of nutritional rickets is safe and effective.42,43 Other potential limitations to the present study are the lack of a third group consisting of asthmatic children receiving no VitD3 treatment as a control group and the short duration of the follow-up. We could not evaluate the placebo or seasonal effect on ACT and respiratory funcion test (RFT). In this study, the serum calcium, albumin, and alkaline phosphatase levels were not determined, unfortunately changes in metabolic parameters during treatment with VitD could not be evaluated. More studies with a longer duration of follow-up and those with varying basal VitD levels are warranted to examine the exact role of VitD3 treatment in asthma.
In conclusion, the present study demonstrated that in healthy children with low VitD levels, restoration of VitD3 with supplementation therapy led to a downregulation in the expression of GR-β. On the other hand, the expression patterns of GRs in asthmatic children were not affected by VitD3 therapy, possibly due to the ongoing use of inhaled corticosteroids. The complex interactions between VitD and the relative expression of GRs warrant further investigation.
Footnotes
Acknowledgments
We thank Prof. Yüksel Bek from the Department of Biostatistics, Ondokuz Mayis University, Samsun, Turkey, for his important contributions to the statistics. This study was supported by Ondokuz Mayis University Study Grant (project no. PYO.TIP.1904.10.044).
Author Disclosure Statement
No competing financial interests exist.