
Abstract
The study aimed to screen potential key genes related to childhood atopic asthma based on an integrated analysis of gene expression and methylation profiles, as well as provide potential therapeutic targets for the progression of childhood atopic asthma. The gene expression profile of nasal epithelial cells GSE65204 (including 36 atopic asthma patients and 33 healthy controls) and the corresponding methylation profile GSE65163 (including 36 atopic asthma and 36 healthy controls) were obtained from the Gene Expression Omnibus. Following differentially expressed genes (DEGs) and differentially methylated positions (DMPs) were identified, correction analysis between DEGs and DMPs was conducted. Function and pathway-enrichment analyses were also performed for these candidate genes. Protein–protein interaction (PPI) and transcription factor (TF) regulatory networks were constructed. A total of 199 methylated DEGs were selected in childhood atopic asthma samples. Most were highly correlated with functions in the inflammatory response and the T cell receptor (TCR) signaling pathway. Moreover, CD8A, FYN, LCK, CXCR6, CCL5, and POSTN with differentially methylated sites in their promoter regions were significantly negatively correlated with their gene expression levels, and were found to have high degrees in the PPI network. In addition, TF MAZ may play an important role in the development of childhood atopic asthma by binding its targets, such as CD8A, FYN, and LCK. The methylated genes, CD8A, FYN, LCK, CXCR6, CCL5, and POSTN, may be closely associated with the pathogenesis of childhood atopic asthma owing to their roles in the inflammatory response and in the TCR signaling pathway.
Introduction
A
Asthma is a genetically determined disease and is estimated to be 44%–60% heritable. 11 Several genes have been reported to be related to the development of atopic asthma; for example, the downregulation of Forkhead box P3 (FOXP3) plays a crucial role in regulating inflammatory processes in atopic asthma through chemokine signaling pathways. 12 DNA methylation has been proved to be an important in regulating gene expression. Various reports have shown that most CpG sites of asthma-associated genes are methylated, such as gasdermin B (GSDMB) and ORMDL sphingolipid biosynthesis regulator 3 (ORMDL3), 13 gasdermin A (GSDMA), 14 leptin (LEP), 15 acyl-CoA synthetase long-chain family member 3 (ACSL3), 16 interleukin-4 (IL-4), and interferon-γ (IFN-γ). 17 Most of these genes (eg, GSDMB, ORMDL, IL-4, and IFN-γ) are related to the immune system, and changes in their methylation may contribute to the development of asthma either by promoting lymphocyte-driven inflammation or by affecting the differentiation of CD4+ T lymphocytes into T-helper cells.13,17 Interleukin-1 receptor type 2 (IL1R2) expression is downregulated because of hypermethylation in its promoter region and is associated with allergic asthma by influencing T helper 2 (TH2) cell imbalance. 18 In addition, AXL receptor tyrosine kinase (AXL) acts as a crucial signaling molecule in immune response, and its methylation at the CpG locus (cg00360107) has been reported to be directly correlated with a higher risk for childhood asthma. 19
Since atopic asthma can severely influence quality of life, and the mechanisms underlying the development of atopic asthma are still not fully understood, it is necessary to further explore the molecular basis of this disease. Yang et al. previously analyzed DNA methylation and corresponding gene expression profiles (GEPs) to identify DNA methylation and gene expression changes related to childhood allergic asthma 20 ; however, functional enrichment analysis and prediction of upstream regulators for those genes are yet to be done. Thus, this study aimed to screen important methylated genes in samples from patients with atopic asthma and gain insights into the molecular mechanisms underlying the development of childhood atopic asthma.
Methods and Materials
Microarray data
The GEP of GSE65204 based on the platform of Agilent-028004 SurePrint G3 Human GE 8x60K Microarray was extracted from Gene Expression Omnibus (GEO) database (www.ncbi.nlm.nih.gov/geo/). This profile consisted of 69 samples, including nasal epithelial cells from 36 African American children with atopic asthma and 33 healthy controls. The corresponding methylation profile (GSE65163) based on Illumina HumanMethylation450 BeadChip was also obtained from the GEO database and was utilized in this study. This profile consisted of 72 samples, including 36 atopic asthma samples and 36 healthy controls. The GSE65204 and GSE65163 were disposed by Yang et al., 20 in which study subjects were supported by the Inner City Asthma Consortium from census tracts. However, we only reanalyzed the microarray data of above 2 datasets, and it was not required for collecting participants or obtaining patients information. Thus, the ethics approval was not needed for the present study.
Data preprocessing and analysis of differentially expressed genes
The raw probe-level data were first converted into an expression value matrix by the Affy package in R (programming language), and then background correction, quartile data normalization, and expression calculation were conducted by the Robust Multi-array Average algorithm. 21 Afterward, the differentially expressed genes (DEGs) between atopic asthma and normal samples were analyzed by the Linear Model and Empirical Bayes Method based on the Linear Models Microarray Data (limma; www.bioconductor.org/packages/release/bioc/html/limma.html) package in R, and multiple testing adjustment was performed by the Benjamini and Hochberg method. 22 P < 0.05 was used as the cutoff criterion.
Data preprocessing of the methylation profile and screening of differentially methylated positions
RnBeads is a package in R for the large-scale analysis and interpretation of DNA methylation data (http://rnbeads.mpi-inf.mpg.de/). 23 The RnBeads software was used to handle the raw methylation data, including quality control, background correction, data normalization, and probe filtration. In addition, the β-value, which is the ratio between methylated probe intensity and the overall intensity, was converted into M value and was used to show methylation level. After data preprocessing, the Bayes method in limma package was used to identify differentially methylated positions (DMPs) between atopic asthma and healthy samples. To account for the potential confounders, such as ethnicity, age, and gender differences between the samples, the known or predicted unknown concomitant variables were used to adjust the raw P values as the false discovery rate (FDR) using the SVA package in R. 24 FDR <0.05 was chosen as the cutoff criterion to screen DMPs.
Correlation analysis between DEGs and DMPs
We obtained 4 gene sets, including upregulated and downregulated DEGs, and hypomethylated and hypermethylated genes. A Venn diagram was used to select the overlapped genes between the 4 gene sets. Upregulated DEGs that were simultaneously hypomethylated/hypermethylated, and the downregulated DEGs that were hypermethylated/hypomethylated were chosen. To narrow the possible range, the hypomethylated, upregulated DEGs and the hypermethylated, downregulated DEGs were considered as candidate genes and used for subsequent analyses.
Next, above 69 samples that performed both the methylation and GEPs analyses were screened, and correlation analysis was performed by calculating the Spearman correlation coefficient between the β-values and expression values. To explore the genes whose expression levels may be influenced by negative regulation of their methylation sites, the threshold values of P < 0.05 and r < −0.4 were defined as significant negative correlation between the DEGs and methylation levels. In addition, the DEGs with methylated sites in the promoter region were screened.
Function and pathway-enrichment analysis of candidate genes
The Database for Annotation, Visualization, and Integrated Discovery (DAVID; https://david.ncifcrf.gov/) is a gene functional classification tool for grouping functionally related genes and terms into a number of biological modules for efficient interpretation of gene function. 25 Gene Ontology (GO; www.geneontology.org/) function and Kyoto Encyclopedia of Genes and Genomes (KEGG; www.genome.jp/kegg/) pathway-enrichment analyses were performed on the upregulated DEGs with hypomethylated levels and downregulated DEGs with hypermethylated levels using the online DAVID tool. 26 P < 0.05 was chosen as the cutoff criterion for the selection of significant functional and pathway terms.
Protein–protein interaction network construction of candidate genes
The Search Tool for the Retrieval of Interacting Genes (STRING; http://string-db.org/) is a database for the prediction and analysis of functional associations between proteins encoded by DEGs. 27 The STRING database was used to explore the protein–protein interaction (PPI) pairs between DEGs with combined score >0.4 set as the threshold. After the PPI pairs were obtained, the Cytoscape software (www.cytoscape.org/) was used for network visualization. 28 Then, the hub proteins were selected based on the scale-free property of the network.
Prediction of transcription factors of candidate genes and regulatory network construction
The WEB-based GEne SeT AnaLysis Toolkit (WebGestalt; www.webgestalt.org/option.php) is a popular software tool for functional genomic, proteomic, and large-scale genetic studies for large sets of genes.29,30 It was used to predict the transcription factors (TF) that bind to the candidate genes. Then, count ≥2 and adj.P < 0.01 were chosen as the cutoff criteria. Moreover, the top 10 TFs (ranked by adj.P value) and their related genes were selected to conduct a TF-target regulatory network using Cytoscape software.
Results
Data preprocessing and DEGs screening
Based on the data preprocessing, the average expression values of each sample almost fell on the same straight line (Supplementary Fig. S1; Supplementary materials are available online at www.liebertpub.com/ped), which demonstrated that the normalized data could be used for further analysis. With the cutoff criterion, a total of 1,757 DEGs across atopic asthma and healthy samples were selected, including 1,106 upregulated genes and 651 downregulated genes.
Data preprocessing of methylation profile and DMP screening
According to the criterion, a total of 3,847 DMPs were obtained between atopic asthma and healthy samples, including 1,244 hypermethylated positions corresponding to 976 genes and 2,603 hypomethylated positions corresponding to 1,958 genes in atopic asthma samples.
The associations between DEGs and DMPs
A total of 147 upregulated DEGs corresponding to 226 hypomethylated DMPs, and 45 upregulated DEGs corresponding to 62 hypermethylated DMPs, whereas 52 downregulated DEGs corresponding to 83 hypermethylated DMPs and 34 downregulated DEGs corresponding to 39 hypomethylated DMPs were selected (Fig. 1). The top 5 genes (ranked according to P value of DEGs) in the above 4 gene sets are shown in Table 1.

Venn diagram of up-regulated DEGs, down-regulated DEGs, hypomethylated genes and hypermethylated genes.
CpG site stands for the position of the methylation microarray. Feature represents the corresponding gene location of the CpG site. Meth.p.fdr indicates the significance methylation level of adjusted fdr. Exprs.log2FC stands for the log2-fold change of expression values, and Expr.p indicates the significance level of t-test.
DEGs, differentially expressed genes; fdr, false discovery rate.
Further correlation analysis indicated that among the 147 upregulated DEGs, 61 DEGs (eg, ALOX15, POSTN, and CTSC) were significantly negatively correlated with their hypomethylated DMPs. Meanwhile, among the 52 downregulated DEGs, 44 DEGs (eg, HLA-DPA1, CXCR6, and CCL5) were significantly negatively correlated with their hypermethylated DMPs. Genes, such as ALOX15, POSTN, CTSC, HLA-DPA1, CXCR6, and CCL5, were also identified as DEGs that had significant relationships between their methylation status and gene expression level by Yang et al. 20 In addition, we have focused on the DEGs with methylation sites in promoter regions. There were 22 upregulated DEGs with methylation sites in the promoter region, and among these, the expression of ARNTL2 (cg17367616), TM4SF1 (cg16810293), TMEM71 (cg05598678), and POSTN (cg13634560) were significantly negatively correlated with their methylation levels. On the other hand, there were 19 downregulated DEGs with methylation sites in the promoter region, and expressions of CD8A (cg03318654), FYN (cg04657000), LCK (cg11683242), CXCR6 (cg05705212), CCL5 (cg19411729), and CD2 (cg16719404) were significantly negatively correlated with their methylation levels (Fig. 2).

Scatter plots show the significantly negative correlations between the gene expressions and methylation levels.
Function and pathway-enrichment analyses of candidate genes
Based on the DAVID database, the hypomethylated, upregulated DEGs were significantly related to functions such as “positive regulation of cell proliferation” and pathways such as “PI3K-Akt signaling pathway” (Table 2A), whereas the hypermethylated, downregulated DEGs were significantly associated with functions such as “inflammatory response” and pathways such as the “T cell receptor (TCR) signaling pathway” (eg, CD8A, FYN, and LCK) (Table 2B).
A: The functional enrichment analysis of upregulated hypomethylated genes. B: The functional enrichment analysis of downregulated hypermethylated genes. Count represents the number of DEGs enriched in the corresponding GO and KEGG categories, and ratio is a relationship between gene count in the corresponding term and numbers of the gene set.
GO, Gene Ontology; KEGG, Kyoto Encyclopedia of Genes and Genomes.
PPI network analysis
By integrating information from the STRING database with the identified DEGs, a total of 191 PPIs involving 83 upregulated DEGs with hypomethylation and 35 downregulated DEGs with hypermethylation, were included in the network (Fig. 3). The top 10 nodes with high degrees in the PPI network were selected, such as CD8A, TNF, FYN, LCK, CXCR6, CCL5, and DPP4 (Table 3).

The protein–protein interaction network of candidate genes. The nodes stand for the genes and the lines represent the corresponding interaction relationships. The circular-shaped nodes represent downregulated hypermethylated DEGs, and the diamond-shaped nodes represent upregulated hypomethylated DEGs.
BC, betweenness centrality; CC, closeness centrality; DC, degree centrality.
Predicted TFs of candidate genes and the regulatory network
Based on the WebGestalt software, the upstream TFs related to the candidate genes were screened. As a result, a total of 223 TFs that targeted 159 candidate genes were identified. Then, the regulatory network containing the top 10 TFs (eg, MAZ, NFAT and SP1) that corresponded to 129 target genes was constructed, and the network consisted of 338 regulation interactions (Fig. 4). Interestingly, in this regulatory network, the hub genes such as CD8A, TNF, FYN, and LCK were found to have relationships with the aforementioned TFs.
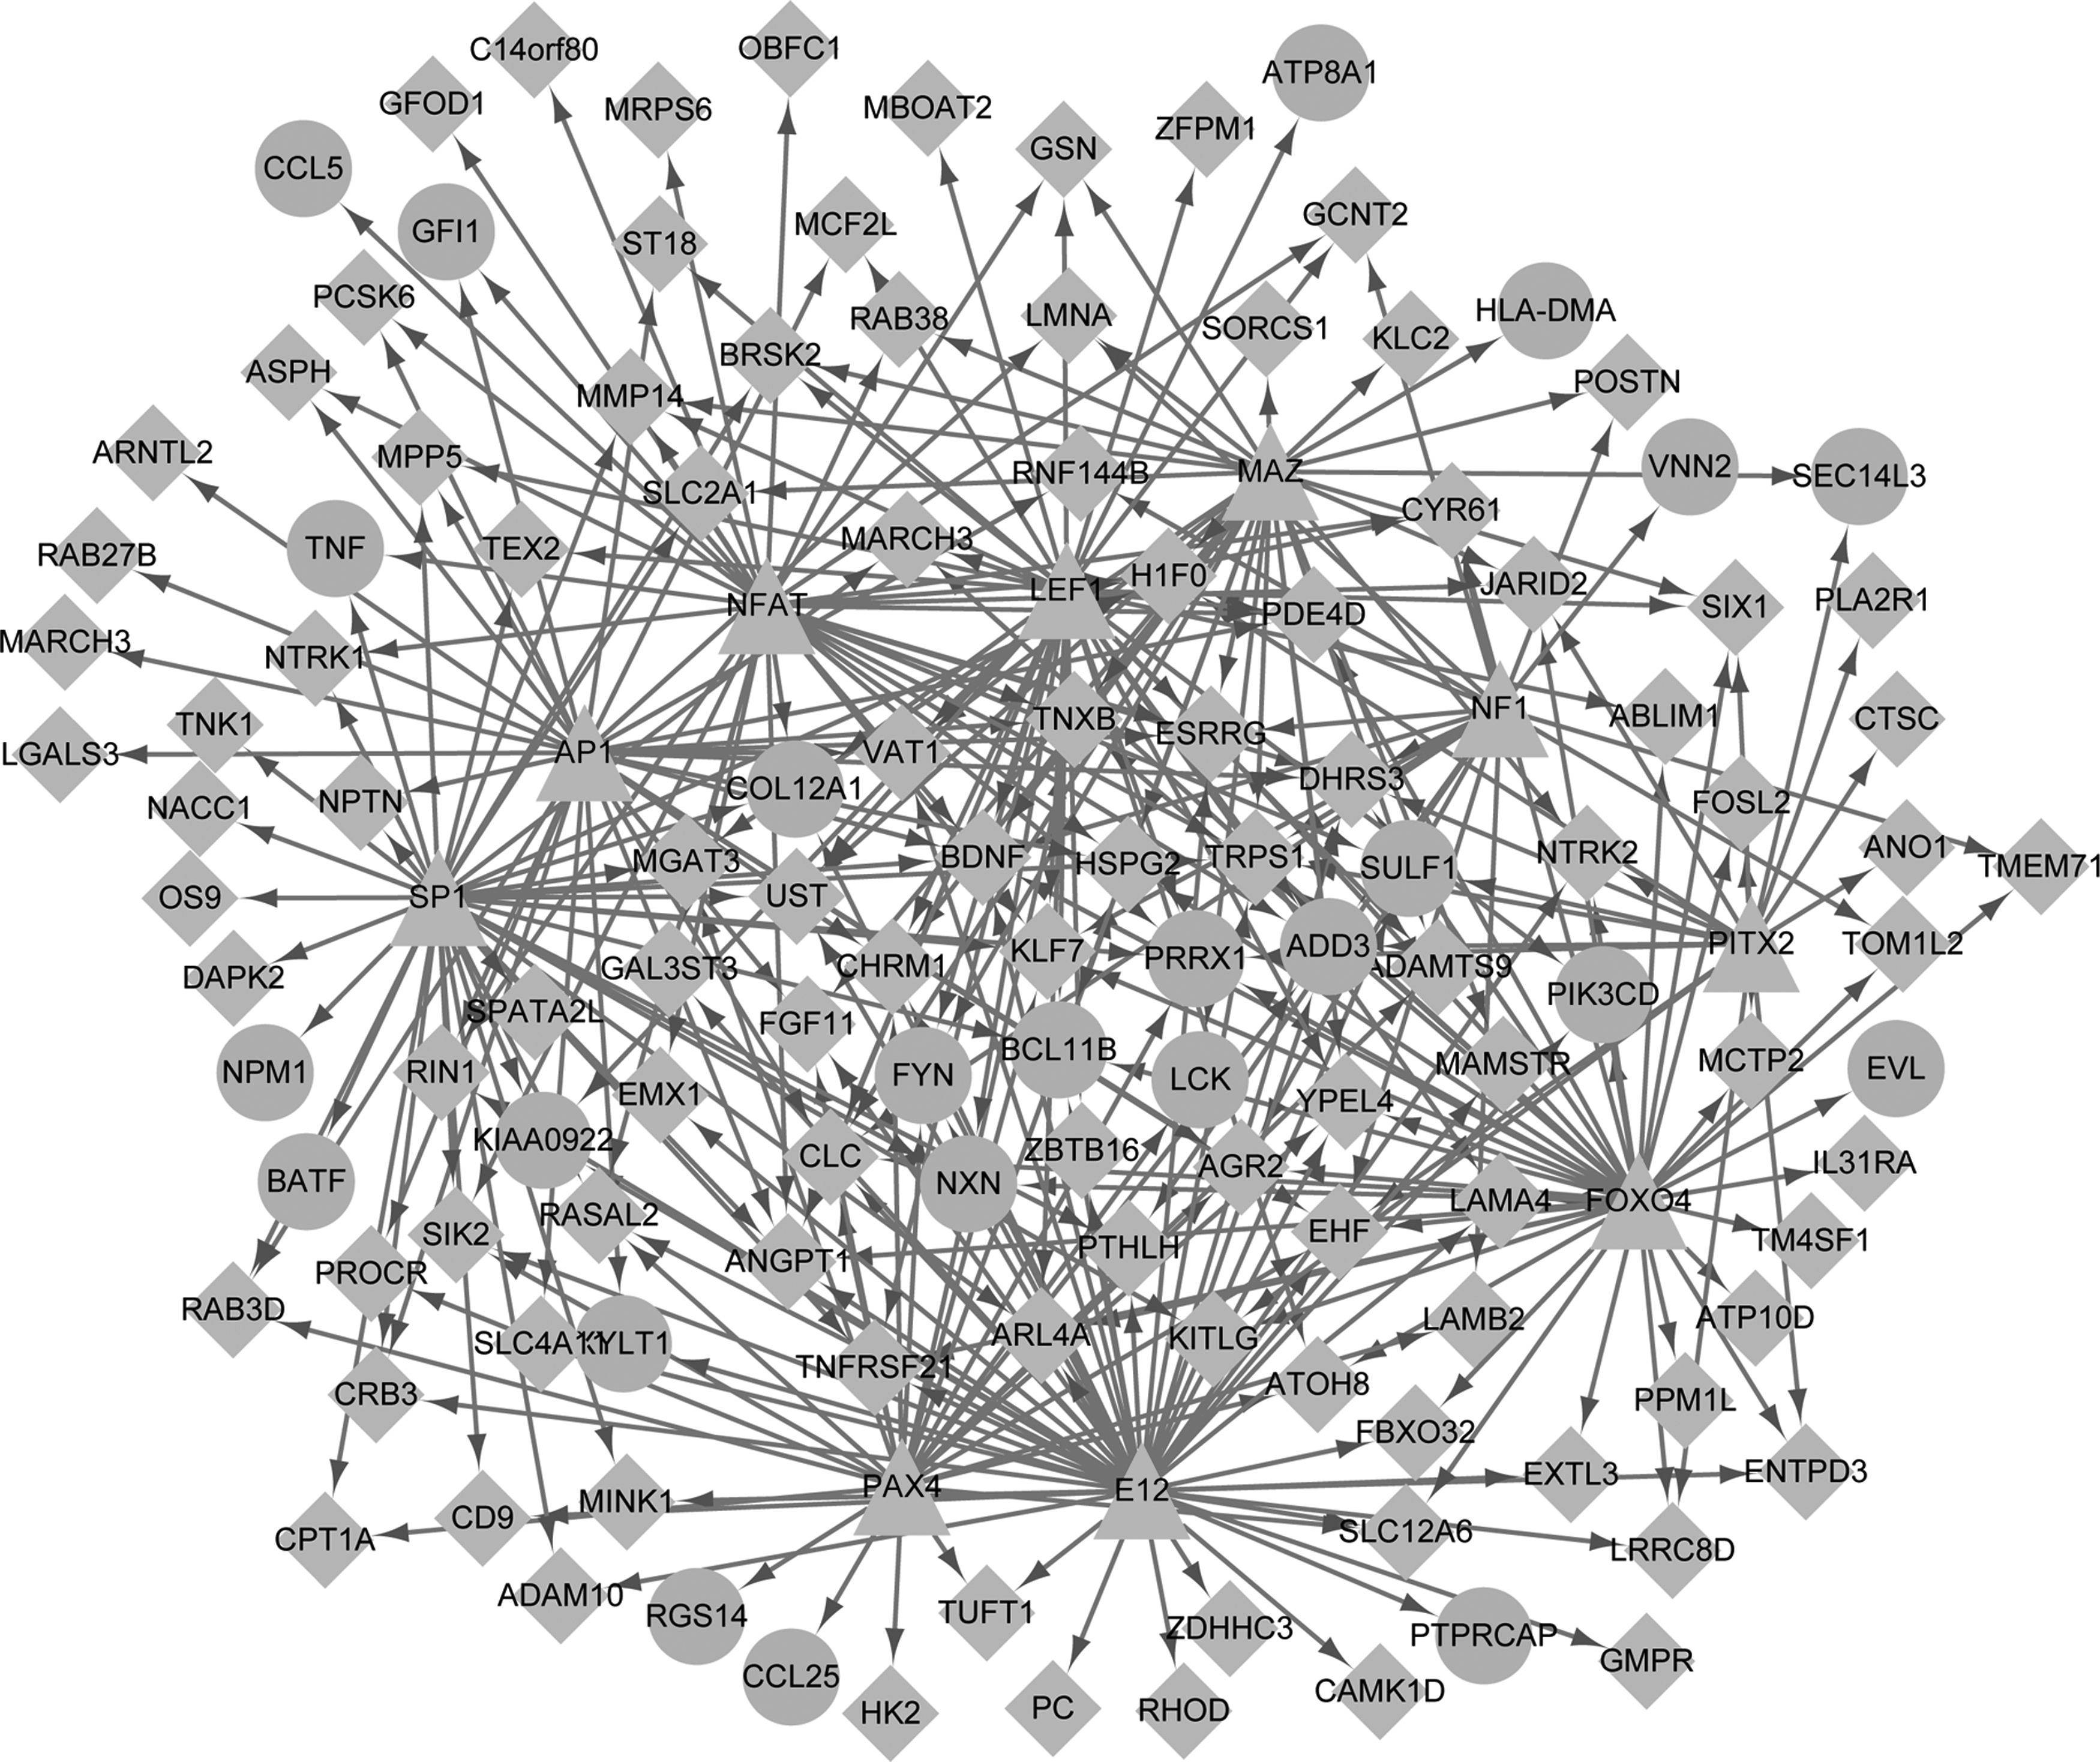
The regulatory network of TFs and their target genes. The triangle-shaped nodes represent the top 10 predicted TFs, the diamond-shaped nodes represent downregulated hypermethylated DEGs and circular-shaped nodes represent upregulated hypomethylated DEGs. TFs, transcription factors.
Discussion
In the present study, a total of 199 candidate genes were identified between atopic asthma children and healthy samples through association analysis of gene expression and methylation profiles. The correlation analysis showed the expression of CD8A, FYN, LCK, CXCR6, CCL5, and POSTN, whose methylation sites in the promoter regions, were significantly negatively correlated with their methylation levels. Functional enrichment analysis revealed that DEGs in the PPI network were significantly associated with the functions of “TCR signaling pathway” (eg, FYN and LCK) and “inflammatory response” (eg, CXCR6 and CCL5). Additionally, MAZ was shown to be a key TF in the regulation of the expression of the aforementioned DEGs.
Allergic airway inflammation with eosinophilic and/or neutrophilic infiltration is a key symptom of asthma, 31 and the chronic inflammation induced by increased IgE is considered as a pathology of allergic asthma. 32 It is well known that the increased IgE is mainly dependent on the activation and differentiation of T helper 2 (TH2) cells, which release cytokines [eg, IL-4, IL-5, and IL-13]. 33 In addition, it has been proven that different T cell subsets can also cause recurrent infections and airway inflammation, which contribute to the development of allergic asthma, more than just TH2 cells. 34 Similarly, our functional enrichment analysis results showed that the hub genes, CD8A, LCK, FYN, CXCR6, and CCL5 in the PPI network, were relevant to T cell development, activation, immune function, and inflammatory response.
In our study, CD8A, LCK, and FYN were all downregulated DEGs with hypermethylation promoter regions, and were associated with “TCR signaling pathway.” Notably, those genes were regulated by the TF MYC-associated zinc finger protein (MAZ). CD8 alpha (CD8A), which encodes the α chain of the CD8 protein, acts as a coreceptor with the cytotoxic T cells. Previous studies have proved that CD8A plays essential roles in cell-mediated immune defense and T cell development, and it can regulate antigen-specific effector T cells to suppress autoimmune thyroiditis.35,36 Additionally, the TF MAZ-related factor (MAZR) has been shown to regulate CD8A expression in CD8+ T cells based on TCR signaling strength, and the potential for cytotoxic lineage differentiation of CD8+ effector T cells is impaired in MAZR-deficient thymocytes. 37 Moreover, CD8A mutation can lead to CD8 deficiency, which increases susceptibility to recurrent respiratory infections. 38 Furthermore, the silencing of CD8 expression is due to CpG methylation of several regions of the CD8A locus. 39 Similarly, our results showed that CD8A was downregulated in atopic asthma children samples compared with its expression in the healthy controls, which was also shown to be significantly negatively correlated with its hypermethylation at cg03318654 site of the promoter region. These collectively imply that the downregulation of CD8A might be caused by the CpG hypermethylation, and this might influence the TCR signaling pathway, thereby regulating atopic asthma progression in children.
Lymphocyte cell-specific protein tyrosine kinase (LCK) and nonreceptor tyrosine protein kinase (FYN) belong to the members of the protein tyrosine kinase oncogene family, which are crucial in T cell development and activation mediated by TCR signaling, and they are both cancer-related oncogenes regulated by MAZ.40,41 The LCK gene deficiency can cause T cell immunodeficiency by impairing TCR signaling in T cells. 42 Similarly, it has been reported that FYN plays a role in downstream signaling pathways related to T cell proliferation and differentiation following TCR stimulation, and several polymorphisms in FYN are closely connected with childhood asthma. 43 Moreover, the altered methylation level of LCK acts as an immune response factor correlated with T lymphocyte infiltration in breast cancers. 44 The high DNA methyltransferase activity is likely to downregulate FYN in T lymphoma cell. 45
In the PPI network, another 2 hub-downregulated genes, CXCR6 and CCL5, differentially hypermethylated in their promoter regions at cg05705212 and cg19411729 CpG sites, respectively, were involved in the function of “inflammatory response.” C-X-C Motif Chemokine Receptor 6 (CXCR6) is not only closely related to T cell activation, but also its downregulated expression may inhibit a downstream process of continued inflammation in the animal model with allergen challenged asthma. 46 Chemokine ligand 5 (CCL5) is a chemotactic cytokine for airway recruitment of eosinophils to induce airway inflammation and hyperresponsiveness in asthma. 47 An enhanced level of CCL5 is detected in adult atopic asthmatics, 48 however, Hamsten et al. have suggested that CCL5 is downregulated in childhood asthma, 49 which is consistent with our result. Although we speculated that CXCR6 hypermethylated at cg05705212 and CCL5 hypermethylated at cg19411729 were closely associated with the inflammatory response in children with atopic asthma, no related studies have reported about the expression of these genes being associated with the alteration of their methylation levels in asthmatics. Therefore, future studies are required to confirm this hypothesis.
According to our result, the hypomethylated periostin (POSTN) at cg13634560 was upregulated in atopic asthma children samples, and its expression level was significantly negatively correlated with its methylation level. Periostin is an extracellular matrix protein involved in allergic inflammation. 50 Similarly, Jia et al. have indicated that periostin levels in serum are remarkably enhanced in asthmatics, and its increase is a marker for eosinophilic airway inflammation. 51 However, this was firstly suggested that the hypomethylation of POSTN at cg13634560 may be associated with childhood atopic asthma.
It was worth mentioning that, although we used the same dataset as the study by Yang et al., 20 different analyses were performed in the present study. In the study by Yang et al., only 186 DMPs or differentially methylated probes, 53 DEGs, and 32 DEGs that showed significant relationships between DNA methylation and gene expression within 5 kb were screened, which could have limited the subsequent bioinformatics analysis. In the present study, a less restrictive threshold value, as well as different methods were employed to identify more DEGs and DMPs. Notably, the DEGs with an associated change in DNA methylation mentioned in their article (eg, CXCR6, CCL5, and POSTN) were also identified in our study. However, novel DEGs that had significant relationships between their DNA methylation status were identified in our study and should be validated in future studies.
Conclusions
In summary, genes such as CD8A, FYN, LCK, CXCR6, CCL5, and POSTN with changes in the methylation levels of their promoter region might play an important role in the development of childhood atopic asthma by influencing the “inflammatory response” and “TCR signaling pathway.” However, future experiments are necessary to validate these findings.
Footnotes
Author Disclosure statement
No competing financial interests exist.
References
Supplementary Material
Please find the following supplemental material available below.
For Open Access articles published under a Creative Commons License, all supplemental material carries the same license as the article it is associated with.
For non-Open Access articles published, all supplemental material carries a non-exclusive license, and permission requests for re-use of supplemental material or any part of supplemental material shall be sent directly to the copyright owner as specified in the copyright notice associated with the article.