
Abstract
Introduction:
Patients with food protein-induced enterocolitis syndrome (FPIES) have elevated thymus and activation-regulated chemokine (TARC) levels in the acute phase. However, to the best of our knowledge, no study has evaluated TARC levels in the acute phase of immunoglobulin E-dependent food allergy (IgE-FA). If TARC elevation is a specific response to FPIES among FAs, TARC measurement may help distinguish between FPIES and IgE-FA. Thus, we investigated acute phase TARC levels in patients with FPIES and IgE-FA.
Methods:
Thirty-one episodes in 16 patients with FPIES and 20 episodes (13 were anaphylaxis) in 20 patients with IgE-FA were included. Patients with eczema were excluded. Serum TARC levels within 6 h of allergic reaction onset and age-adjusted TARC ratios (TARC levels divided by age-specific normal TARC values) were compared between the groups.
Results:
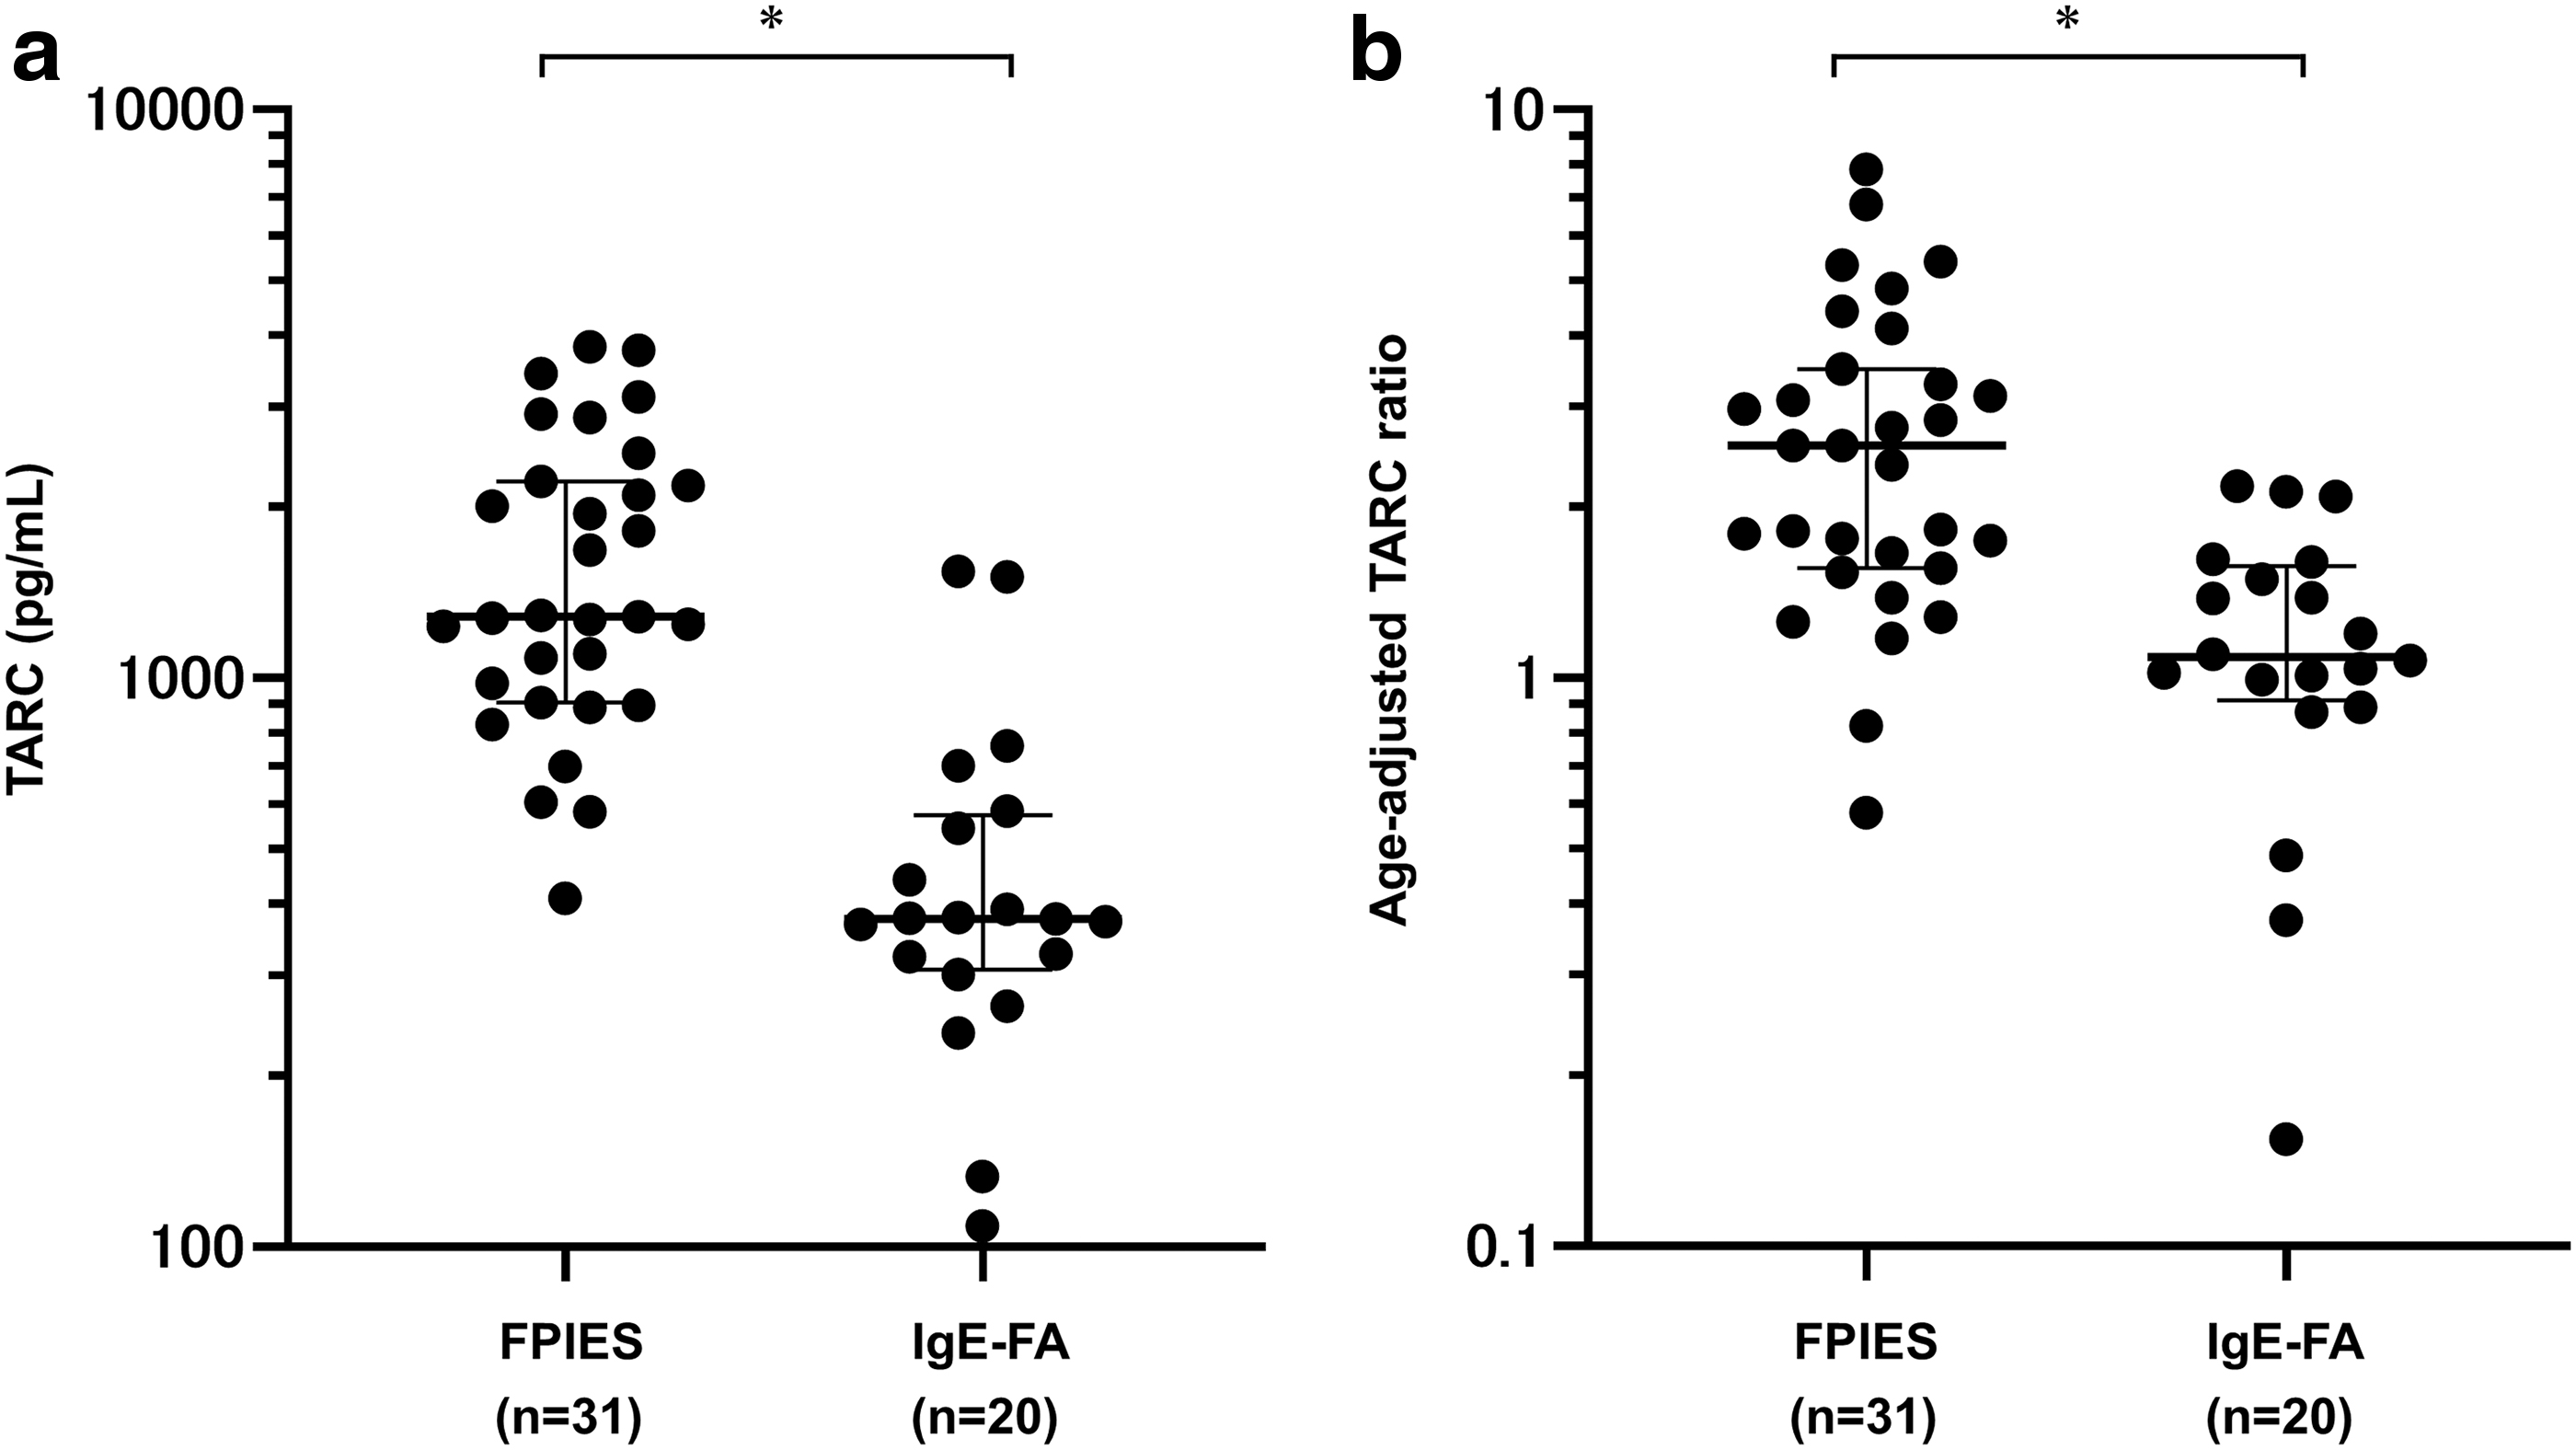
The median age was 1.1 and 3.6 years in the FPIES and IgE-FA groups, respectively (P < 0.001). The median (range) serum TARC (pg/mL) levels were significantly higher in the FPIES group than in the IgE-FA group [1,283 (410–3,821) versus 377 (109–1,539); P < 0.001]. The median (range) age-adjusted TARC ratios were also significantly higher in the FPIES group [2.56 (0.57–7.86) versus 1.08 (0.15–2.17); P < 0.001]. The area under the curve (AUC) for TARC to distinguish FPIES from IgE-FA was 0.926, and the AUC for the age-adjusted TARC ratio was 0.850. The odds ratio for FPIES diagnosis per 1,000 pg/mL increase in TARC was 31.6 (P = 0.002), and the odds ratio adjusted by age was 17.1 (P = 0.016).
Conclusion:
Acute phase TARC levels were higher in patients with FPIES than in patients with IgE-FA. The increase in acute phase TARC levels was considered to be a specific response to FPIES among FAs. Measurement of TARC levels in the acute phase may help differentiate FPIES from IgE-FA.
Introduction
Food protein-induced enterocolitis syndrome (FPIES) is a non-immunoglobulin E (non-IgE)-dependent allergic reaction that presents only with gastrointestinal symptoms such as vomiting.1,2 Thymus and activation-regulated chemokine (TARC) is a chemokine produced by dendritic cells, endothelial cells, keratinocytes, and fibroblasts. 3 A recent study showed that serum TARC levels are significantly elevated in the acute phase of FPIES. Serum TARC levels were also associated with the severity of FPIES symptoms. In addition, TARC has been reported to be a useful biomarker for predicting FPIES because serum TARC levels are more likely to be elevated in the acute phase of FPIES than in infectious gastroenteritis or sepsis.4,5
Patients with atopic dermatitis (AD) have long been reported to have elevated serum TARC levels, which have been used in the diagnosis and severity assessment of AD.6–9 However, among allergic diseases, there have been no reports on the acute evaluation of TARC levels in patients with immunoglobulin E-dependent food allergy (IgE-FA).
FPIES and IgE-FA have different postdiagnostic management and prognoses. However, it can be difficult to distinguish FPIES from IgE-FA in patients with no or few cutaneous symptoms. If the acute increase in TARC levels occurs only in FPIES and not in IgE-FA, then TARC measurement may be useful in discriminating between FPIES and IgE-FA.
This study was conducted in patients with FPIES and IgE-FA to determine whether acute TARC elevation in FPIES among food allergies (FAs) is a disease-specific reaction and to evaluate the usefulness of TARC measurement in differentiating FPIES from IgE-FA.
Materials and Methods
Study design
This case-controlled study included patients with solid FPIES and IgE-FA, who visited our department between April 2019 and January 2022. Eligible patients were prospectively studied. The study was approved by the Ethical Review Committee of Saitama Medical Center of Jichi Medical University (approval number S19-077), and written consent was obtained from the patients' guardians.
Patients
FPIES group
The diagnostic criteria of the International Consensus Guidelines 2 were adopted for the diagnosis of FPIES. Patients with solid FPIES, who presented to the emergency department for vomiting after ingestion of the causative food or who underwent an oral food challenge (OFC) for diagnostic purposes or remission confirmation, were included in the study. Blood tests were performed at the time of the emergency department visit in emergency cases and 6 h after antigen ingestion in OFC cases. Only cases in which blood tests were performed within 6 h of symptom onset were included. A total of 31 episodes (13 emergency department visits and 18 OFCs) in 16 patients with FPIES who met these criteria were included in the analysis.
IgE-FA group
Based on Japanese FA guidelines, 10 we diagnosed IgE-FA in patients with positive OFC results or a history of immediate reactions after ingestion of the causative allergen and positive specific IgE antibody titer (≥0.35 UA/mL) of the causative allergen. Patients with severe FA who presented to the emergency department with immediate symptoms after ingestion of the causative allergen and who required peripheral venous catheterization for treatment were included. Only patients whose blood samples were drawn within 6 h of symptom onset were included. A total of 20 episodes in 20 patients with FA who met these criteria were included in the analysis.
Evaluated parameters
Patient background data
Age and sex data were collected for all patients. For FPIES cases, symptoms and severity of each episode were assessed; the severity of FPIES symptoms was determined using the severity criteria of the International Consensus Guideline 2 (mild in case of 1–2 vomiting episodes without lethargy, moderate in case of 3 or more vomiting episodes with mild lethargy, and severe in case of 3 or more vomiting episodes with severe lethargy, hypotonia, or ashen or cyanotic appearance). FA cases were evaluated for presence of organ-specific symptoms (cutaneous, respiratory, gastrointestinal, and cardiovascular), severity (Grade 1–3), and anaphylaxis (as defined by the Japanese FA guidelines). 10
Blood testing
Serum TARC levels were measured by chemiluminescent enzyme immunoassay using the HISCL® TARC Assay Kit (Sysmex, Hyogo, Japan). At the same time, white blood cell count, neutrophil count, platelet count, C-reactive protein levels, lactate dehydrogenase levels, venous blood pH, HCO3− levels, and methemoglobin levels were also measured.
As normal serum TARC values differ according to age, the age-adjusted TARC ratio was defined as the value obtained by dividing the measured TARC level by the average TARC level in healthy children (0–1 year = 707 pg/mL, 2–5 years = 365 pg/mL, and ≥6 years = 273 pg/mL) according to existing reports 6 and evaluated.
Oral food challenge
OFC in patients with FPIES was performed using a single-dose method, with the ingestion dose set at the same or half the amount of the causative food at the time of previous symptom presentation. Physicians and nurses examined the patients periodically up to 24 h after ingestion. The OFC positivity was determined according to the International Consensus Guidelines. 2
Statistical analysis
Blood test results were compared between the FPIES and IgE-FA groups. The Mann–Whitney U test was used to compare the 2 groups for continuous variables. TARC values were also compared by severity and symptoms within each group. Receiver operating characteristic (ROC) analysis was performed for TARC levels and age-adjusted TARC ratios, using the discrimination between FPIES and IgE-FA as an index, and the area under the ROC curve [area under the curve (AUC)], sensitivity, and specificity at cutoff values were determined. Univariate and age-adjusted multivariate analyses were performed for TARC levels in the FPIES group. P < 0.05 was defined as significant. All statistical analyses were performed using EZR 1.33 software (Saitama Medical Center, Jichi Medical University, Saitama, Japan). 11
Results
Patients
Patient characteristics and symptoms are shown in Table 1. The 31 episodes in the FPIES group were caused by the following antigens: hen's egg yolk in 22, hen's egg white in 1, whole hen's egg in 1, rice in 3, wheat in 2, and short-neck clams in 2 cases. The 20 episodes in the IgE-FA group were caused by the following antigens: whole hen's egg in 6, wheat in 4, walnut in 4, soy in 3 cases, and cow's milk, orange, and cashew nut in 1 case each. The median age was 1.1 years for the FPIES group and 3.6 years for the IgE-FA group, with the patients in the FPIES group being significantly younger (P < 0.001).
Patient Characteristics and Symptoms
Data are presented as the median (range) or numbers (%). Differences were evaluated using the Mann–Whitney U test for continuous variables or Fisher's exact test for categorical variables.
FPIES, food protein-induced enterocolitis syndrome; IgE-FA, immunoglobulin E-dependent food allergy.
Blood test results
The blood test results are shown in Table 2. The median level of TARC was 1,283 pg/mL (range 410–3,821) in the FPIES group and 377 pg/mL (range 109–1,539) in the IgE-FA group, with significantly higher levels observed in the FPIES group (P < 0.001) (Fig. 1a). The median age-adjusted TARC ratio was 2.56 (range 0.57–7.86) in the FPIES group and 1.08 (range 0.15–2.17) in the IgE-FA group, with significantly higher ratios in the FPIES group (P < 0.001) (Fig. 1b).
Comparison of Laboratory Findings Between the Food Protein-Induced Enterocolitis Syndrome and Immunoglobulin E-Dependent Food Allergy Groups
Data are presented as the median (range). Differences were evaluated using the Mann–Whitney U test.
CRP, C-reactive protein; FPIES, food protein-induced enterocolitis syndrome; IgE-FA, immunoglobulin E-dependent food allergy; LDH, lactate dehydrogenase; TARC, thymus and activation-regulated chemokine; WBC, white blood cell count.
A comparison of TARC levels with severity in the FPIES group is shown in Fig. 2a, with median TARC levels of 3,127, 1,235, and 1,245 pg/mL for severe, moderate, and mild disease, respectively, with TARC levels in severe cases being significantly higher than those in moderate and mild ones (P < 0.001, P < 0.001).
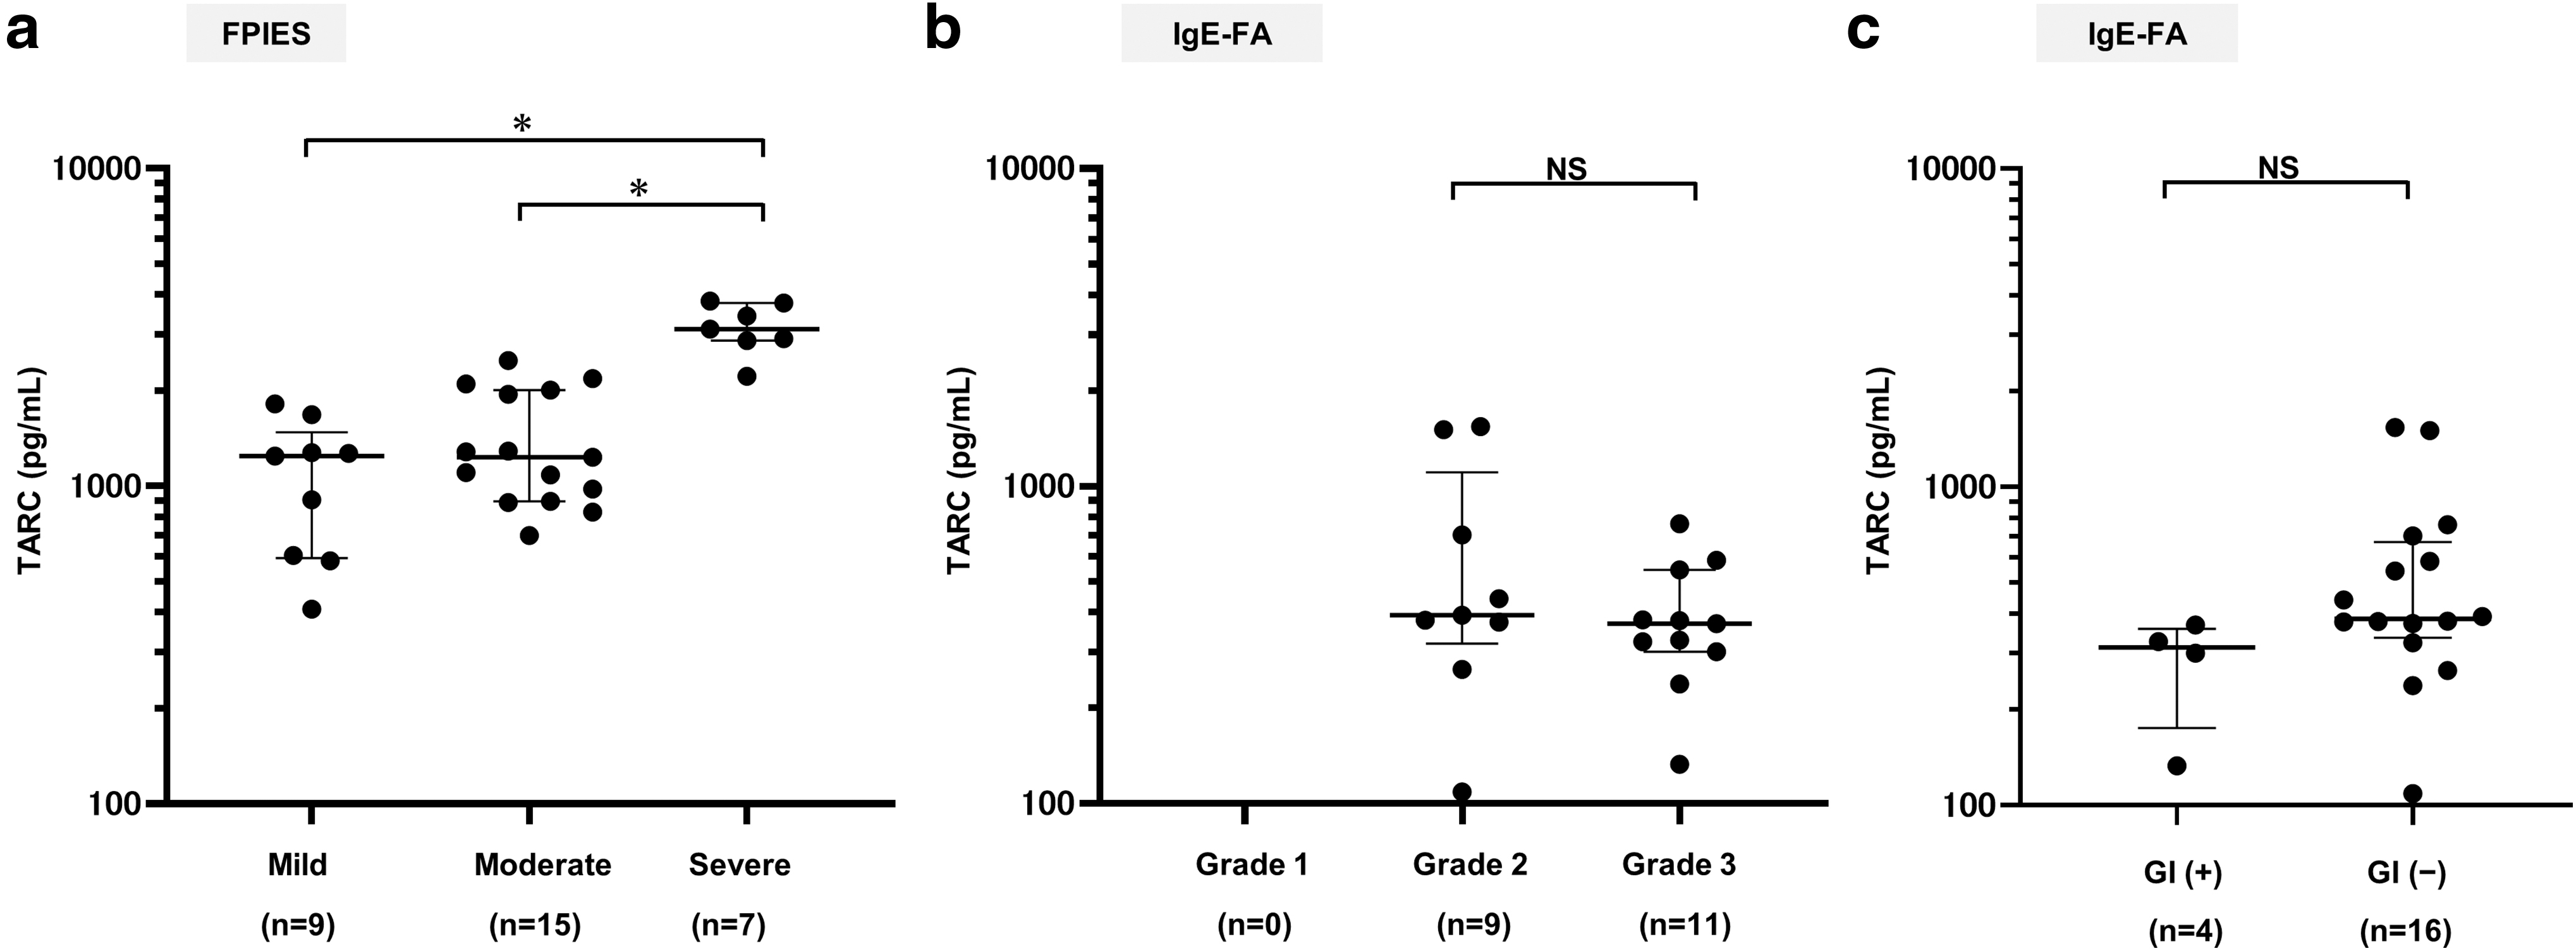
In the analysis by severity in the IgE-FA group, there was no significant difference in TARC levels between Grade 2 (moderate) and Grade 3 (severe) (Fig. 2b). Comparison of TARC values with presence or absence of gastrointestinal symptoms within the IgE-FA group showed no significant difference (Fig. 2c).
ROC analysis to discriminate FPIES from IgE-FA showed an AUC of 0.926 (95% confidence interval [CI] 0.846–1) for TARC, with a sensitivity of 87.1% and specificity of 90.0% at a cutoff value of 830 pg/mL. For the age-adjusted TARC ratio, AUC was 0.850 (95% CI 0.745–0.955), with a sensitivity of 74.2% and specificity of 95.0% at a cutoff value of 1.66 (Fig. 3). Furthermore, since the neutrophil count was also higher in the FPIES group than in the IgE-FA group, a composite index of TARC and neutrophil count was also considered. “TARC (pg/mL) × Neutrophils (/mm3)” was evaluated as a new index, but the results from ROC analysis were TARC: AUC 0.933 (95% CI 0.86–1), TARC × Neutrophils: AUC 0.930 (95% CI 0.848–1) and the AUC of TARC was slightly higher than that of TARC × Neutrophils.

Receiver operating characteristic curve for distinguishing between patients with FPIES and IgE-FA. The solid line represents TARC levels, whereas the dotted line represents the age-adjusted TARC ratio. FPIES, food protein-induced enterocolitis syndrome; IgE-FA, immunoglobulin E-dependent food allergy; TARC, thymus and activation-regulated chemokine.
The odds ratio per 1,000 pg/mL increase in TARC levels in the FPIES group by univariate analysis was 31.6 (95% CI 3.4–291.0) (P = 0.002). In multivariate analysis, the adjusted odds ratio per 1,000 pg/mL increase in age-adjusted TARC levels was 17.7 (95% CI 1.7–184.0) (P = 0.016).
Discussion
Measurement of TARC levels after vomiting was recently reported to be useful for the diagnosis of FPIES, because patients with FPIES, a non-IgE-dependent allergic disease presenting only with gastrointestinal symptoms, have higher TARC levels after vomiting than those with gastroenteritis or septicemia.4,5 However, it was not known whether TARC elevation is a disease-specific response to FPIES, as there are no reports evaluating TARC levels in patients in the acute phase of other FAs.
In this study, the acute phase blood test results of patients with FPIES and IgE-FA were evaluated, and TARC levels were found to be significantly higher in the FPIES group. As normal TARC levels differ according to age, the age-adjusted TARC ratio was also examined and found to be elevated significantly in FPIES, but not in IgE-FA. Furthermore, age-adjusted multivariate analysis was also performed, and we found that an elevated TARC level was a significant factor in FPIES. These results suggest that TARC elevation is a disease-specific response in FPIES among FAs.
Furthermore, there were no TARC level elevations in patients with IgE-FA who also had gastrointestinal symptoms. The results of this study suggest that acute TARC measurements may be useful for differentiating FPIES from IgE-FA in situations where it is difficult to distinguish FPIES from IgE-FA, such as when there are no or only minor cutaneous symptoms. In addition, in this study, combining TARC with neutrophil count did not improve the accuracy of differentiation compared with TARC alone.
The mechanism of IgE-FA pathogenesis is the binding of food allergens to IgE antibodies on the surface of mast cells and basophils, resulting in the release of cell mediators such as histamine. 12 Contrarily, the underlying mechanism of FPIES, a non-IgE-dependent allergy, is thought to be mainly a cellular immune response. Although the underlying mechanism of FPIES is not clear, recent reports suggest that inflammatory cytokines such as tumor necrosis factor-α (TNF-α) and interleukin-2, and T helper 17 cytokines are involved. 13 TNF-α induces TARC production, 14 and TARC has been reported to be produced in the jejunum in mice with allergic diarrhea. 15 It is speculated that the aforementioned mechanisms may be involved in the TARC level elevation in FPIES. Moreover, unlike IgE-FA, the relatively low rate of AD complications in FPIES patients in this study may due to a difference in lineage compared with other allergic diseases.
There are several limitations in this study. The first is that the patients in the IgE-FA group were older than the patients in the FPIES group. The normal levels of TARC vary with age, and the difference in age between the groups may have affected the TARC levels. However, the age-adjusted TARC ratio was also higher in FPIES, and elevated TARC levels were a significant factor in FPIES in the age-adjusted multivariate analysis. These findings suggest that an elevated TARC level is a disease-specific response to FPIES among FAs.
Second, the majority of FPIES patients had egg yolk FPIES. Although the cause is unknown, it has been reported that egg-yolk FPIES, especially among solid foods, has increased rapidly in Japan in recent years, 16 and the same was true for the subjects in this study. Although there was a bias toward causative antigens, there was no difference in test values by causative antigen; therefore, the results were not considered to be affected. Third, this was a single-center study with a small number of cases. A larger multicenter study is warranted in the future for improving the statistical significance.
Conclusion
Acute phase TARC levels were higher in patients with FPIES than in patients with IgE-FA. An elevated TARC level may be a disease-specific response in FPIES among FAs. Furthermore, measurement of TARC levels in the acute phase may be useful in differentiating FPIES from IgE-FA. Further studies are expected to elucidate the immunological mechanism of FPIES.
Footnotes
Acknowledgments
Authors' Contributions
E.M. wrote the article. E.M., D.S., S.K., K.I., Y.H., and K.N. contributed to data collection and analysis. D.S. and K.I. contributed to study conception, study design, and drafting of the article. All authors have read and approved the final version of this article.
Author Disclosure Statement
No competing financial interests exist.
Funding Information
This study was supported by a grant from the Nipponham Foundation for the Future of Food.