




Abstract
Objective:
Previous reports have indicated the close association of allergy with adenoid hypertrophy (AH). The aim of this study was to evaluate whether the inflammatory cells and total immunoglobulin E (IgE) in blood could be useful in the diagnosis of allergy in AH.
Methods:
Two hundred thirty-four children who underwent adenoidectomy were retrospectively enrolled in this study. Blood routine parameters were recorded, and total IgE as well as specific IgE (sIgE) of common allergens were tested perioperatively. The diagnostic utility of blood inflammatory cells and total IgE compared with serum sIgE testing was assessed.
Results:
In our study, 35.47% of AH children were atopic. Dermatophagoides farinae (d2), Dermatophagoides pteronyssinus (d1), and mold (mx2) were the most common sensitizing allergens. Significantly elevated eosinophil count, eosinophil to lymphocyte value, and total IgE were found in allergic AH children. As a result of receiver operating characteristic analysis, systemic total IgE could be a method to diagnose allergy in AH with a cutoff value of 46.55 and higher (area under curve [AUC] = 0.837; P < 0.001). Peripheral eosinophil count and eosinophil to lymphocyte were also able to predict positive allergy test result in AH children, with a cutoff value of 0.295 (AUC = 0.721; P < 0.001) and 0.082 (AUC = 0.685; P < 0.001), respectively.
Conclusion:
The presence of allergy can be distinguished by looking at peripheral total IgE and/or blood eosinophils in AH, which will guide us to the precise treatment of AH and also reduce the cost considerably.
Introduction
Adenoid hypertrophy (AH) and allergic rhinitis are common diseases in children.1,2 Adenoid tissue localized in the upper respiratory tract are members of the Waldeyer's ring, which are physiologically natural defense barrier against microorganisms and inhaled allergens.3,4 AH may cause several comorbid conditions, including sleep apnea, chronic rhinosinusitis, and chronic serous otitis. Its typical clinical symptoms manifest as nasal congestion, runny nose, open mouth breathing, snoring, nasal overtones, and cough. 5 Many studies have suggested that the allergic response may be a risk factor of AH, and significantly higher atopy in children with AH than those without AH has been indicated.6–9 As allergy may trigger the edema of adenoid, there is a popular belief that AH patients with allergic rhinitis may show a larger adenoid tissue and more obvious symptoms than patients without allergy.
As the most common surgical procedure, adenoidectomy has several disadvantages regarding acceptance, cost, and may not be readily available in regions with limited health care resources. 10 Allergic rhinitis (AR) is suggested as a risk factor for deterioration of long-term quality of life (QoL) after adenoidectomy. 11 Nonsurgical alternatives to adenoidectomy—drug therapy approaches including topical intranasal corticosteroids and leukotriene inhibitors—have been proven effective to improve clinical symptoms of AH patients. 5 For allergic AH patients, effective anti-allergic treatment can decrease the size of adenoid tissue and reduce the chance of surgery. 7
Therefore, preoperative evaluation and proper management of atopy have clinical significance in AH children. At present, skin testing as well as in vitro testing for serum levels of specific immunoglobulin E (sIgE) antibodies are the 2 most common tests to diagnose allergy. Skin testing is rapid and inexpensive, but for children, one of its most obvious disadvantages is that children often do not tolerate multiple skin needle pricks.8,12 Allergic reaction is characterized by the infiltration of various inflammatory cells, such as neutrophils, basophils, and above all eosinophils. AR patients always showed elevated level of total immunoglobulin E (IgE). Besides, neutrophil–lymphocyte as blood inflammatory cell has been recommended as a useful marker for the diagnosis of persistent AR in adults. 13 In this study, we aimed to investigate whether the inflammatory cells in blood and total IgE would be useful in the diagnosis of allergy in AH. We hope that the result of our study may reduce the cost considerably and reduce the waste of medical resources.
Materials and Methods
Study population
Two hundred thirty-four children who underwent adenoidectomy at the Second Hospital of Shandong University from January 2019 to December 2020 were included in this study. Adenoidectomy indication was AH (patients whose cavum obstruction >70% with the flexible fiberoptic scope), obstructive sleep apnea, and/or adenoid face. Exclusion criteria include known immunodeficiency, congenital anomalies, and who had received a systemic corticosteroid within 1 month before surgery. This study was approved by the institutional review board of the Second Hospital of Shandong University. Parents of children gave written informed consent for including in the study.
Blood serum allergen test and blood routine
Serum samples were obtained from all patients at the initial visit. Total IgE and sIgE of common allergens in Shandong area including Dermatophagoides pteronyssinus (d1), Dermatophagoides farinae (d2), mx2 (Penicillium chrysogenum, Cladosporium herbarum, Aspergillus fumigatus, Candida albicans, Alternaria alternata, Setomelanomma rostrata), ex1 (cat dander, horse dander, cow dander, dog dander), wx5 (common ragweed, mugwort, marguerite, dandelion, goldenrod), tx5 (grey alder, hazel, elm, Willow, cottonwood), and fx5 (egg white, milk, fish, wheat, peanut, soya bean) in serum were measured using the ImmunoCAP system (Thermo Fisher Scientific, Inc., Waltham, MA).
A positive sIgE test result was defined as a concentration >0.35 kU/L. According to the blood serum allergen test, patients were grouped into nonsensitized group, inhaled allergen sensitized group, and food allergen sensitized group. Peripheral venous blood samples were taken before the operation and were reviewed using SYSMEX xn-9000 automatic blood analyzer. Neutrophil count, eosinophil count, basophil count, lymphocyte count, and mean platelet volume (MPV) values were recorded, and neutrophil to lymphocyte, eosinophil to lymphocyte, and basophil to lymphocyte values were calculated. Then, the parameters above were compared between any sensitized group and the nonsensitized group.
Statistical analysis
Statistical analysis was conducted using PASS15 (Power Analysis and Sample Size System) software (NCSS, LLC, Kaysville, UT), SPSS 22.0 (SPSS, Inc.), and GraphPad Prism 7.04 (GraphPad, Inc.). In our study, first, we did a presurvey, which included 50 children with AH, and 40% of these patients were atopic. Then, through the calculation of PASS, the total sample size of 234 was sufficient to allow conclusions to be drawn from this study. Descriptive analyses are presented using median (25th–75th percentile) for variables not distributed normally and means ± standard deviations for normally distributed variables. The chi-square test was used for relationship between categorical variables.
The Mann–Whitney U test was used for the pairwise comparisons between the groups. The cutoff values of total IgE, eosinophil count, and eosinophil to lymphocyte to predict allergy in AH were evaluated using the receiver operating characteristic (ROC) curve. At the same time, the sensitivity, specificity, and area under curve (AUC) were calculated, as well as accuracy, false positive rate, false negative rate, positive predictive value, and negative predictive value were calculated. A P value of <0.05 was considered statistically significant.
Results
Patients' characteristics
Two hundred thirty-four children who underwent adenoidectomy were retrospectively enrolled in the study, and 35.47% of them were atopic. There were 151 children (43 girls and 108 boys) in the nonsensitized group, 74 children (19 girls and 55 boys) in the inhaled allergen sensitized group, and 18 children (3 girls and 15 boys) in the food allergen sensitized group. As 9 participants were both inhaled allergen allergic and food allergen allergic, they were grouped in both the inhaled allergen sensitized group and the food allergen sensitized group.
The mean age of the patients was 6.08 ± 2.85, 6.34 ± 2.56, and 4.44 ± 1.34, respectively. The results did not reveal any significant differences between any 2 groups in terms of sex. The ages of children in the nonsensitized group and the inhaled allergen sensitized group are equivalent. But compared with the nonatopic group, the age of the food allergic group is younger (P = 0.0177). D. farinae (d2), D. pteronyssinus (d1), and mold (mx2) were the most common sensitizing allergens in both the inhaled allergen sensitized group and the food allergen sensitized group (Table 1).
Summary Characteristics of Study Participants
d1, Dermatophagoides pteronyssinus; d2, Dermatophagoides farinae; mx2 (mix of Penicillium chrysogenum, Cladosporium herbarum, Aspergillus fumigatus, Candida albicans, Alternaria alternata, and Setomelanomma rostrata); ex1 (mix of cat dander, horse dander, cow dander, and dog dander); wx5 (mix of common ragweed, mugwort, marguerite, dandelion, and goldenrod); tx5 (mix of grey alder, hazel, elm, willow, and cottonwood); fx5 (mix of egg white, milk, fish, wheat, peanut, and soya bean).
As 9 participants were both inhaled allergen sensitized and food allergen sensitized, they were grouped in both the inhaled allergen sensitized group and the food allergen sensitized group.
Compared with the nonsensitized group, the age of the food allergen sensitized group is younger (P = 0.018).
SD, standard deviation.
Significantly higher eosinophil count, eosinophil to lymphocyte value, and total IgE were found in the atopic group
Significant elevated eosinophil count of peripheral blood in the inhaled allergen sensitized group and in the food allergen sensitized group was found compared with the nonsensitized group (P < 0.001 and P < 0.001, respectively). Similarly, eosinophil to lymphocyte in peripheral blood as wells as serum total IgE were significantly elevated in both the inhaled allergen sensitized group and the food allergen sensitized group compared with the nonsensitized group (P < 0.001 and P = 0.003, P < 0.001 and P < 0.001, respectively). Moreover, basophil count of peripheral blood in the food allergen sensitized group was found higher than that in the nonsensitized group (P = 0.001). No significant differences were found among groups of the other indicators, including neutrophil count, lymphocyte count, MPV, neutrophil to lymphocyte value, and basophil to lymphocyte value (Fig. 1).
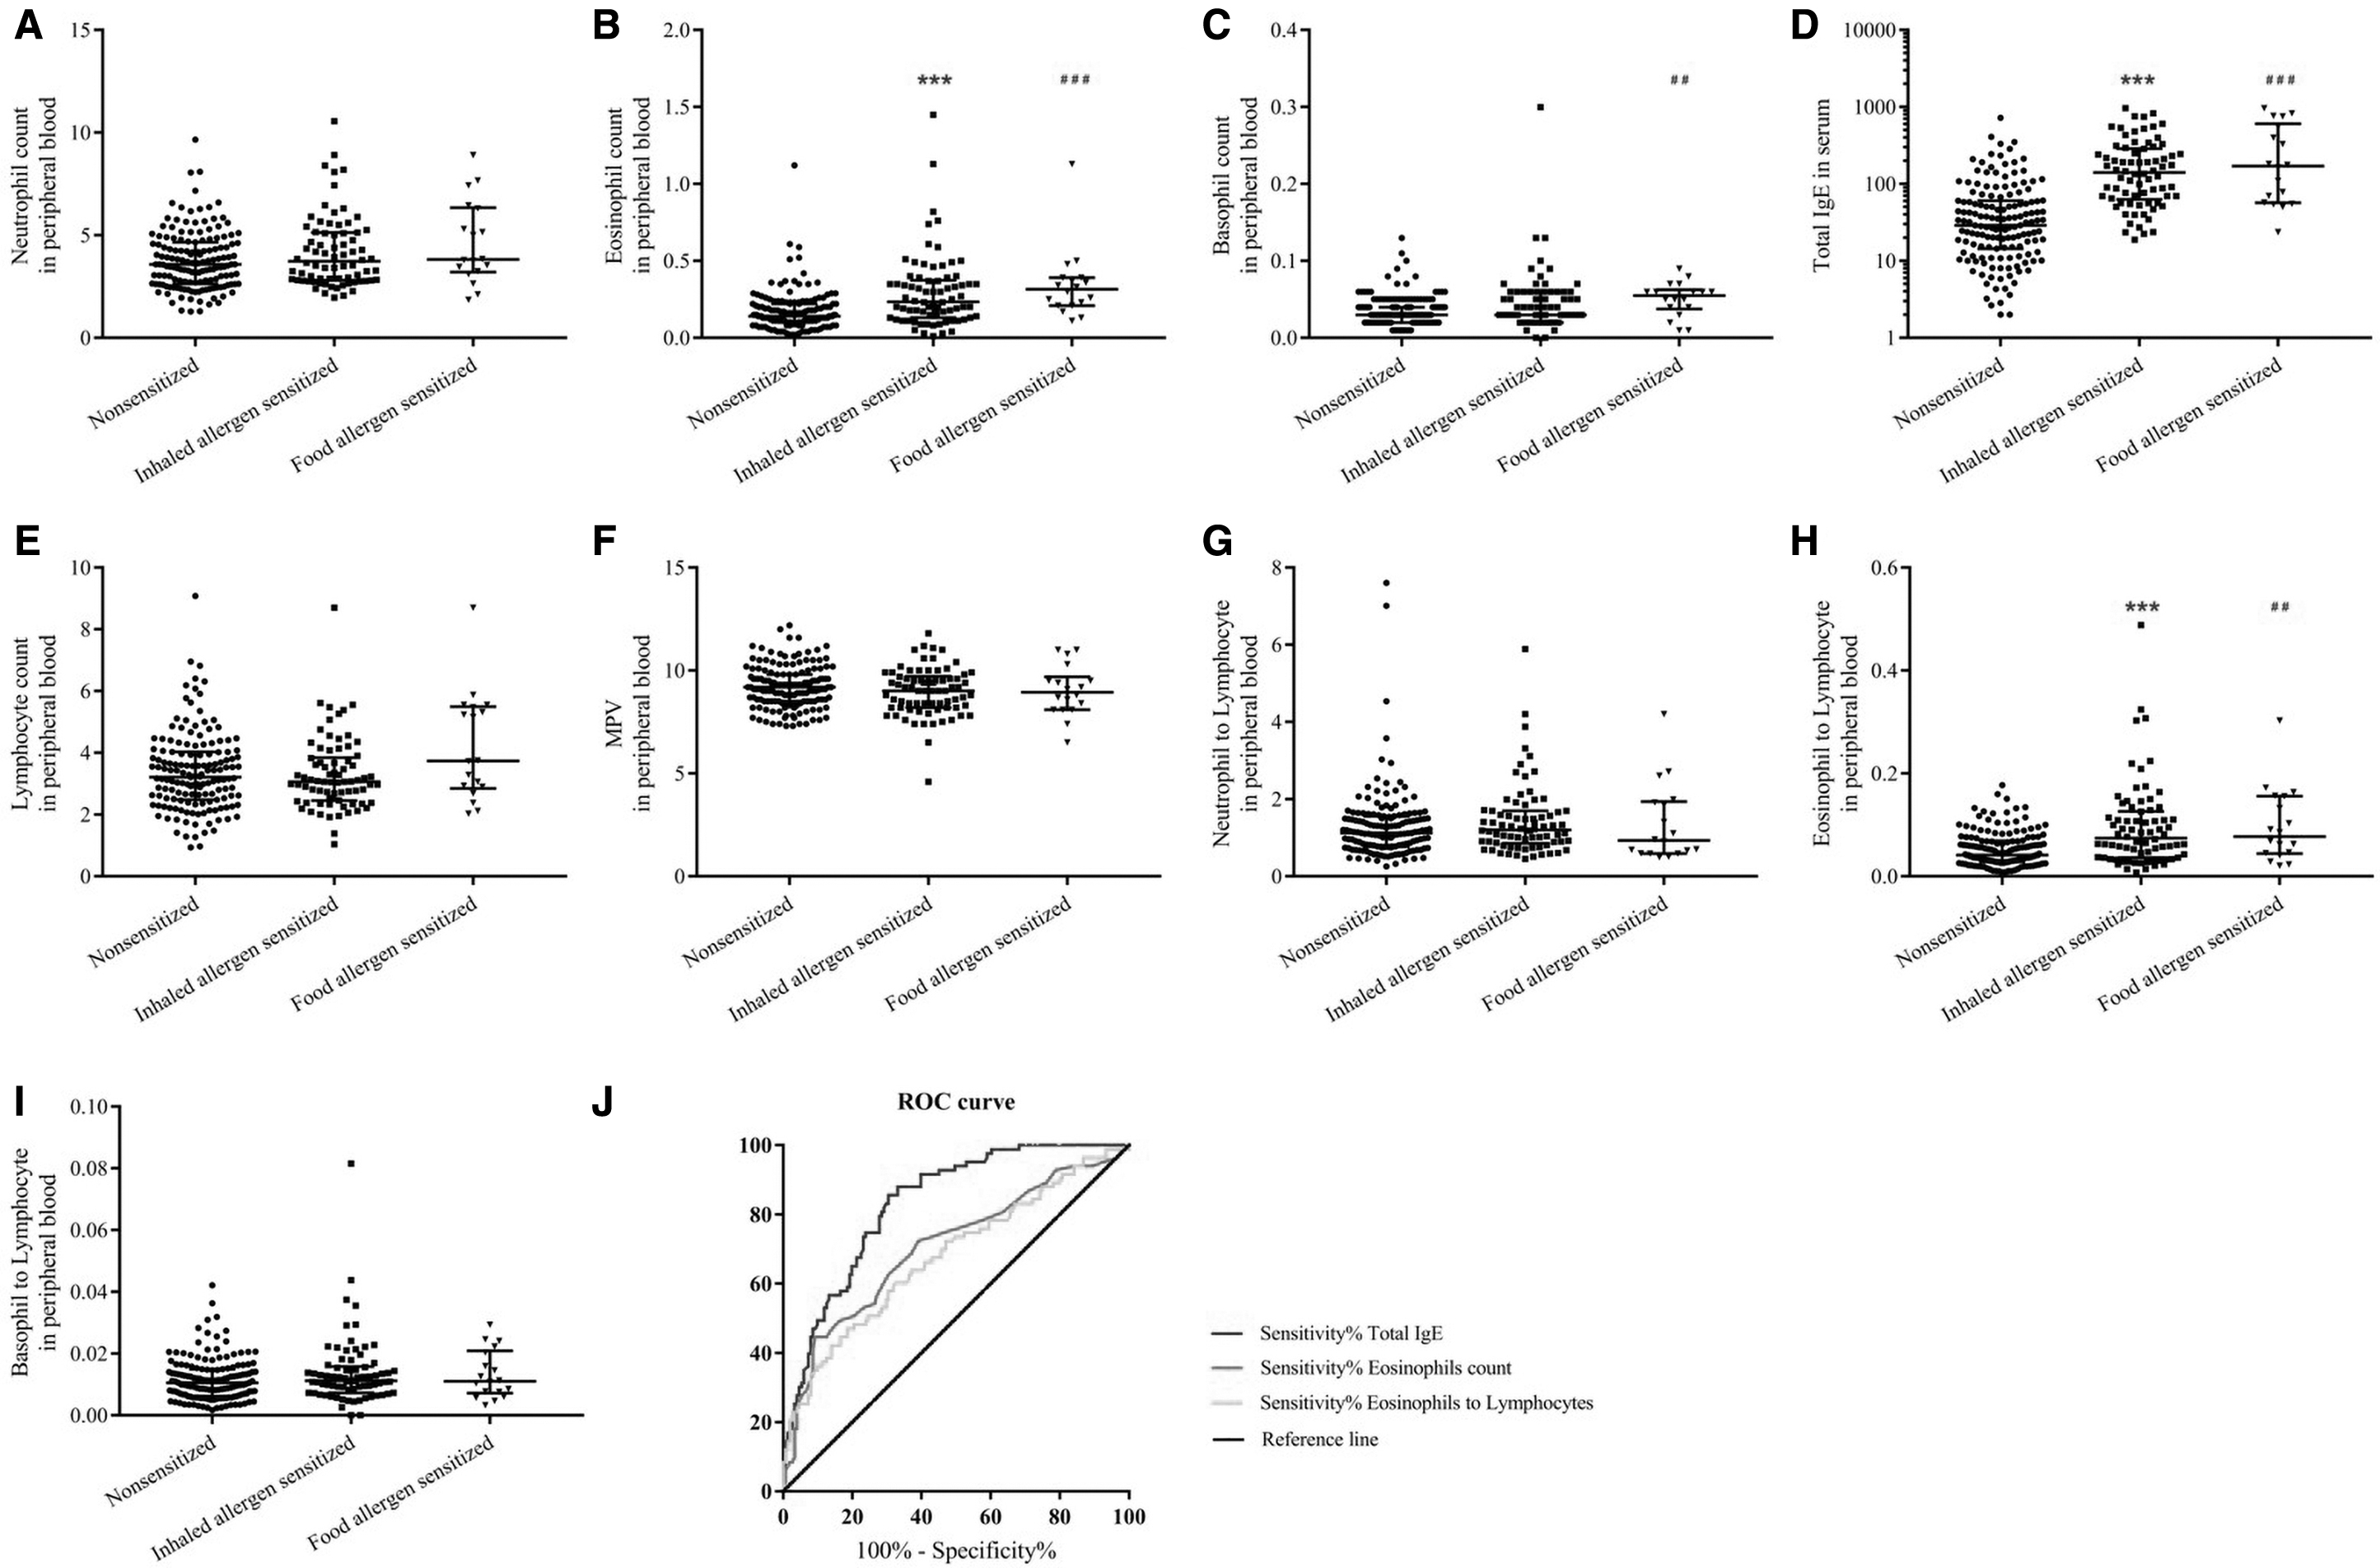
Serum total IgE and blood routine parameters in the inhaled allergen sensitized group and the food allergen sensitized group were compared with the nonsensitized group:
Total IgE, eosinophil count, and eosinophil to lymphocyte value were able to predict atopy in AH children
Then, ROC curves were created to assess the performance of total IgE, eosinophil count, and eosinophil to lymphocyte value to predict allergy in AH. The cutoff point was calculated based on the maximal Youden index (sensitivity + specificity −1). The ROC curve defined an excellent overall accuracy for total IgE in serum to predict a positive serum sIgE result with a cutoff value of 46.55 and higher (AUC = 0.837 [95% confidence interval, CI: 0.788–0.886]; P < 0.001; sensitivity: 0.88; specificity: 0.669) and the accuracy, false positive rate, false negative rate, positive predictive value, and negative predictive value were 74.9%, 33.1%, 11.9%, 61.8%, and 90.2%, respectively.
The eosinophil count was able to predict positive allergy test result in AH children, with a cutoff value of 0.295 and higher in peripheral blood (AUC = 0.721 [95% CI: 0.652–0.789]; P < 0.001; sensitivity: 0.467; specificity: 0.907) and the accuracy, false positive rate, false negative rate, positive predictive value, and negative predictive value were 74.0%, 9.3%, 53.3%, 75.4%, and 73.7%, respectively. The eosinophil to lymphocyte in peripheral blood was also able to predict atopy in AH children, with a cutoff value of 0.082 and higher in peripheral blood (AUC = 0.685 [95% CI: 0.614–0.756]; P < 0.001; sensitivity: 0.489; specificity: 0.815) and the accuracy, false positive rate, false negative rate, positive predictive value, and negative predictive value were 69.1%, 18.5%, 51.1%, 61.6%, and 72.4%, respectively (Fig. 1 and Table 2). Combined any 2 of total IgE, eosinophils count, and eosinophil to lymphocyte value, or 3 of them showed larger AUC areas (Table 2).
The AUC, P Value, Cutoff Value, and 95% Confidence Interval of the Inflammatory Cells in Blood and Total Immunoglobulin E Estimated for Allergy in Adenoid Hypertrophy
AUC, area under curve; CI, confidence interval; IgE, immunoglobulin E.
Discussion
Although the relationship between the etiology of allergy and AH has not been investigated sufficiently, the close relationship between AH and allergy has been concluded in several studies.2,5,6,11,14–16 Significantly elevated atopy was found in children with AH than those without AH. 17 AH frequency is higher in children with allergic disease compared with controls. 9 Modrzyński et al reported that most children who were hypersensitive to tree pollens had a significant decrease in nasopharyngeal cavity volume as soon as the birch pollen season started. 18 In our study, 35.47% of AH children showed systemic allergy, and D. farinae (d2), D. pteronyssinus (d1), and mold (mx2) were the most common sensitizing allergens, which is similar to most of reports.5,7,8
For children whose QoL was significantly affected by AH, medical interventions were needed. Adenoidectomy surgery and drug therapy are the 2 clinically considered treatment options. The former could provide long-lasting improvement clinical symptoms but is invasive and relatively expensive. The latter is often cheaper but may symptomatic relapse. 19 Pang et al found that effective anti-allergic treatment can improve the nasopharyngeal cavity volume and reduce the surgery chance of the mold allergic AH patients. 7 But, however, the adenoidectomy surgery may increase allergen exposure of the lower respiratory mucosa and thus may induce allergic bronchial disease. Interestingly, a survey in Turkey shows that adenoidectomy and/or tonsillectomy in childhood increase the risk of asthma in adulthood, whereas it does not increase the risk of atopy. 20 Besides, AR was found to be a risk factor of deteriorating QoL after adenoid surgery. 11 Therefore, identifying atopy or not is essential to constitute the treatment plan of AH.
To date, few studies with the defined aim to calculate the diagnosis role and reliable cutoff values of conventional laboratory variables were able to pinpoint patients at higher risk of AR in AH. Allergy diagnosis tools including nasal challenges, blood basophil, histamine release measurement, and eosinophils in nasal smears are primarily utilized for research purposes and limitedly used. 8 Skin prick and serum sIgE tests also have limitations such as high false negative result and limited allergen panel, respectively.
Yucel Ekici et al 8 found that the examination of the routine hematoxylin–eosin-stained adenotonsillar specimen for eosinophilia may guide the diagnosis and treatment of allergic rhinitis in AH but obtaining adenoid or tonsil tissues is invasive. Total IgE test is a widely used and economical examination. Although it is widely believed that high serum total IgE value can be affected by various causes including parasitic disease and has the disadvantage of yielding a false positive result in the diagnose of allergic disease, 8 in this study, we found its excellent overall accuracy to predict positive serum sIgE result (cutoff value: 46.55, AUC = 0.837, P < 0.001).
It is known that eosinophil and basophil are the major effector cells in allergic inflammation; no studies examined whether the presence of sensitization can be distinguished by looking at the blood inflammatory cells in AH. In nasal polyposis, eosinophil/lymphocyte ratio was found to be related to disease severity, 21 and blood eosinophil values were dropped significantly from before to after the surgical procedure. 22 In a recent survey, the pathological mechanism of allergic AH in children can be involved with predominant tissue eosinophilia, and Th2 inflammation was elucidated. 23 Both neutrophil–lymphocyte and platelet–lymphocyte ratios were recommended as useful markers for diagnosis of persistent AR. 13
Although neutrophil–lymphocyte were found significantly higher in adult AR patients in previous study, 13 we found no statistical differences between allergic and nonallergic AH children. In our study, of the blood routine parameters, only eosinophil count and eosinophil to lymphocyte value were found to be significantly elevated in the atopic AH group, and peripheral basophil count in the food allergen sensitized group was found higher than that in the nonsensitized group. ROC curves showed that eosinophil count and eosinophil to lymphocyte in peripheral blood had potential role in determining whether the AH patient is allergic or not (cutoff value: 0.721, AUC = 0.721, P < 0.001; cutoff value: 0.082, AUC = 0.685, P < 0.001), but they showed smaller AUC areas than total IgE. Combined any 2 or 3 of total IgE, eosinophils count, and eosinophil to lymphocyte values showed elevated but very limited AUC areas.
This study had several limitations. First, as a retrospective study, patients without AH of similar age in the same period were not taken into account. Second, as serum sIgE test was less sensitive than skin testing, skin prick was not tested at the same time. Nevertheless, we do not know exactly whether this is a useful parameter to use in the follow-up of the disease severity, it needs further studies. The strength of our study was the large sample size.
Conclusion
Significant elevated eosinophil count, eosinophil to lymphocyte value, and total IgE were found in allergic AH children than in nonallergic AH patients. In patients with AH, total IgE can be used in the diagnosis and determination of atopy, as well as eosinophil count and eosinophil to lymphocyte in blood. As total IgE test and blood routine are very easy and fast examination, these results are very beneficial for AH patients and may reduce the waste of medical resources and the cost considerably. Our study should be supported by additional studies in a prospective study of a larger patient population.
Ethical Approval
Approval for this study was obtained from the institutional review boards of the Second Hospital of Shandong University.
Footnotes
Authors' Contributions
Ha.Z. and Ho.Z. wrote the article. Ha.Z., Y.S., C.S., P.J., W.Y., Q.Z., F.Z., and Ho.Z. contributed to data collection and analysis. Ha.Z., Y.S., C.S., and Ho.Z. contributed to study conception, study design, and drafting of the article. All authors have read and approved the final version of this article.
Author Disclosure Statement
No competing financial interests exist.
Funding Information
This research was supported by the National Natural Science Foundation of China (81800885) and the Natural Science Foundation of Shandong Province (ZR2018PH021).