
Abstract
Introduction
Diode-pumped solid state (DPSS) lasers are solid state lasers made by pumping a solid medium with a laser diode. These lasers have advantages over other types of lasers in compactness, price, and efficiency. The DPSS laser, emitting light at 532 nm, is used as a light source for the excitation of phycoerythrins (PEs) in commercial flow cytometers. 10,11 In addition, an 808-nm DPSS laser is used widely for low-level laser light (LLLT) treatments. 12 –14 However, despite the many scientific applications in medicine and dentistry, the possibility of using the DPSS laser in the polymerization of light-curing dental composite resins as a replacement for the argon laser has been tested recently. 15 The aim of this study was to test the effectiveness of the 473-nm DPSS laser as a light-curing source on the polymerization of dental nanocomposite resins. Its effectiveness was determined by evaluating the degree of polymerization. For this, microhardness, maximum polymerization shrinkage, and increase in temperature during and after the light curing were performed.
Materials and Methods
Composite resins and light-curing units
Three different nanocomposite resins (Ceram X, Filtek Supreme, and Grandio) of shade M5/A3 were chosen for the study. Table 1 lists the characteristics of the nanocomposite resins. A DPSS laser (LAS) (LVI Technology, Seoul, Korea) with an emission wavelength of 473 nm was used for light irradiation. This laser system operates in the continuous mode and is not a commercialized light-curing unit. The output power and the diameter of spot size of the DPSS laser beam were approximately 180 mW and 6 mm, respectively. The raw beam was expanded to 6 mm using a beam expander and was irradiated to the specimens without fiber optic assistance. The resulting light intensity was approximately 640 mW/cm2. For comparison, three different light-curing units (L.E. Demetron 1 (DE), Optilux 501 (OP), and Apollo 95E (PLA)) were used. Table 2 lists the light-curing systems. The emission spectrum of the light-curing systems (Fig. 1) was measured using a photodiode array detector (M1420, EG&G PARC, Princeton, NJ) connected to a spectrometer (SpectroPro-500, Acton Research, Acton, MA). To measure the absorption spectrum of CQ, the photoinitiator, the CQ powder was melted in the ethanol. The output light intensity of the DE and OP was 1000 mW/cm2, as measured using a radiometer, which was internally set in the OP. For PLA, it was approximately 1600 mW/cm2.
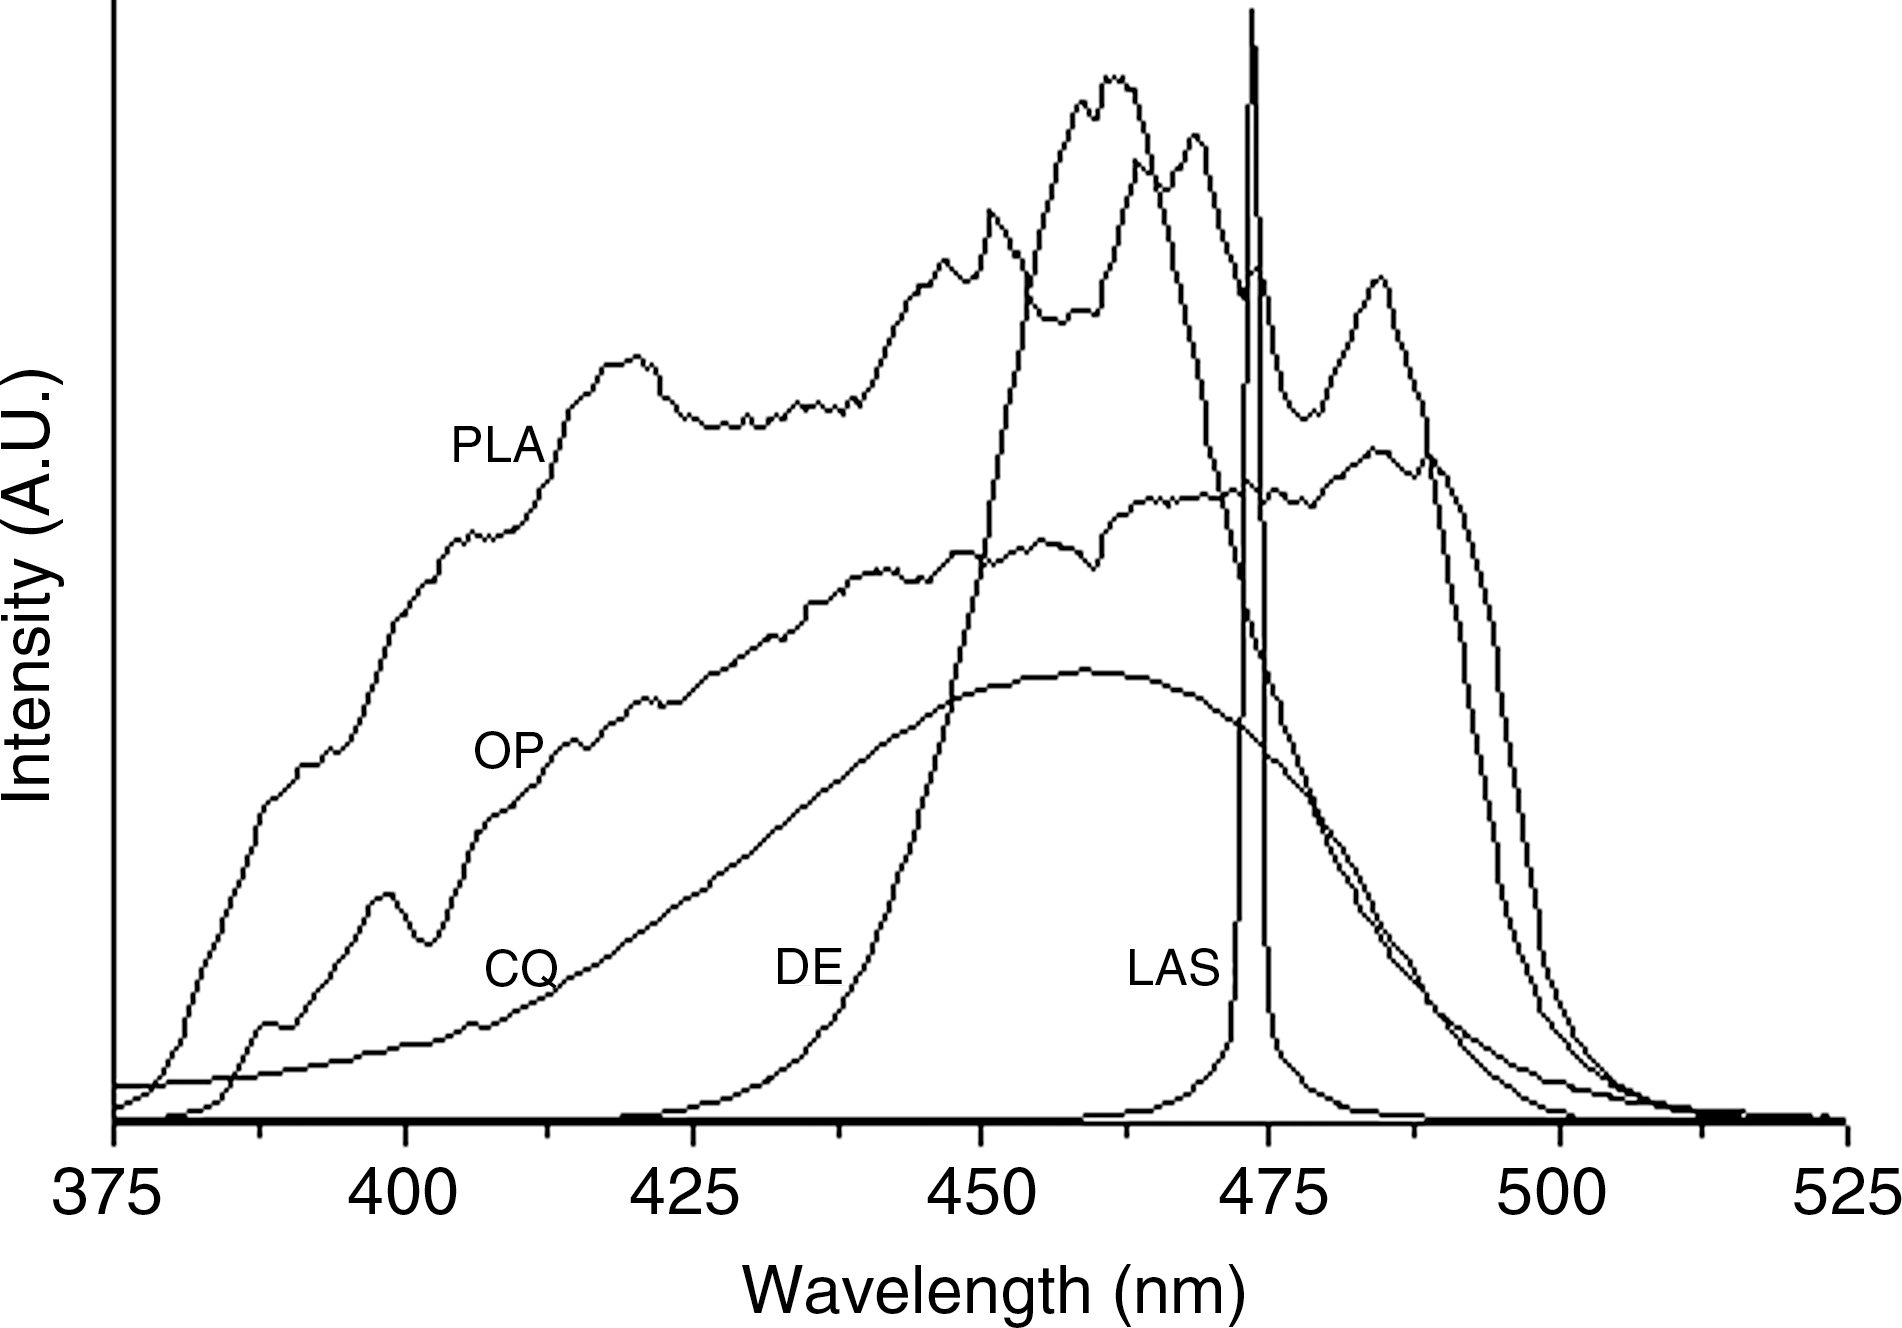
The emission spectra of light-curing units used and the absorption spectrum of camphorquinone. (Absorption spectrum, camphorquinone; Emission spectrum, L.E. Demetron 1, 473-nm diode-pumped solid state laser, Optilux 501, and Apollo 95E).
CX: Ceram X, FS: Filtek Supreme, GD: Grandio.
according to the manufacturer.
Microhardness measurement
The surface microhardness of the specimens was measured by filling a cylindrical ring mold (3 mm in height with an inner diameter of 7 mm) with resin, followed by light curing for 40 s (except for PLA, which was for 3 s) at the light intensities described above. At this time, the end of the light guide was placed in contact with the top surface of the specimen. The light-cured specimen was then removed from the mold and aged for 24 h at 37°C in a dark chamber for the measurements. The microhardness of the top (z = 0 mm) and bottom (z = 3 mm) surfaces was measured using a Vickers hardness tester (MVK-H1, Akashi Co., Tokyo, Japan). Microindentation (n = 12 for each test condition) was performed using a 200-gf load and a 10-s dwell time.
Polymerization shrinkage measurement
The polymerization shrinkage (n = 5 for each test condition) during the light-curing process was measured using a linometer (RB 404, R&B Inc., Daejon, Korea). This system consists of a specimen holder, a curing light, a shrinkage sensing part, software, and a computer. The resin was located between the covering slide glass and aluminum disc on the specimen holder. A metal mold (2 mm thick with an inner diameter of 4 mm) was placed over the aluminum disc and filled with resin. After being completely filled with resin, the metal mold was removed. A slide glass was then secured over the resin. The end of the light guide was placed in contact with the top surface of the slide glass. Before light curing, the initial position of the aluminum disc was set to 0. The resin was irradiated for 40 s (except for PLA, which was for 3 s) at the light intensities described above. As the resin polymerized, it shrank toward the light source, and the aluminum disc under the resin then moved toward the light source. The amount of disc displacement that had occurred because of polymerization shrinkage was measured automatically for 130 s using a noncontacting inductive gauge. The shrinkage sensor used in this study was a noncontact type, and the resolution was 0.1 μm with a 100-μm measuring range.
Temperature rise measurement
The temperature rise of the specimens was measured (n = 5 for each test condition). A Teflon ring mold (height, 2 mm; inner diameter, 4 mm; outer diameter, 15 mm) was filled with resin, and the bottom of the ring mold was covered with a transparent glass slide (thickness: 200 μm). The end of a thermocouple (T-type, OMEGA Engineering Inc., Stamford, CT) was placed at the center of the top surface of the filled resin after pasting it with a thermally conducting paste (OMEGATHERM 201, OMEGA Engineering Inc.). This paste improves the level of heat transfer and expands the heat-path area from the surface to the thermocouple, increasing the speed of the response and improving the accuracy. The thermocouple was then fixed to the top surface of the specimen. The curing light was irradiated from the bottom surface to the top surface under the same light-curing conditions. The first temperature increase was measured over a 150-s period. Additional irradiation was performed for 60 s to ensure more-complete curing. A second temperature measurement was then performed during a third irradiation step of 40 s at the same light intensity. The data were recorded using an analog to digital (AD) conversion board and a personal computer (PC) at a sampling rate of 4 Hz. The measurements were repeated five times, and the resin was replaced for every test. The minimum thermocouple resolution was 0.1°C, and the accuracy under 100°C was 0.6°C.
Statistical analysis
The data for the microhardness, maximum polymerization shrinkage, and increase in temperature rise due to the exothermic heat generation in the specimens during the light curing were analyzed using a two-way analysis of variance at the 95% confidence level. A Tukey's test was then used for multiple comparison if necessary.
Results
Figure 1 shows the emission spectra of the light-curing systems used in this study and the absorption spectrum of the photoinitiator, CQ, included in the tested nanocomposite resins. A comparison of the absorption spectrum of CQ revealed OP and PLA to have the widest spectral match. DE showed a much narrower match, but the coincidence mainly occurred in the absorption peak of CQ. LAS showed the narrowest emission bandwidth, and its emission peak was positioned slightly separate from the absorption peak of CQ.
Table 3 shows the microhardness of the top and bottom surfaces of the specimens light cured using the different light-curing systems. Of the specimens and light-curing systems tested, Grandio and PLA showed the highest microhardness and yielded the softest specimens on the top and bottom surfaces. In the case of PLA, bottom surface was so soft that a reliable microhardness measurement was not possible. With the exception of the specimens light cured with PLA, the specimens light cured with the remaining three light-curing systems showed a statistically similar microhardness in the same resin product (p < 0.05).
Statistically significant difference on nanocomposite resins is shown by superscript lettersA,B,C, on light-curing systems by superscript numbers1,2. Same letters or numbers are not significantly different (p < 0.05).
On p-values, the letters α, β, α*β and denote nanocomposite resin, the light-curing system, and interaction of two factors, respectively.
Table 4 shows the maximum polymerization shrinkage value during light curing. Grandio showed slightly less polymerization shrinkage (13.1–16.8 μm) than the remaining specimens (14.0–19.1 μm), regardless of the light-curing systems used. All light-curing systems except for PLA showed similar shrinkage values in the same resin product (p < 0.05).
Statistically significant difference on nanocomposite resins is shown by superscript lettersA, B, C, on light-curing systems by superscript numbers1,2. Same letters or numbers are not significantly different (p < 0.05).
On p-values, the letters α, β, and α*β denote nanocomposite resin, the light-curing system, and interaction of two factors, respectively.
Tables 5 and 6 show the maximum temperature reached in specimens during the first and third light curing and the estimated increase in temperature due to exothermic heat generation (maximum temperature during the first light curing – maximum temperature during the third light curing) in the specimens during the light curing. The maximum temperature reached in the specimens during the first and third light curing by DE and OP was higher than normal body temperature, and maximum temperature reached by LAS and PLA was lower than normal body temperature (with the exception of Ceram X and PLA) and lower than DE and OP. The estimated increase in temperature due to exothermic heat generation in the specimens differed according to the light-curing system. DE and OP induced a statistically similar increase in temperature (1.5–1.9 vs. 1.6–1.9°C) (p < 0.05). On the other hand, LAS and PLA induced a much higher increase in temperature than DE (2.7–4.0°C) and OP (6.1∼8.5°C).
The values in the parenthesis represent the initial temperature during the measurement.
Statistically significant difference on nanocomposite resins is shown by superscript lettersA,B, on light-curing systems by superscript numbers1,2,3. Same letters or numbers are not significantly different (p < 0.05).
On p-values, the letters α, β, and α*β denote nanocomposite resin, the light-curing system, and interaction of two factors, respectively.
Discussion
Measurement of the microhardness using a hardness tester is a common way of evaluating the degree of polymerization of dental composite resins in addition to a way of the evaluating of the degree of monomeric C = C bond conversion to polymeric C-C bonds using Fourier transform infrared. Generally, greater conversion results in higher surface hardness and wear resistance, as well as better fracture resistance. 16 –18 However, the mechanical properties depend on the polymer network formation, which is not equivalent to conversion. Because polymers with similar conversion rates might have different crosslinking densities, conversion alone may not be a good predictor of the resulting mechanical properties. 6,7 Light intensity, emission spectrum, and curing time are important parameters for the effect of the external light source on the microhardness of the specimens because they are related to the number of the emitted photons and their energy, as well as the coincidence with the absorption spectrum of the photoinitiator. Of the units used, PLA showed the highest (∼1600 mW/cm2) and LAS the lowest (640 mW/cm2) light intensity. The ratio of the light intensity between the units was approximately 1:0.6:0.6:0.4 (1.6:1:1:0.6) for PLA:DE:OP:LAS. Regarding the emission spectrum, PLA and OP showed the widest overlap with the absorption spectrum of CQ and LAS the lowest. The curing time was fixed to 40 s. Despite the difference in light intensity and emission spectrum, the microhardness values of the specimens on the top surface were similar in all specimens except for PLA. This means that LAS can polymerize dental composite resins even with a much lower light intensity and narrower emission band than the other units. The much lower microhardness values in the specimens light cured with PLA was attributed to the short curing time. These significantly lower microhardness values are unsurprising because the resulting energy density with PLA was much lower than the others (∼4.8:40:40:26 J/cm2 for PLA:DE:OP:LAS). Similar microhardness values in the specimens light cured with LAS even with the lowest energy density would be due partly to the temporal and spatial coherence of the incident light. Because DE and OP had much lower coherence than LAS, the degree of polymerization by DE and OP can be lower even with a higher-energy density.
Polymerization shrinkage occurs when the molecular spacing of the monomers is reduced while they are converted to a polymer by forming a network. Significantly lower maximum polymerization shrinkage in the specimens light cured with PLA might be due to the much shorter curing time than that of the other units (3 vs 40 s). For such a short time, photons cannot be fully supplied to activate sufficient numbers of CQ molecules within the specimen. The similar polymerization shrinkage in the specimens by LAS and those of DE and OP even with the lower light intensity is unsurprising because a light intensity of 400 mW/cm2 for 40 s is enough to polymerize 2-mm-thick specimens. 19 This suggests that the number of photons arriving per second is comparable with the number of CQ molecules in the corresponding area or volume of the material. 20
The increase in temperature in the specimens occurs first through an exothermic reaction during polymerization and second from the heat generated from the light guide and the light-curing unit itself. The heat generated from the light-curing unit originated from the bulb or LED unit, even though the internal cooling system cooled these heat-generating parts. Such heat can be minimized by adjusting the distance between the light-curing system and specimen. However, in this case, the diffused (diverged) incident light can reduce the resulting light intensity significantly if the distance increases. In this study, the increase in temperature from an exothermic reaction can be evaluated by eliminating the increase in temperature from the light-curing unit. The increase in temperature during the first light curing was attributed to the exothermic reaction and the heat from the light-curing unit. To ensure more-complete polymerization, a second light curing step was performed without measurement. During the third light-curing step, a second temperature measurement was performed. At this time, the increase in temperature would mainly be due to the light-curing unit. The increase in temperature due to the exothermic reaction can be obtained by subtracting the temperatures measured during the first and second measurements. According to the measured data, the DE- and OP-induced maximum temperatures (38.0–41.6°C) in the specimens were greater than normal body temperature during the first and second measurements. These values may vary because temperature reached depends on the volume of the specimen, but such a high temperature might not good for the tooth. An increase in temperature of more than 5°C from body temperature in the equilibrium state can cause dental pulp to overheat and undergo necrosis. 21,22 However, the temperatures reached by LAS and PLA were lower than those obtained from the other units, probably due to the lower light intensity (LAS) and much shorter curing time (PLA) than those of the other units (Table 5). In Table 6, higerh temperature rise from exothermic reaction in Ceram X than the rest products is not clear, but it may be due to the difference of their monomer content and composition. The high temperature rise by LAS during the exothermic reaction is attributable to the coherence of the LAS, and the highest temperature rise by PLA is attributable to the highest light intensity.
Conclusion
The specimens cured by LAS showed similar microhardness and maximum polymerization shrinkage but much lower maximum temperate reached during the light curing even with lower light intensity than the values obtained using quartz-tungsten-halogen and LED light-curing units. The specimens light cured using the PLA showed a lower degree of polymerization because of the insufficient light-curing time. These results highlight the potential use of LAS as a light-curing unit for the polymerization of composite resins, but further experiments under much lower light intensities and shorter curing times will be needed to confirm these results and examine its potential as a light-curing unit.
Footnotes
Disclosure Statement
No competing financial interests exist.