




Abstract
Introduction
The contemporary tooth bleaching technique is based primarily on the oxidation by hydrogen peroxide or one of its precursors, and those are often used in combination with an activating agent such as heat or light. 4,5 To accelerate the bleaching process, the bleaching agent can also be heat activated. This idea of power bleaching dates back to 1918, when Abbot reported the use of high-intensity light to increase the temperature of hydrogen peroxide. Application of heat, light, or lasers is used to increase the temperature of a bleaching agent applied to the tooth surface. 6
Tooth color is currently measured using a wide range of measurement methods divided into subjective (visual) and objective (instrumental) assessment. 7 Instrumental measurement devices, such as reflectance spectrophotometers, colorimeters, and digital image analysis systems, including quantitative light-induced fluorescence (QLF), represent a supplementary adjunct to visual tooth color evaluation. The main difference between them is that spectrophotometers measure the reflectance of light within the entire visible spectrum, whereas colorimeters evaluate the reflected light only through three wavelengths: red, green, and blue. 8
Many researchers have molecularly evaluated the effects of bleaching agents on teeth, in terms of chemical modifications. 9 –12 However, some studies use laboratory products, and others use prototype products. 9 –12 As an alternative measurement technique, Raman spectroscopy is increasingly being recognized as a significant analytical method for biomedical applications. Raman spectroscopy data contain a significant amount of important information regarding the composition and structure of materials at the molecular level.
The analysis of the Raman spectrum of dental tissues can provide information about the relative concentration of the phosphate and carbonate groups associated with the hydroxyapatite molecule. 13,14 The vibration modes of PO4 3−, CO3 2−, and OH− groups can be studied using Raman spectroscopy. The frequency and band shape of the most prominent ν1 PO4 3− depend on the local mineral environment and therefore change with ionic incorporation and crystallinity. Meanwhile, the intensity of ν1 PO4 3− is linearly proportional to phosphate group concentration within the hydroxyapatite molecule, and it thus can be used to analyze changes in the phosphate group concentration. 14 Therefore, analysis of the concentration of phosphate within the enamel is a good indicator of the degree of mineralization. 13,14
To the best of our knowledge, analytical studies at the molecular level to evaluate the chemical effects of hydrogen peroxide bleaching on enamel components associated with reflectance analysis have not been performed. Therefore, the objectives of this study were to assess the effects of bleaching with commercial products activated using a light-emitting diode (LED) –lLaser system on the chemistry and color of enamel before and after treatment, as evaluated using Fourier transform (FT)-Raman and reflectance spectroscopy, respectively.
Materials and Methods
Sample preparation
The Ethics Committee of the University of Vale do Paraíba approved this study (A006/2006/CEP). Twenty bovine teeth were used. All teeth were from animals of the same age and lot and that had received the same feed. After extraction, teeth were cleaned and stored in an aqueous solution of 0.1% thymol for 24 h. They were then submitted to manual debridement with a periodontal curette to remove organic debris and polishing with a pumice stone paste (S.S. White, Rio de Janeiro, RJ, Brazil) and water using a Robinson brush (Viking-KG Sorensen, Barueri, SP, Brazil) and a low-speed handpiece (KaVo do Brasil SA, Joinville, SC, Brazil).
The crown was separated from the root using a cervical–apical cut and longitudinally sectioned into two portions, resulting in 40 blocks. These fragments had their enamel and dentine area reduced to 4.0 × 4.0 with a thickness of 4.0 mm using a diamond saw (Isomet 1000-BUEHLER, Lake Bluff, IL). The prepared samples were kept at 100% relative humidity at 37°C in a culture kiln (502–1, FANEM, São Paulo, SP, Brazil) and stored in artificial saliva during bleaching treatment. The specimens were divided at random into four groups containing 10 samples per group. We used four bleaching gels based on 35% hydrogen peroxide: G1 - Whiteness HP (FGM, Joinville, SC, Brazil), G2 - Whiteness HP MAXX (FGM, Joinville, SC, Brazil), G3 - Whiteform – Perox Red Form gel (Fórmula & Ação, São Paulo, SP, Brazil), and G4 - Opalescence Xtra gel (Ultradent, South Jordan, UT) (Table 1).
Bleaching protocol
Each group was treated with the appropriate whitening gel in accordance with the manufacturer's instructions. The whitening gel was applied as a 0.5–mL-thick layer with a syringe on the enamel of each block. This procedure was referred to initial application. The gel was first placed onto the sample and light activated with an LED/LASER Brightness System (Kondortech Equipamentos Odontológicos Ltda, São Carlos, SP, Brazil). The LED/laser system features used were as follows: a power of 240 mW (LED, 70 mW; diode laser, 170 mW), a power density of 5.4 mW/mm2, an LED wavelength of 465.5 nm, a laser wavelength of 790 nm, and a spot size of 7.5 mm. The gel was photoactivated for 30 s for a total of 10 min of application for each sample. The gel was then removed, and the sample was washed with distilled water. This procedure was then repeated twice more. During and after treatment, each sample was stored in the culture kiln at 37°C in 5 mL of artificial saliva that was changed daily. One liter of artificial saliva was prepared and contained 1.5 mmol/L Ca(NO3)2·4H2O, 0.9 mmol/L NaH2PO4·2H2O, 150 mmol/L KCl, 0.1 mol/L Tris buffer, 0.003 ppm F, pH 7.0, 20 ml/block. 15,16
The bleaching sessions were then performed in the groups as previously described, with a 72-h interval between sessions.
Reflectance analysis
The bovine dental blocks were analyzed using reflectance spectroscopy to evaluate changes in enamel and dentine photoreflectance. Enamel sample spectra were obtained before and after the bleaching procedure. The reflectance system consisted of one spectrometer (Model 77702, Oriel Instruments, Stratford, CT), one Teflon integrating sphere, one fiber-coupled halogen light delivering 4 mW of power at the fiber tip as a source of white light (Model 150 Illuminator, Ram Optical Instrumentation, Chicago, IL), two 600-μm-diameter optical fibers for excitation and signal collection, and one computer for data acquisition.
Before the first spectrum was captured, the system was calibrated using a helium–neon (He—Ne) laser (632.8 nm, 594 nm) associated with a mercury lamp (435.8 nm, 546.1 nm, 576.9 nm, and 579 nm). To minimize measurement errors from any instrumental instability, the background signal and the signal from the reference were collected using a white diffuser (Teflon) before the measurements and every 10 min, to account for long-term instrumental drift.
The number of signal accumulations was standardized at 100, and the exposure time was set to 500 ms (0.5 s). Once the spectrometer was set to work in the reflectance mode, each sample spectrum was automatically compared with the reference to give the sample reflectance spectrum. All spectral measurements were background-corrected. The diffuse reflectance spectrum was recorded in the 400- to 700-nm spectral range. Microcal Origin (Microcal Software, Inc., Northampton, MA) software was used for spectral data processing, and the areas under the curves were calculated. The area under the curves gives a relative measure of the amount of light returned from the sample, so the larger the area under the reflectance curve, the larger is the reflection of light by the sample. 17 –21
FT-Raman spectroscopy
The molecular measurements were made on a FT-Raman Spectrometer RFS 100 (Bruker Optics Inc., Karlsruhe, Germany). The enamel surface was analyzed before and after the bleaching treatment. Because Raman spectra were taken from all specimens before treatment, they each served as their own negative control. The excitation laser was a neodymium-doped yttrium aluminium garnet laser operating at a wavelength of 1064.1 nm. Laser power output was maintained at 100 mW after checking that samples did not photodecompose. A liquid-cooled germanium detector recorded the Raman spectra. The specimens were examined on a sampling plate fixed using double-sided adhesive tape perpendicular to the laser beam. One measurement was made on the middle enamel surface with a 1-mm2 scanning area and an approximately 3-min integration time at room temperature. 22 Specimen spectra were obtained by accumulating 100 scans with spectral resolution of 4/cm. 14 Altogether, 80 spectra were obtained. The lower limit of laser penetration depth of our Raman experiments was approximately 500 μm.
Data manipulation
To verify intraspecimen variation, FT-Raman spectra were recorded in three different regions in two specimens of each group. The observed spectral patterns were exactly the same, and there were no differences after spectra intensity analysis application. Thereafter, it was established that obtaining one measurement for each specimen was acceptable.
OPUS software (version 4.2, Bruker Optics GmHb, Billerica, MA) was the dedicated software used for data acquisition. Postprocessing analysis for the qualitative and semiquantitative spectral analysis was performed. The spectra in the region of interest, between 300 and 3200/cm, were analyzed using analytical software (Microcal Origin 5.0 Software, Inc.). The luminescence background was removed using baseline correction for each spectrum collected before relative comparison studies of organic and inorganic content were performed. All spectra were processed by fitting the Raman vibrational stretching mode at 960, 1071, 1665, and 2940/cm. The band fitting of characteristic peaks was performed using a combined Gaussian/Lorentzian function to determine the exact position, peak intensities, and areas.
Statistical analysis
One-way analysis of variance (ANOVA) with Tukey-Kramer multiple comparisons post hoc method was performed to test significance between groups after bleaching, and the t-test at a 95% confidence level was used to evaluate differences in the relative areas between periods before and after bleaching within groups. The Kolmogorov–Smirnov test was performed to assess whether data followed a normal distribution (Instat, GraphPad Software, San Diego, CA).
Results
Reflectance
Typical measured reflectance spectra before and after bleaching are shown in Figure 1. The data are presented as the relative intensity as a function of the wavelength.
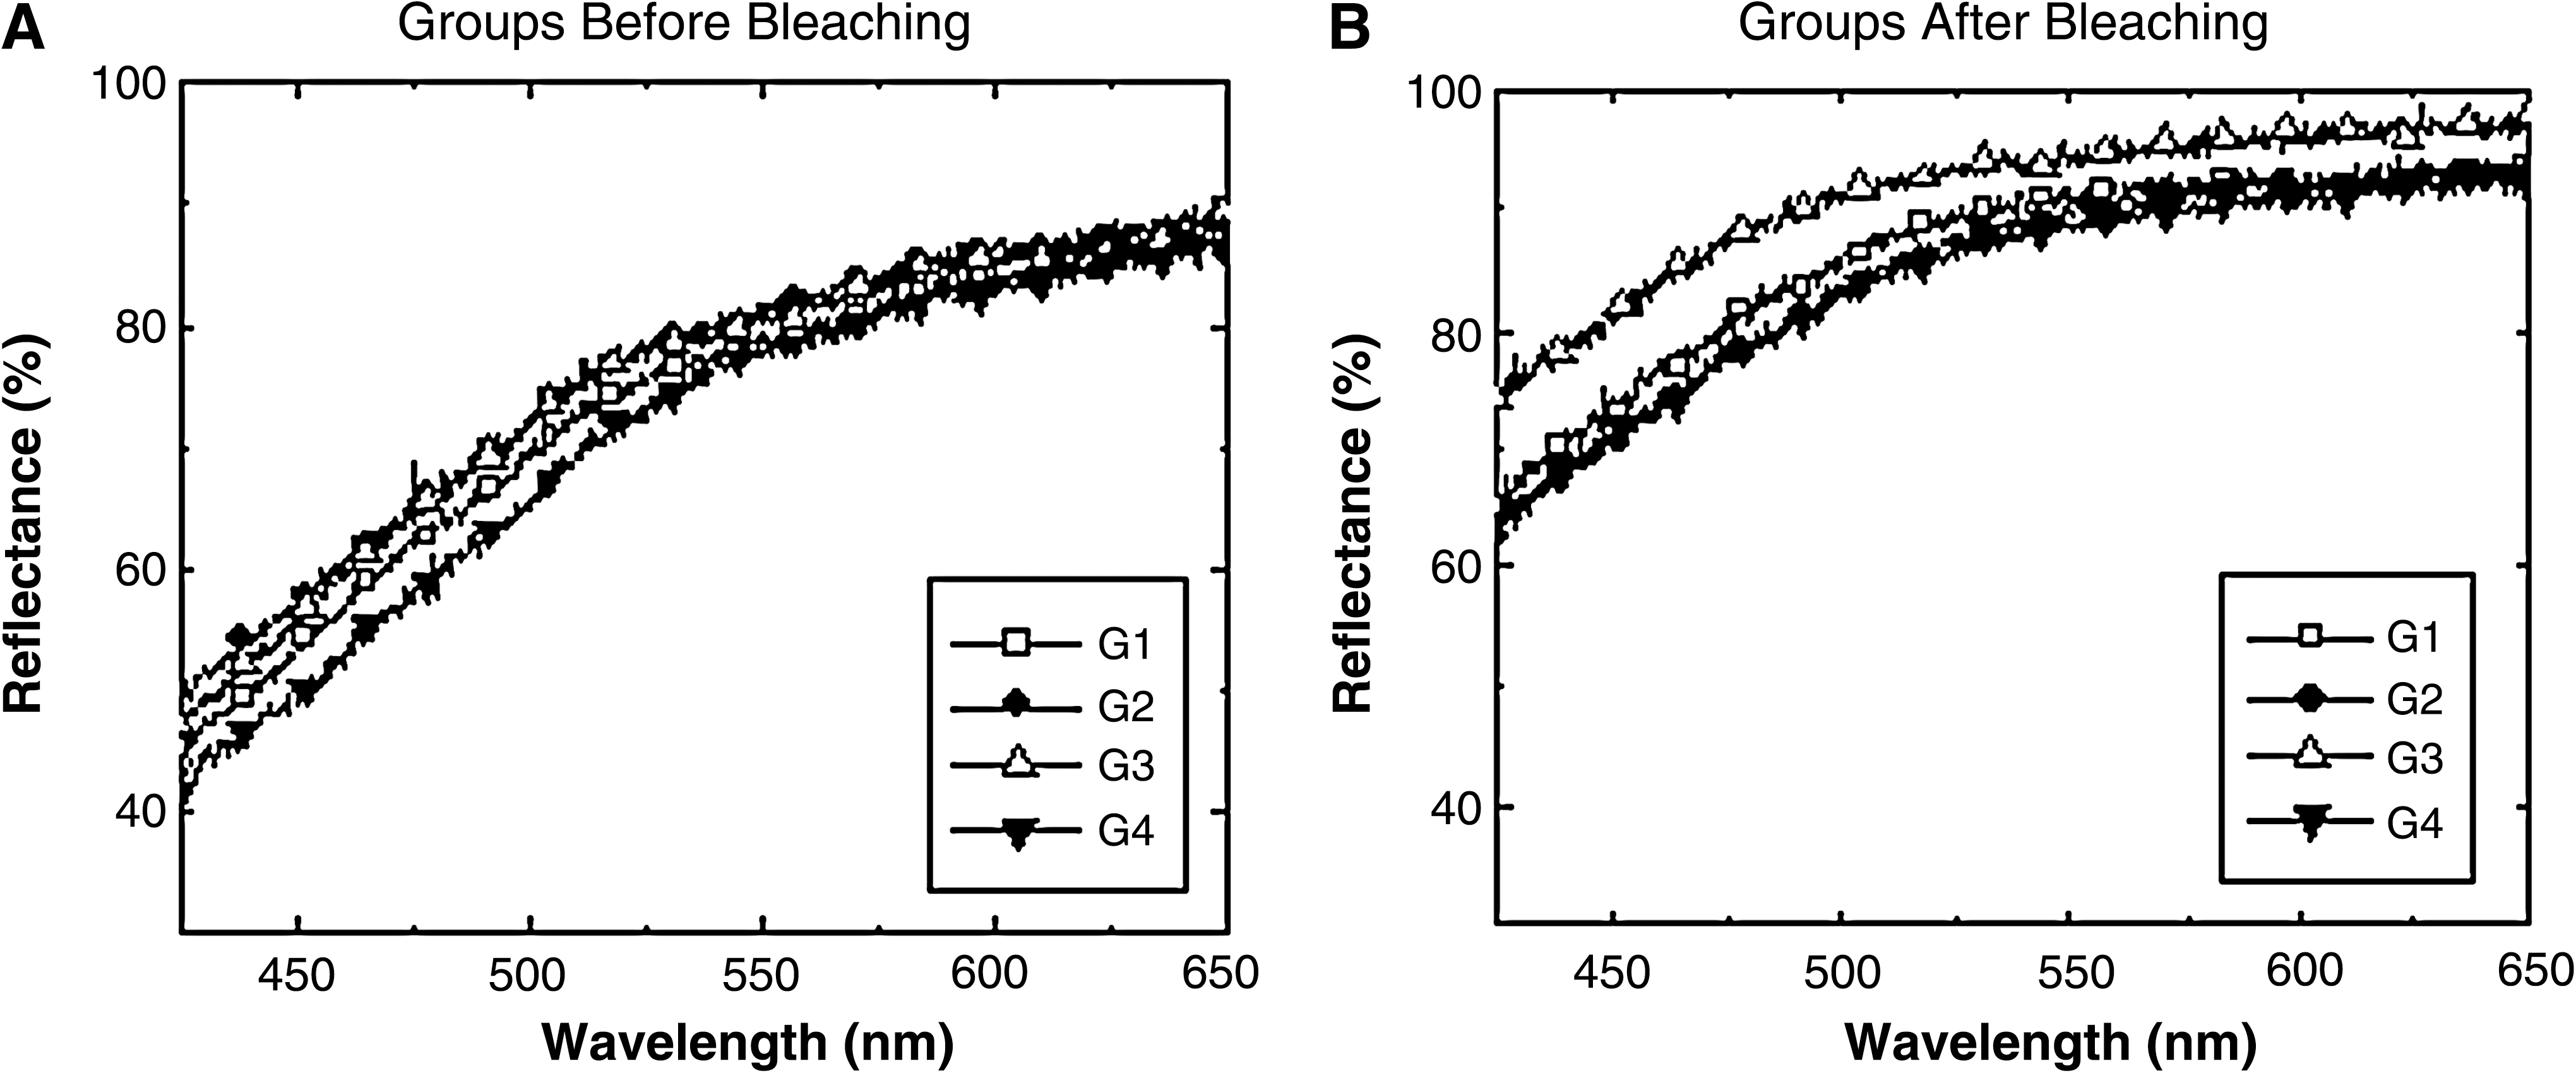
Typical measured reflectance spectra for bovine dental samples before (
The ANOVA and t-test statistical analysis, using the difference of before and after relative areas under the reflectance curves (Table 2), revealed that all groups bleached to a significant extent (p < 0.01). Tukey-Kramer multiple comparisons considering only the after-bleaching area values of the reflectance spectra showed that the dental bleaching was effective in all groups, but the values of reflectance of G3 were more effective than the other products used. The order of bleaching effectiveness was G3, G1 and G2 > G4 (p < 0.01). The G1 and G2 after-bleaching area values were not significantly different.
Tukey-Kramer multiple comparisons test showed that means followed by different superscript letters in the row differ (p < 0.05). All groups exhibited significant (p < 0.05) differences before and after bleaching.
FT-Raman spectra results
The typical Raman spectra for the normal and bleached bovine enamel in the region of 100 to 3300/cm after luminescence background was removed are shown in Figure 2. The spectra have been vertically shifted for clarity. No missing or new Raman peaks were found after bleaching. The vibration modes of dental organics as collagen were detected because the characteristic penetration depth of our experiments was approximately 500 μm, and thus Raman scattering from the bulk rather than the submicron surface layer of enamel dominated the signal.
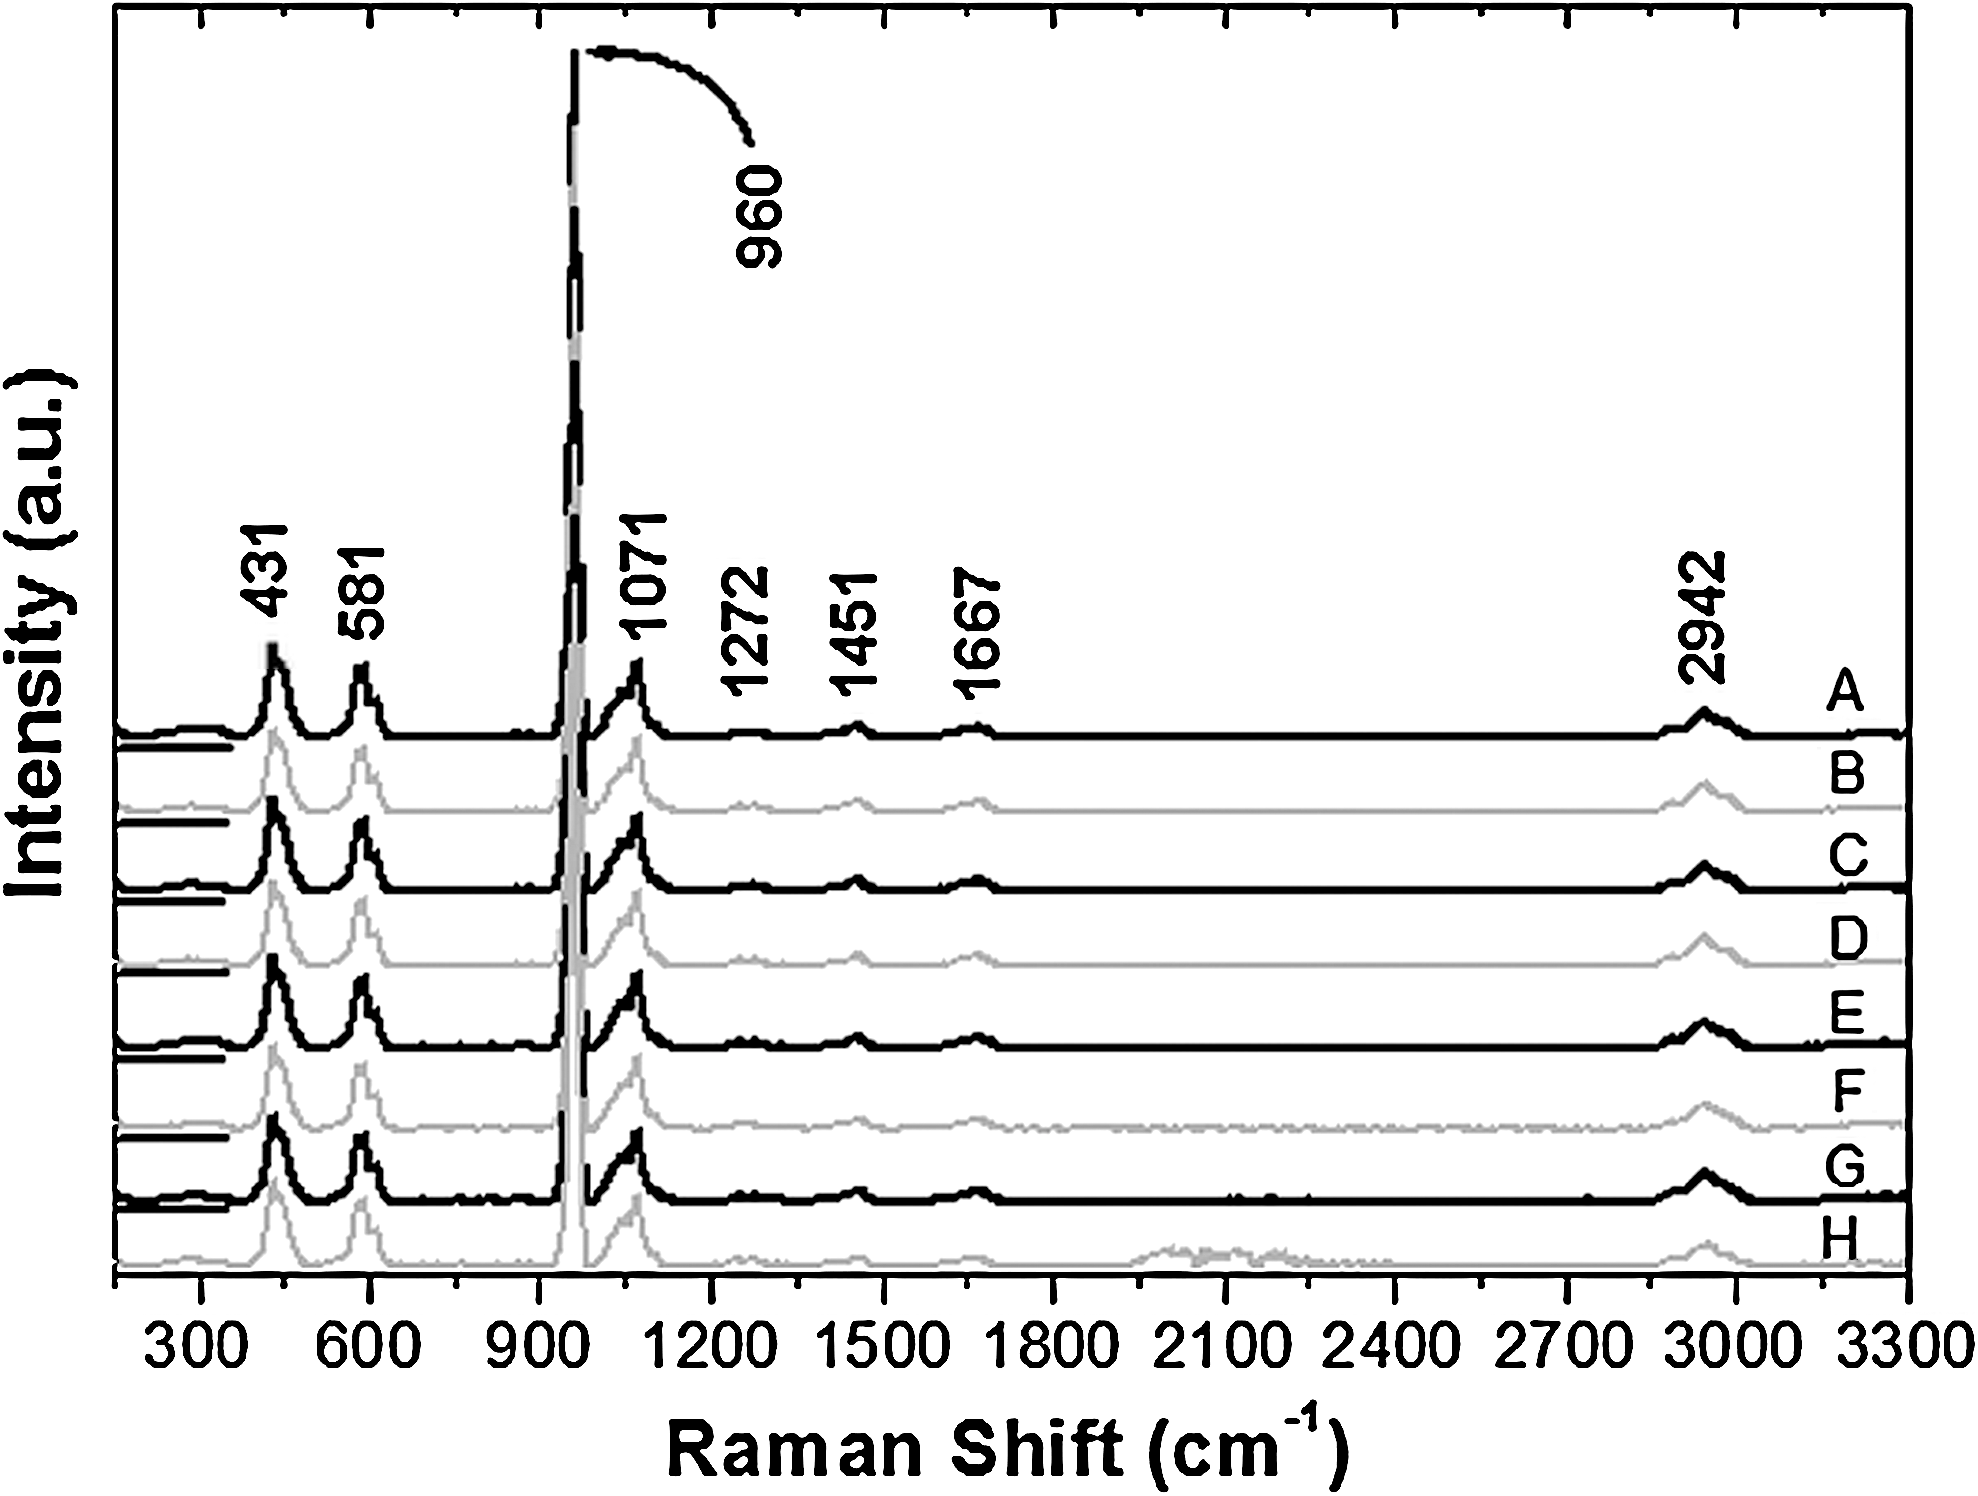
Fourier transform–Raman spectra (raw spectra) with the main vibrational modes before (black lines) and after bleaching (gray lines) for G1 before bleaching (A), G1 after bleaching (B), G2 before bleaching (C), G2 after bleaching (D), G3 before bleaching (E), G3 after bleaching (F), G4 before bleaching (G), and G4 after bleaching (H).
The intense peak at 960/cm is associated with the phosphate (PO4 3− ν1) stretching vibration in the mineral apatite component of enamel, and the peak at 1071/cm is attributed to carbonate (CO3 2− ν1) vibrations. 12,23,24 The peaks at 431 and 581/cm are related to PO4 3− ν2 and PO4 3− ν4 modes of phosphate, respectively. 12,23,24 The peaks at 1247, 1451, 1667, and 2942/cm are attributed to the dental organics, specifically amide III, C-H bending vibrations, amide I (C = O), and C-H stretching vibrations, respectively. 24
The mean values and standard deviations of the relative areas of the Raman peaks for the enamel before and after bleaching are shown in Table 3. For statistical analysis, the areas of the phosphate (960/cm), carbonate (1070/cm), type I collagen (1660/cm), and C-H bonds of organic matrix (2940/cm) peaks were compared. The relative areas of the inorganic and organic components in all four groups showed changes after bleaching. Those changes were not statistically significant (p > 0.05) as determined using a paired-samples t-test comparison except for type I collagen in G3, which was significantly different (p < 0.05).
Asterisks denote statistically significant difference (p < 0.05) between before- and after-bleaching areas.
Discussion
Several studies have verified the effectiveness of whitening gels, but determination of tooth color using visual means is highly subjective. General variables, such as external light conditions, clinical experience, and fatigue of human eye, and physiological variables, such as color blindness, lead to inconsistencies in outcomes. 25 Instrumental technologies that quantify color and color differences are widely used in dentistry. 18,26,27 Spectrophotometric and colorimetry are applied in in vitro and in vivo environments. 26,28,29
The present study investigated color changes after the enamel-bleaching treatment using a specific experimental reflectance system. The spectra presented distinct reflectance curves that reveal that all groups had been bleached after two treatment sessions.
Our results are in agreement with other studies that revealed changes in enamel reflectance after dental bleaching. Kwon et al., 17 Cesar et al., 18 and Campos et al. 19 evaluated carbamide peroxide bleaching products with concentrations of 30%, 35%, and 37% and hydrogen peroxide at 35%. They compared the reflectance spectra and verified an effective bleaching of the samples using these peroxides.
In the present study, four brands of commercially available 35% hydrogen peroxide were used. All experimental groups were analyzed using photoreflectance spectroscopy, before and after the bleaching treatment. The statistical analysis of reflectance showed that there were significant differences after treatment in all groups and that the bleaching agent Whiteform - Perox Red Form gel was more effective than the other products. We suggest that this difference in reflectance is probably due to the attack on the organic matter by the gel. 12
Contemporary approaches and the literature have focused on accelerating peroxide bleaching with simultaneous illumination of the anterior teeth with various sources with a range of wavelengths and spectral power, for example, halogen curing lights, plasma arc lamps, lasers, and LEDs. Case studies have demonstrated the efficacy of light-activated peroxide tooth-bleaching systems, but the evidence from in vitro and clinical studies for the actual effect of light on tooth bleaching versus a suitable nonlight control is limited and controversial. 30
Most of the investigators who evaluated the effects of bleaching agents on the surface of tooth hard tissues used hardness tests. These methods require special specimen preparations and examination conditions. Numerous in vitro studies have reported that bleaching therapies have a negative effect on physical properties, marginal integrity, enamel and dentin bond strength, and the color of restorative materials. Furthermore, peroxides may cause demineralization in enamel. 31
In the present study, FT-Raman results revealed that dental bleaching using highly concentrated hydrogen peroxide did not produce significant chemical changes in the inorganic enamel components. Carbonate and phosphate area peaks were not significantly changed after bleaching. In particular, the observation that the bleaching action did not affect the CO3 2− ν1 peak supports the conclusion that high-concentration bleaching does not demineralize enamel, as Gotz et al. 10 also showed. The fact that phosphate group concentration within the enamel is a good indicator of the degree of mineralization and that, in this case, phosphates did not change after bleaching also supported these results. 12
Our results are in agreement with those reported by others. 9,10,24 Using FT-Raman spectroscopy, Park et al. 9 and Wang et al. 24 found no significant effects on dental enamel treated with 30% and 38% hydrogen peroxide, respectively. Park et al. 9 investigated the effect of prolonged exposure to 30% hydrogen peroxide on bovine enamel. The authors concluded that the use of a 30% hydrogen peroxide solution for dental bleaching is safe because of its negligible effects on tooth morphology and structure. Götz et al. 10 found no obvious effects of bleaching with prototype bleaching strips containing hydrogen peroxide gel at 13% and 16% concentrations. They observed a reduction in the background luminescence of spectra after bleaching using Raman spectroscopy analysis. Wang et al. 24 did not detect any subsequent enamel alterations caused by a highly concentrated 38% hydrogen peroxide bleaching product (Opalescence Xtra Boost) using Raman spectroscopy.
However, other studies performed with Raman spectroscopy showed significant chemical changes in enamel after bleaching. 11,12 Bistey et al. 11 revealed the effects of 10%, 20%, and 30% hydrogen peroxide on human enamel using FT infrared spectroscopy; the PO4 ν1 and PO4 ν2 vibrational modes of phosphate exhibited severe alterations after bleaching. They found that higher concentrations and longer treatment times resulted in more-severe alterations. Jiang et al. 12 showed that the Raman relative intensity of enamel changed significantly after treatment with 30% hydrogen peroxide.
The severe alterations observed in the Bistey et al. 11 and Jiang et al. 12 studies could probably be because the bleaching was performed with a laboratory product (hydrogen peroxide solutions) and the specimens were stored in isotonic salt solution after the bleaching. In contrast to the Bistey et al. 11 study, we used FT-Raman spectrophotometry and had the advantage of avoiding time-consuming sample preparation. In addition, there was no need for specimen inclusion in resin for spectroscopic analysis. Another difference was that our specimens were stored in artificial saliva before and after bleaching, simulating clinical conditions and accounting for the saliva buffering effect. 16 Saliva plays a fundamental role in maintaining the physical–chemical integrity of tooth enamel by modulating remineralization and demineralization. The main factors controlling the stability of enamel hydroxyapatite are the active concentrations of free calcium, phosphate, and fluoride in solution and salivary pH. 32
Hydrogen peroxide bleaching also did not significantly affect the organic matrix components were (p > 0.05), except for the group treated with the Whiteform gel (G3) (p < 0.05). Bleaching with this gel probably resulted in greater decomposition of the dye molecules embedded in dental enamel than the other products. Those changes were observed in the present study using the peak centered at 1665/cm, which is related to type I collagen from dental organics. 24 We suggest that the greater reduction in the organic component results from the strong oxidizing ability of the Whiteform gel because of its acidity, which would allow the hydrogen peroxide to penetrate the enamel boundaries between nanocrystals, where it may then attack organic matter. 12
These results confirm the applicability of reflectance and FT-Raman analysis in measuring color alterations and chemical components in dental structures after bleaching. An advantage of these noninvasive techniques is their multiple applications in dentistry. However, more studies in situ and in vivo are needed to complement the information obtained from this study.
Conclusions
The clinical significance of the present study was the analysis of the bleaching effects of four commercial hydrogen peroxide gels using reflectance analysis. Under the conditions of this study, 35% hydrogen peroxide Whiteform – Perox Red Form gel exhibited great bleaching potential. This highly concentrated hydrogen peroxide gel significantly changed the reflectance of enamel and dental organics without significant chemical changes in enamel phosphate and carbonate content.
Footnotes
Acknowledgments
This investigation was supported by Fundação de Amparo à Pesquisa do Estado de São Paulo (grant numbers 2001/14384–8 and 1996/5590–3) and Conselho Nacional de Desenvolvimento Científico e Tecnológico (grant number 302393/2003–0). The authors gratefully acknowledge the technical assistance of Dr. Gustavo de Luca Alves for help in this study.
Disclosure Statement
No competing financial interests exist.