
Abstract
Introduction
Considering the higher prevalence and incidence of coronal and root caries in the elderly, 7,16 –20 it is important to develop preventive methods capable of promoting chemical changes on these surfaces to increase their resistance to caries attack. For this, we can apply erbium lasers for caries prevention. The lasers are not used to achieve ablation or melting, but to change the chemical composition of the dental structure to achieve surfaces more resistant to demineralization, and consequently reduce the susceptibility to incipient 21 and secondary 22 caries.
Considering that changes in dental tissue composition are obtained at temperature increases from 100°C up to 1200°C, 23,24 and that the ablation process should be avoided to minimize biofilm accumulation, it is important to verify the effects caused by laser irradiation on root dentin. The effects depend upon the energy density applied on the surface as well as the laser's focal distance, beam spot size, repetition rate, and pulse duration. 25 Previous studies report dentin ablation after Er,Cr:YSGG laser irradiation at 0.25 W 26 and 0.5 W, 27 with water cooling. However, it is still necessary to verify the ultramorphological effects of this laser wavelength on dentin tissue as a first step to evaluating potential clinical application for caries prevention.
For this purpose, the tapping mode atomic force microscopy (AFM) is a well-recognized technique to characterize biological tissues and has been used as a very precise and useful tool for dentin surface characterization and quantification, 28 –35 as well as investigations of dentin ultramorphology 36 and mechanical properties. 37 However, AFM imaging of laser-irradiated dental tissues is still scarce. 38 –41
For a better understanding of laser-irradiated surface topography, the roughness parameter (Ra) can be obtained, which is the most used parameter to characterize a surface morphology. However, in accordance with Gavrila et al., 42 this statistical description, though simple and reliable, makes no distinction between peaks and valleys and does not account for the lateral distribution of surface features. In this way, the power spectral density (PSD) function is a more complete image processing tool, useful for analyzing surface topography and identifying morphological changes on the tooth's surface. 43
The PSD displays a graphic of the Fourier transformation of the squared height profile h as a function of the wavelength. Thus, all surface features can be independently accounted for. For example, if one has a perfectly regular grating repeating in the x direction, the PSD will yield a plot with one peak of high amplitude at the wavelength of the grating pitch. A PSD characterization provides, in this case, a powerful method to identify the morphological wavelengths created on the laser-irradiated surface.
Considering the foregoing discussion, the aim of this study was to investigate the surface microtopography of root dentin after Er,Cr:YSGG laser irradiation at a low energy density parameter using AFM.
Materials and Methods
Sample preparation
Bovine lower central incisors were extracted immediately after sacrifice in a slaughterhouse of animals assumed to be 2–2.5 y old. Fractured or poorly mineralized teeth were not included. The teeth were stored in Hank's balanced salt solution at 4°C during all experimental procedures. Eight bovine teeth were used in this study. Four samples were laser-irradiated (irradiated group), while the remaining four samples were kept as controls (nonirradiated group). From each experimental group, three of the samples were used for AFM study and the last one was used to represent all samples with scanning electron microscopy (SEM). The teeth were cut 1 mm below the cementin–enamel junction and then 3 mm below this point using a low-speed cutting machine (Isomet, Buehler Instruments) under copious water cooling, in order to obtain one disc of radicular dentin from each tooth. In order to facilitate the positioning and polishing of the samples, the lingual side of each sample was flattened, and the labial side was used for experimentation. For that, the labial sides of the radicular dentin were sequentially polished by using 600, 1200, and 4000 grades of silicon carbide (SiC) papers (Buehler Instruments) for 5 min each under wet conditions. Final polishing was performed on each specimen sequentially with 2.0, 1.0, and 0.5 μm (Buehler Instruments) diamond water-based paste, each for about 10 min under wet conditions. Samples were rinsed copiously under deionized water after each polishing step. Ultrasonic treatments in deionized water between polishing steps were done to remove debris for 30 sec; longer treatments may alter the plastic-elastic response of the dental surface. 44
Laser irradiation
Laser irradiation was performed using an Er,Cr:YSGG hydrokinetic laser device (Millennium, Biolase Inc.), which emits a wavelength of 2.78 μm with a pulse width of 140 μsec and a repetition rate of 20 Hz. Power output was measured with a power meter (Coherent FieldMaster GS + Detector LM45). Mean power was set at 0.25 W, yielding an energy density of 2.8 J/cm2 and energy of 12.5 mJ/pulse. The energy was delivered through a fiber-optic system with a sapphire terminal of 750 μm in diameter and 6 mm long (S75 tip). During irradiations, samples were immobilized in X-Y-Z optical supports and treated with air and water spray. The laser handpiece was coupled to a computer-managed motion control system (Newport) adjusted to a speed of 4 mm/sec in order to avoid unlased areas or overlapping of focused areas. The laser tip was kept at a standardized distance of 1 mm from surface, and laser irradiation was done by scanning the entire dentin surface area.
Instrumentation
AFM analysis
Tapping mode AFM images of samples were obtained in three samples of each experimental group at room temperature, in air, by a Nanoscope IIIa (Veeco - Digital Instruments), equipped with a J piezoelectric scanner that can cover an area of 100 by 100 μm with a range of 7 μm in the z direction with etched silicon probes of nominal tip end radius ∼15 nm, cantilevers of nominal resonant frequency ω of ∼250 kHz and nominal spring constant k of ∼40 N/m (Veeco Nanofabrication Center).
The images that illustrate this work were obtained with a scan size from 5 μm up to 100 μm and were recorded with 1 Hz scan rate and resolution of 512 points per line. A standard second-order flattening process of the images was performed in order to correct the scanner nonlinearity. For analysis, a J scanner was used that can cover an area of 100 by 100 μm; considering this image size, it was impossible to cover all pulse areas at once. Therefore, 10 pulses of each sample were randomly selected and, from each pulse, three distinct areas of 20 by 20 μm were identified for analysis, 44 as described below. As was observed in the SEM images (Fig. 1), the ablation area of each laser pulse was about 200 μm. In this way, for better topographical analysis, each laser pulse was divided in the microscope into three different areas, as shown in Fig. 2: the “central” area of laser pulse, corresponding to an area with diameter of 50 μm located in the center of ablation zone; the “intermediate” area of laser pulse, corresponding to an area with a diameter of 200 μm around the central area of ablation; and the “peripheral” area, corresponding to an area with diameter of 600 μm around the intermediate area. The “nonirradiated” areas were obtained by analyzing the samples of nonirradiated group.
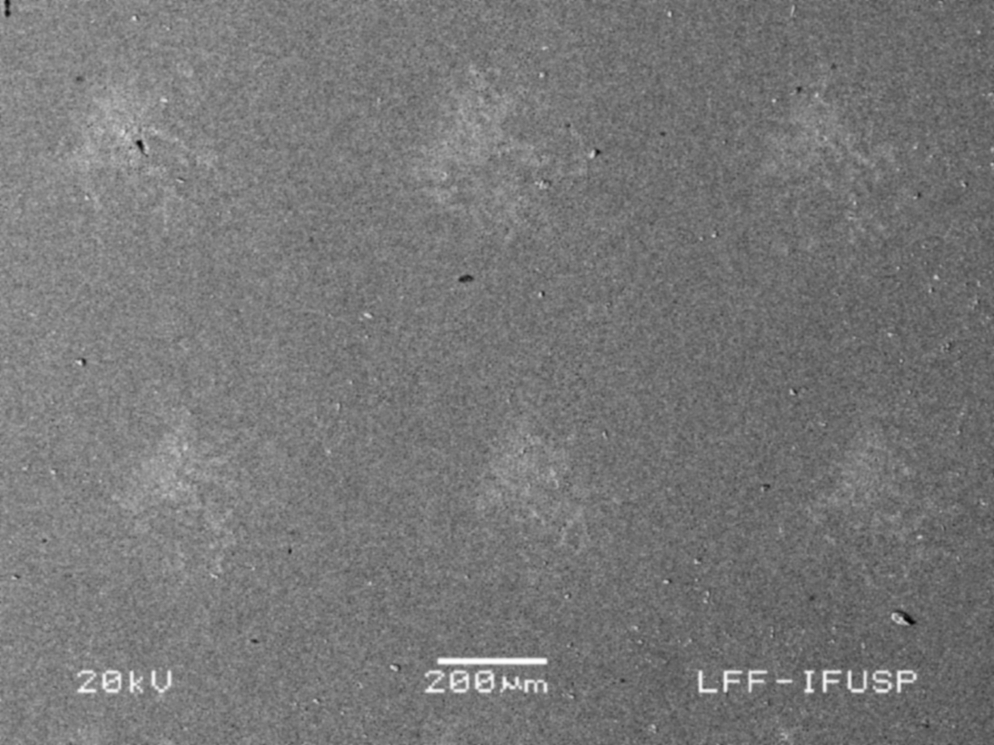
Scanning electron micrograph of a series of six single pulses on dentin surface. Original magnification at 70 × (bar = 200 μm).

The central area of the laser pulse, corresponding to an area with diameter of 50 μm located in the center of ablation zone; the intermediate area of the laser pulse, corresponding to an area with diameter of 200 μm around the central area of ablation; and the peripheral area, corresponding to an area with a diameter of 600 μm around the intermediate area.
The quantitative and qualitative information concerning roughness (Ra), cross-section, and power spectral density were obtained from the respective laser pulse areas.
Roughness analysis
The arithmetic average roughness (Ra) was obtained from the AFM investigations by analyzing, for each sample, ten 20 by 20 μm areas
44
of each pulse region (central, peripheral, intermediate, and nonirradiated areas) with resolution from 512 by 512 pixels. The arithmetic average roughness Ra was calculated according to the analyzed pulse region, with the roughness analysis software of Nanoscope IIIa version 5.13 R3 (Digital Instruments). The conventional statistical roughness parameter Ra was determined using the following equation:
where N is the number of pixels in the image (512 by 512) and Zj is the height associated with each pixel (j).
Power spectral density
For further surface topography characterization, a spectral analysis of the AFM data was made using a fast Fourier transformation. From the PSD curve of the surface, characteristic and valuable topographic parameters were gathered along with quantitative information, not only on the deviation of the roughness profile height, but also on its lateral distribution (the spatial extent of the height variations in the roughness profile).
The PSD function reveals periodic surface features that might otherwise appear “random” and provides a graphic representation of how such features are distributed. The frequency distribution (PSD (f)) for a digitized image, with pixel size d
0 is given as:
where f is the spatial frequency (the inverse of the morphological wavelength).
SEM analysis
One sample of each experimental group was randomly chosen for visualization on a scanning electron microscope (SEM JSM-6480LV; Jeol). In preparation, each sample was put into a dissector to dry for 24 h and then sputtered with a conductive gold layer and observed in high vacuum mode.
Statistical analysis
Final mean values data of roughness (Ra), considering the region analyzed (central, intermediate, peripheral, or nonirradiated), were statistically analyzed by one-way analysis of variance (ANOVA) and then by Tukey's test (Minitab 14, Minitab Inc.) for pairwise comparisons among groups (α = 0.05). To check if there was homogeneity of variance and normality in the experimental errors, the Levene's test and the Shapiro–Wilk test were performed before ANOVA.
Results
Roughness of dentin surface
A significant effect of laser pulses on dentin roughness was observed, which was dependent on each pulse region (p < 0.001). The Tukey's test revealed a significant increase (p < 0.01) in Ra in the center when comparing with all the other regions (intermediate, peripheral, and nonirradiated), and a significant difference (p < 0.01) in Ra between the intermediate and the other regions (central, peripheral, and nonirradiated areas). Nevertheless, the Tukey's test revealed a nonsignificant difference in Ra between the peripheral and the nonirradiated regions. The mean Ra in nanometers and the standard deviation of the experimental areas are presented in Fig. 3. The AFM images obtained on these regions are exhibited in Figures 4 –7.
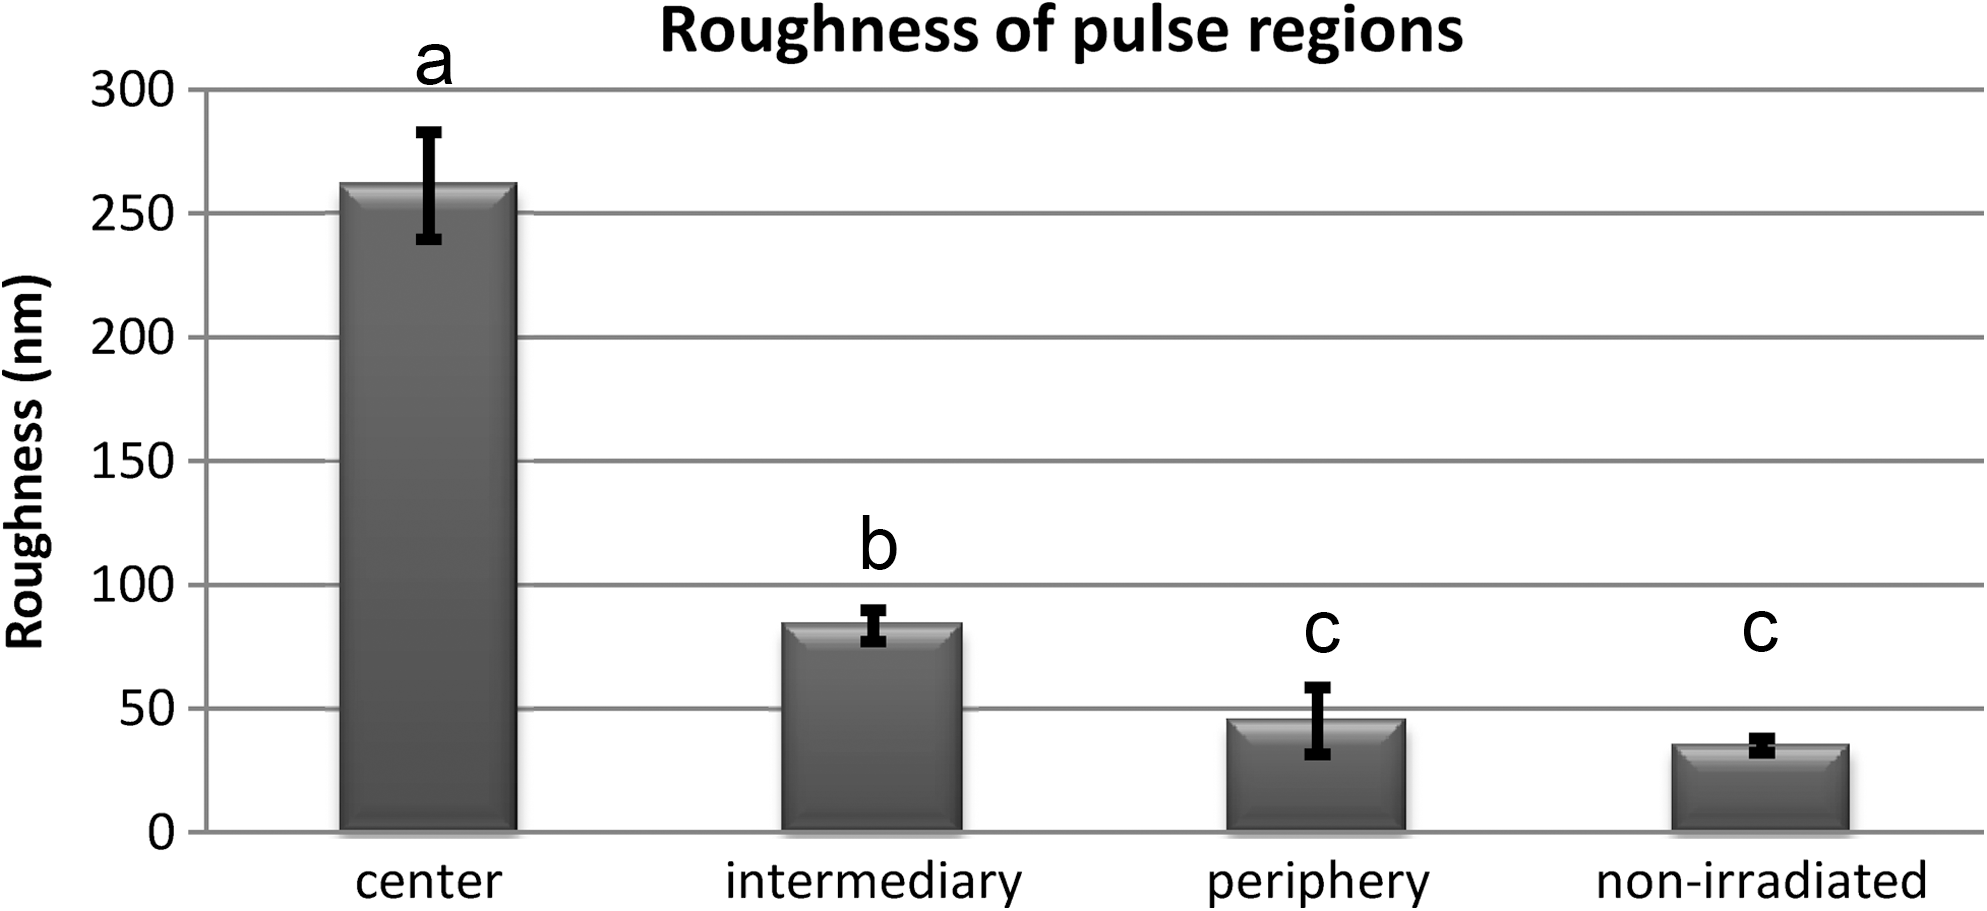
Mean surface roughness (Ra) in nanometers according to the region of the laser pulse. Bars represent the standard deviation interval. Same letters represent nonsignificant difference.


Observation of nonirradiated dentin surface
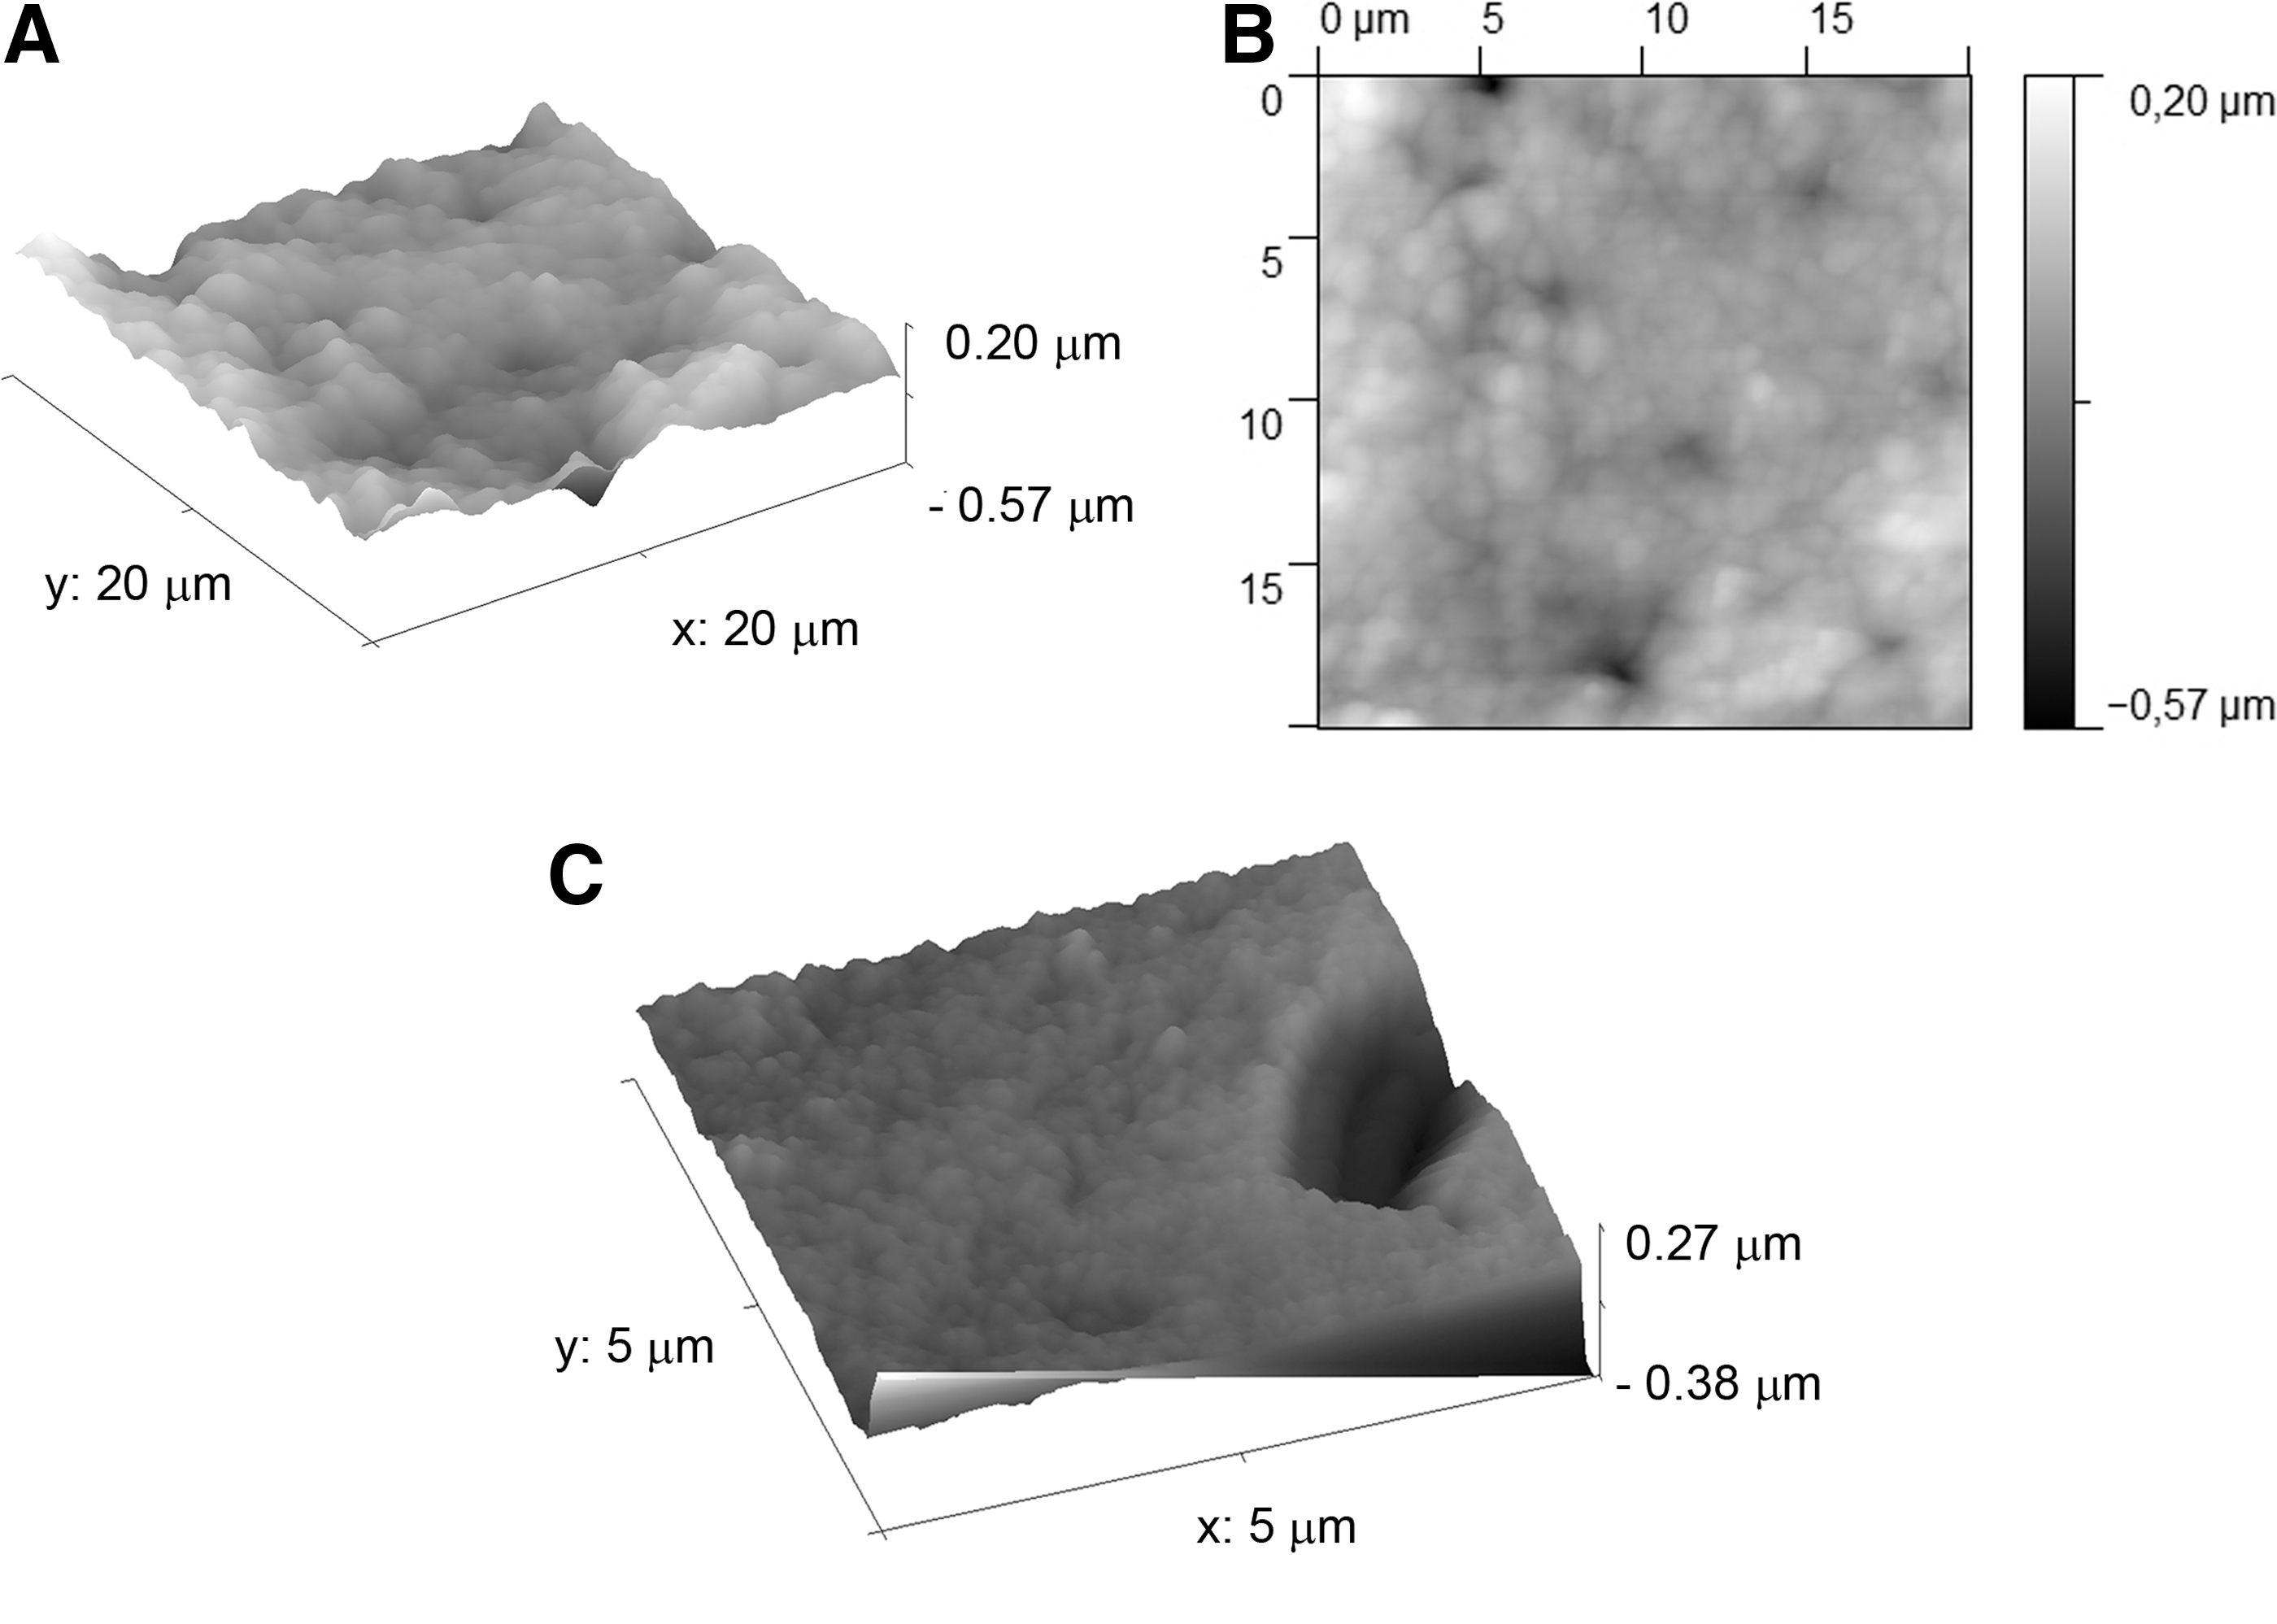
A nonirradiated dentin surface image, provided by AFM microscopy, is shown in Fig. 4. A three-dimensional visualization (3D view) is shown in Fig. 4A, and a top view of the same region is presented in Fig. 4B. The morphology of a single dentinal tubule is shown in Fig. 4C. The presence of opened dentinal tubules, without a smear layer, can be seen. Also, it is easy to distinguish the presence of intertubular and peritubular dentin (arrows), with no exposure of collagen fibrils. The nonirradiated region surface is flattened and presents no nodules.
Observation of irradiated dentin surface
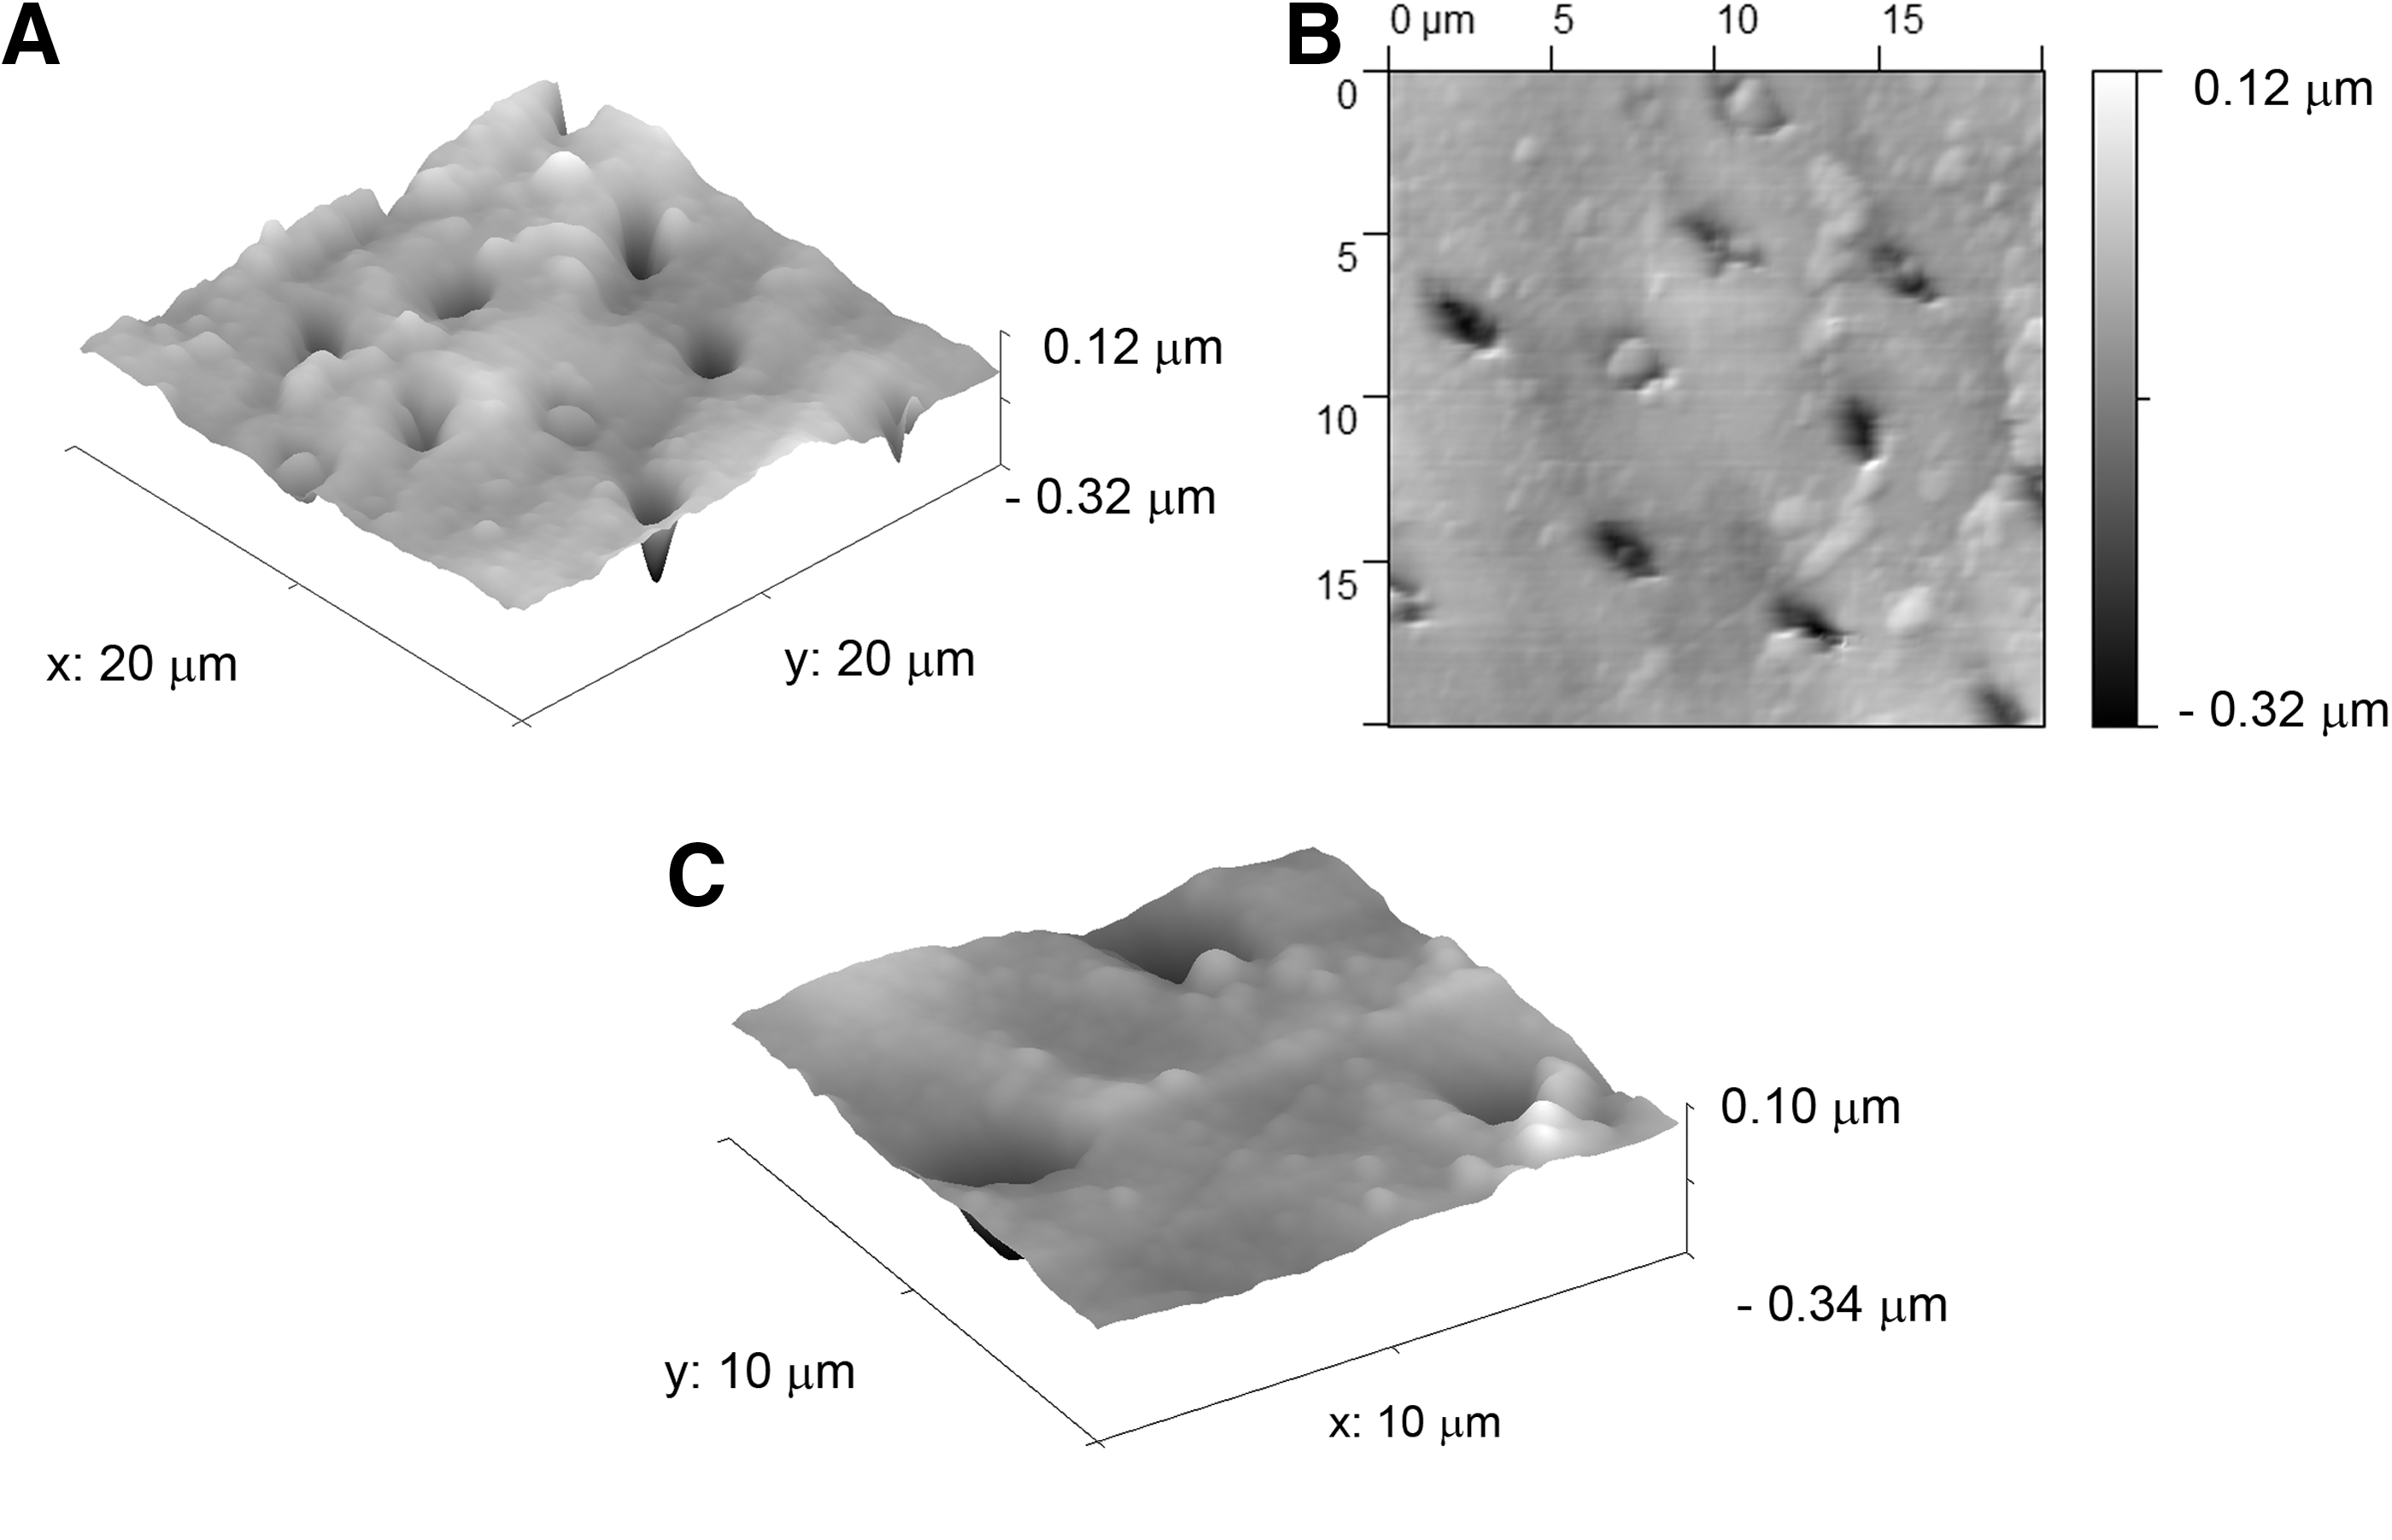
Using a beam with a diameter of 750 μm and pulse energy of 12.5 mJ, some changes in the irradiated dentin surface can be identified. An irradiated dentin surface is shown in Fig. 5, which represents the central region of the laser pulse. Dentinal tubules are shown in Fig. 5A with a 3D view. Figure 5B illustrates the top view of the irradiated dentin surface. The morphology of a single dentinal tubule is shown in Fig. 5C. Opened dentinal tubules are also evident, without a smear layer or exposure of collagen fibrils. However, it can be noted that the peritubular dentin protrudes in a range between the 340–760 nm height of the intertubular region level and the peritubular region level. Also, the central region of laser pulses presented nodules between 30 and 45 nm high and 0.8 and 2.2 μm wide, and these nodules can be found in the peritubular and in the intertubular dentin.
Figure 6 represents the intermediate region of the laser pulse on an irradiated dentin surface. Dentinal tubules are shown in a 3D view in Fig. 6A. The Fig. 6B illustrates a top view of the irradiated dentin surface. The morphology of a single dentinal tubule is shown in Fig. 6C. It can be seen that the peritubular dentin is protruded in comparison with the intertubular dentin; however, this protrusion is smaller when compared to the peritubular dentin of the central region of the laser pulse (Fig. 5). The intermediate region presented nodules between 30 and 45 nm high and 0.8 and 2.2 μm wide that are located in both peritubular and intertubular dentin.
Figure 7 represents the peripheral region of a laser pulse. Dentinal tubules are shown in a 3D view in Fig. 7A. Figure 7B illustrates the top view of the irradiated dentin surface. The morphology of a single dentinal tubule is shown in Fig. 7C. It is possible to observe a flatten surface, without protrusion of peritubular dentin. However, the presence of nodules 10–30 nm high and 0.8–2.2 μm wide in peritubular and intertubular dentin can also be observed, and some of them are occluding the entrance of some tubules.
PSD of dentin surface
The PSD analysis of dentin demonstrated that irradiated areas had a high contribution of all morphological wavelengths in comparison with nonirradiated regions (Fig. 8).
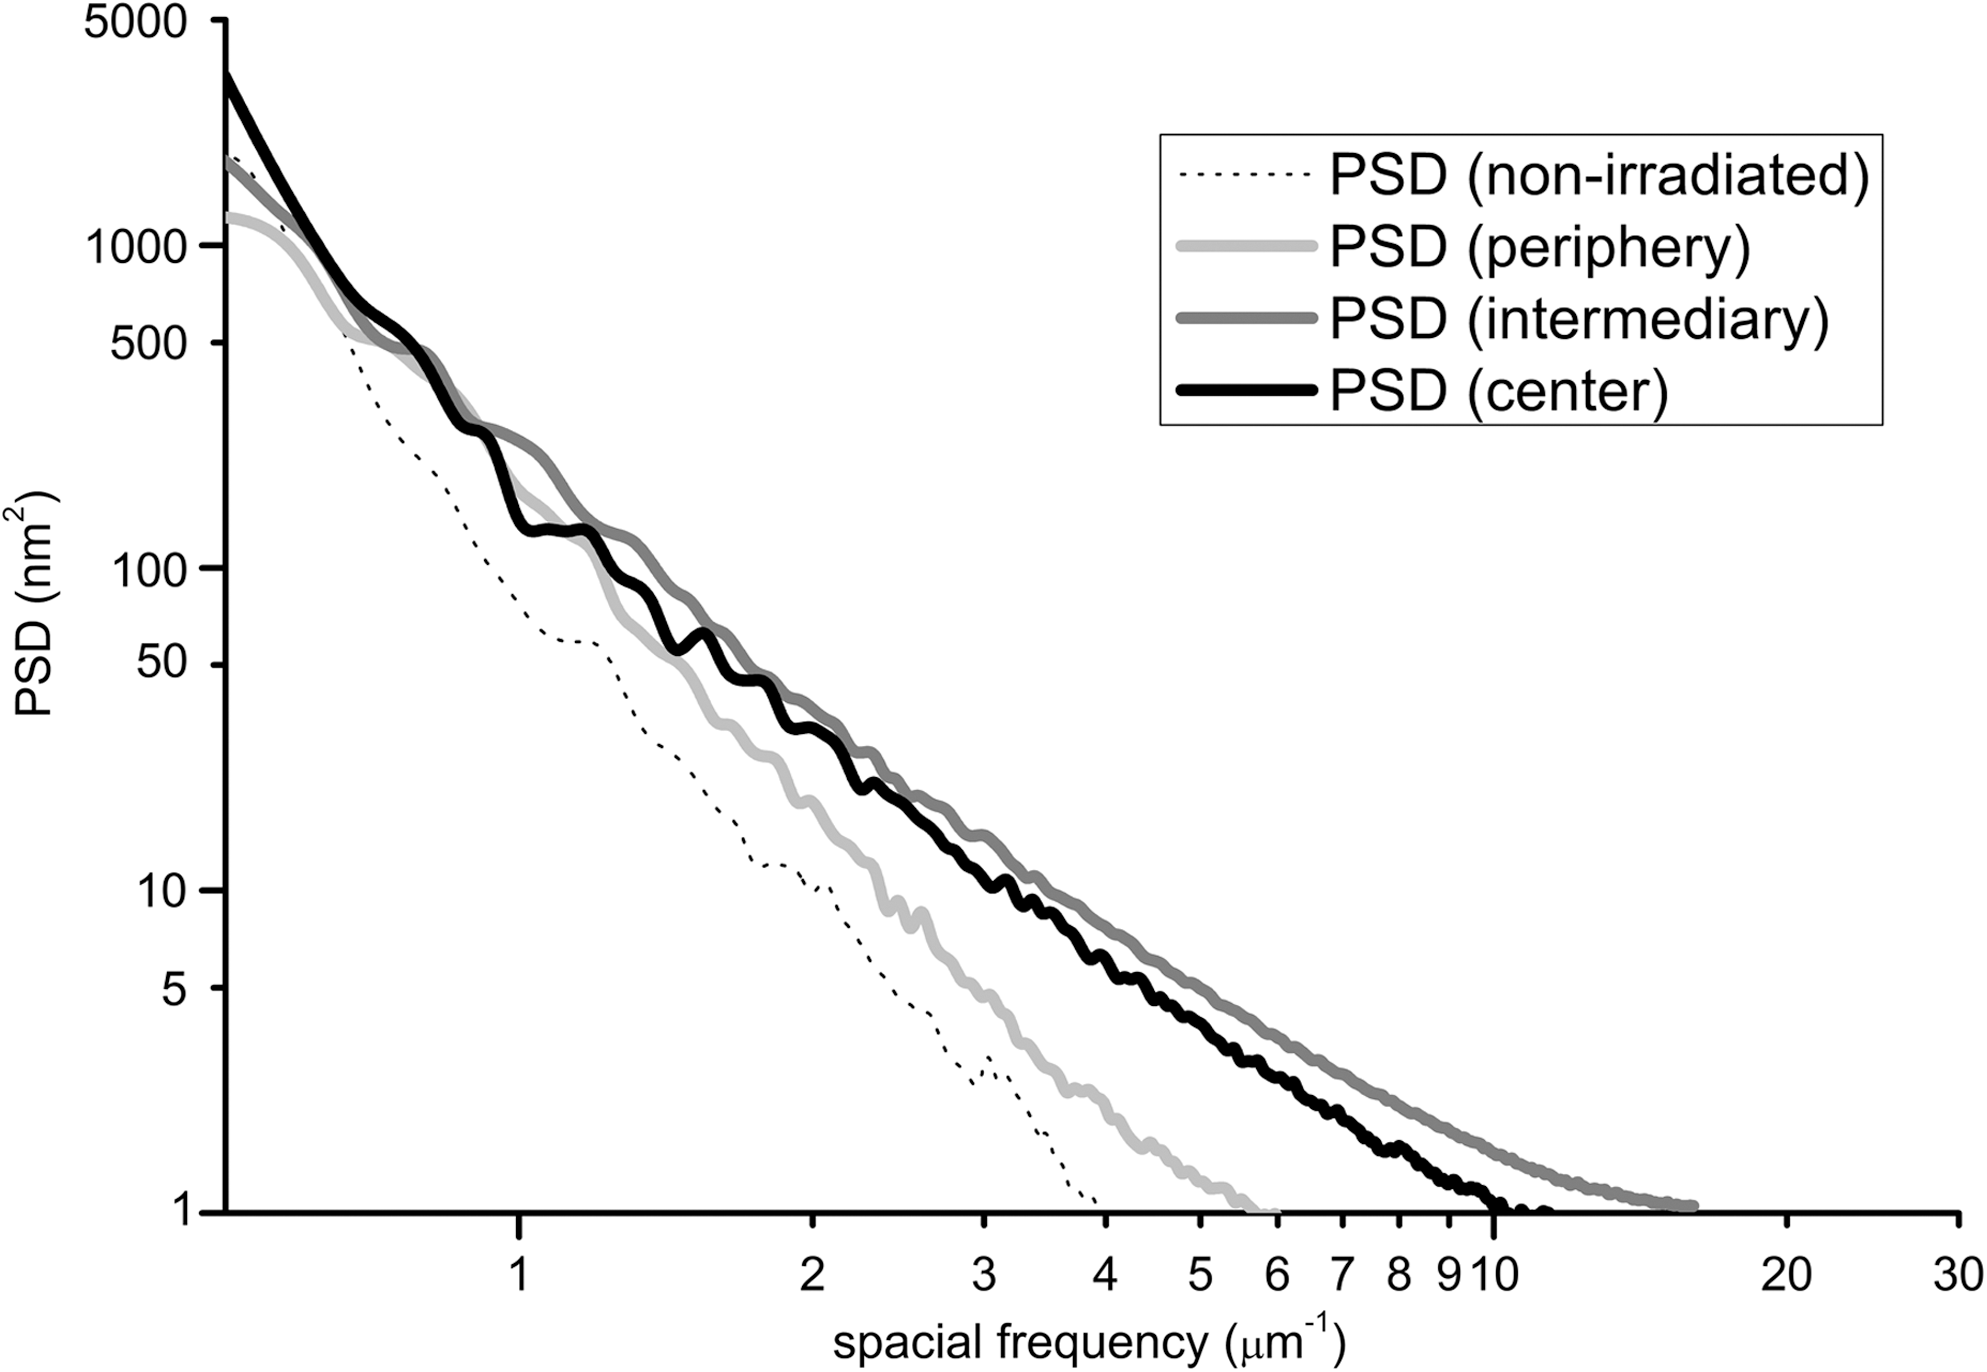
Power spectrum analysis of the regions studied.
Figure 8 shows that the irradiated regions exhibit the formation of morphological wavelengths of 250–170 nm in the peripheral region, 250–100 nm in the central region, and 250–50 nm in the intermediate region.
Discussion
Infrared lasers are widely studied for use in preventing tooth demineralization because laser irradiation can change enamel and dentin composition and alter their solubility. 24,45 –47 Erbium lasers can be used for this purpose since the irradiation does not promote morphological and thermal injuries on dental hard tissues. Therefore, it is suggested that the energy densities of erbium lasers should be adjusted below the ablation threshold. 47 –49 In order to choose a laser parameter for clinical application, it is necessary to evaluate the structural changes promoted by irradiation on a selected tissue, which has not yet been done for the Er,Cr:YSGG laser on dentin.
In this study, samples were irradiated with the lowest energy density obtainable with commercial Er,Cr:YSGG laser equipment. On visual inspection, this density promoted no morphological changes. However, AFM revealed evidence of ablated, consequently rough surfaces even with this low energy density that could be correlated with each laser pulse incidence (Fig. 2). The ablation sites found in the present study demonstrate the strong interaction of Er,Cr:YSGG laser with dentin. Dentin is a vital tissue, rich in collagen- and fluid-filled dentinal tubules that are directly connected to the pulp tissues. Dentin contains a large volume fraction of inorganic and organic material and water, respectively, by volume, in the peritubular regions (25.7%, 0.6%, and 2.3%) and intertubular regions (22.3%, 27.4%, and 5.7%). 50 Er,Cr:YSGG laser effectively interacts with this vital substrate, causing hard tissue ablation due to thermo-mechanical interaction of the laser wavelength (2.78 μm) with the OH− radical absorption peaks presented in water (3.00 μm) and hydroxyapatite (2.9 μm). 25 Thus, even the low energy density used was sufficient to ablate dentin, which was demonstrated here by morphological, roughness, and PSD analysis. In the present study, irradiated regions presented a significant increase in Ra parameters when compared with unlased areas (Fig. 3), also showing evidence of the ablation mechanism.
These characteristics changed significantly by region within the same laser pulse; which, in the present study, were generically called the central (Fig. 5), intermediate (Fig. 6), and peripheral regions (Fig. 7). It was shown that central regions had significantly higher Ra when compared with the other regions, and that Ra values decreased from the center to the periphery of laser pulses. This phenomenon can be explained by the Gaussian aspect of the Er,Cr:YSGG laser beam, which has the characteristic of concentrating the energy in the central region of the laser beam with the energy decreasing gradually as it gets close to the periphery. 51 As a consequence, the effects of laser irradiation on tissue decrease from the center to the periphery of the laser pulse.
The variation of the energy density within the same pulse causes different interaction effects on the irradiated tissue. This was confirmed in the present study by the AFM technique showing that the pulse center, which has significantly higher energy density delivered into it than the intermediate region, presented more major topographic alterations than the intermediate region, which has higher energy than the peripheral region and, in turn, presented more topographic alterations than the peripheral region.
Nevertheless, the Tukey test revealed a nonsignificant difference in the roughness (Ra) between the periphery and the nonirradiated regions (Fig. 3), confirming the mechanism described above. Thus, we can infer that a difference in the energy density delivered upon the dentinal tissue may promote different topographical patterns in dentin, depending on the regions of laser pulse. This result would add a better understanding of tissue–laser interaction and would be advantageous for obtaining clear conclusions regarding clinical application, for example, for choosing parameters for preventive or adhesive purposes in dentistry.
Within each region of a laser pulse, it is possible to observe important characteristics. In the central region of laser pulses (Fig. 5), in addition to the absence of smear layer and the presence of widely opened dentinal tubules, the peritubular dentin is highly protruded from the surrounding intertubular dentin when compared to the other regions of the laser pulses, showing a strong interaction of the laser beam with the intertubular region. This higher interaction is due to the increased water and organic contents of intertubular dentin when compared with the peritubular dentin. 50 In this way, the ablation mechanism is higher in this region of the tissue.
In the intermediate region of laser pulses (Fig. 6), absence of smear layer was also observed and the aspect of peritubular dentin protrusion was less apparent, showing that less laser energy interacted in this region, probably due to the Gaussian profile of the laser beam. Nevertheless, in the peripheral region of laser pulses (Fig. 7), the peritubular dentin protrusion was not observed, indicating even less interaction of laser irradiation with this tissue. This finding is also a consequence of the Gaussian profile of the laser beam.
The most significant parameter characterizing the morphology of surfaces is Ra, which represents the arithmetic average roughness. However, this statistical description, though simple and reliable, makes no distinction between peaks and valleys and does not account for the lateral distribution of surface features. 42 In this way, a more complete description of the surface topography is provided by the PSD, which performs a decomposition of the surface profile into its spatial wavelengths and allows the comparison of roughness measurements over different spatial frequency ranges. The PSD displays a graphic of the Fourier transformation of the squared height profile, h, as a function of the wavelength. Thus, all surface features can be accounted for independently. For example, if one has a perfectly regular grating repeating in the x direction, the PSD will yield a plot with one peak of high amplitude at the wavelength of the grating pitch. If Ra processing was applied to this surface, only a number would be generated. This means that a surface can be fully understood using PSD results, but not using Ra. A PSD characterization provides in this case, a powerful method to identify the morphological wavelengths created on the laser-irradiated dentin surfaces. Although the roughness, Ra, is a suitable tool for the comparison of different surface morphologies, it only gives information along the vertical direction and, hence, cannot fully characterize the surface texture. On the other hand, the PSD quantitatively analyzes the contribution of each morphological wavelength allowing identification of size features that contribute the most to an image. 52 This fact emphasizes that PSD is capable of distinguishing different pulse laser areas in the same pulse in dentin tissue.
The power spectral density graph in Fig. 8 shows the more intense contribution of each morphological wavelength in different positions in irradiated regions (central, intermediate, and peripheral regions) than in nonirradiated ones. In the irradiated regions, the presence of some morphological wavelengths that were absent in the nonirradiated regions was noted, starting at 50 μm up to 230 μm. These different morphological wavelength contributions may be the result of nodule formation due to laser irradiation, as can be seen in the AFM images (Figs. 5 –7). These nodules can be a morphological result of change in the size of hydroxyapatite crystals 53 or the formation of new crystallographic phases after irradiation, which corroborates the study of Bachmann et al., 54 who mentioned the formation of new crystalline phases on enamel irradiated with Er,Cr:YSGG at the same energy density than that used in the present study. In fact, considering the new crystalline phases that could be formed after laser irradiation, the tricalcium phosphate in the alpha phase (α-TCP) [α-Ca3(PO4)2] has a size of approximately 100 nm, while the tricalcium phosphate in the beta phase (β-TCP) [β-Ca3(PO4)2] has size of approximately 230 nm, 55 which corresponds to the size of nodules found on AFM images of the present study. It is important to note that the formation of tricalcium phosphate and tetracalcium phosphate on laser-irradiated dentin reported in the literature 56,57 is speculated to be a result of temperature increment, which can occur with Er,Cr:YSGG laser irradiation on dentin even at the low energy density used in the present study. However, further studies are necessary to determine the temperature changes on dentin after Er,Cr:YSGG laser irradiation in order to verify this hypothesis. Also, it is necessary to evaluate the feasibility of using this parameter for a future clinical application, even considering the temperature increments and the safety for pulpal tissue, or even evaluating the impact of promoting crystalline changes for preventing dentin demineralization.
Conclusions
In summary, Er,Cr:YSGG laser irradiation of dentin promotes a significant increase in dentin roughness, even at a low-energy density parameter, which is related to laser pulse region and its interaction with dentin tissue. Also, the AFM technique was able to provide qualitative and quantitative information on the extent of the topographical changes caused by laser irradiation on dentin, giving important information on different regions of the same laser pulse.
Footnotes
Acknowledgments
The authors thank the research support foundation “Fundação de Amparo à Pesquisa do Estado de São Paulo (FAPESP)” for their grants: number 1995/5651-0, number 2006/05684-1, and number 2006/06746-0 and the “Conselho Nacional de Desenvolvimento Científico e Tecnológico (CNPq)” for their grants: 473723/2007-7 and 143395/2009-2.
Author Disclosure Statement
No competing financial interests exist.