
Abstract
Introduction
Dental materials used to fill in a tooth cavity are continuously exposed to water. The water on the surface absorbs into the subsurface with time, which makes the material swell and soften. Subsequent deterioration of the physical/mechanical properties occurs because of bond breakdown between the silane and filler particles, debonding in the filler-matrix interfaces, and leaching of the unreacted monomers and water-soluble elements. 4 The ISO 4049 standard states that the maximum water sorption and solubility are <40 and 7.5 μg/ mm3, respectively. 5
The role of blue light is crucial because it initiates the polymerization process. Thus far, several types of light sources have been introduced for the light curing of dental restorative materials. 6 –9 One common feature in these light sources is the overlap of their emission spectrum to the absorption spectrum of CQ. The conventional quartz–tungsten–halogen (QTH) and xenon-based plasma arc light sources match the CQ spectrum most widely. On the other hand, light emit diodes (LEDs) match only at the absorption peak of CQ, and the argon laser matches only at the tail part of the absorption peak of CQ. Among the light sources, the argon laser showed the narrowest emission width. Recently, diode-pumped solid state (DPSS) lasers have become widely used, as laser pointers and as a light source for the excitation of phycoerythrins (PE) in flow cytometers. 10 –12 The advantages of DPSS lasers over argon lasers are their compactness and price. However, there are few reports on the application of DPSS lasers to the light curing of dental restorative materials in dentistry. 13 –16
The purpose of this study was to evaluate the polymerization shrinkage and mass change in dental resin composites that were light cured using the DPSS laser. The testing hypothesis was that the DPSS laser of 473 nm can light cure resin composites to the level that was achieved by the QTH light source through the effective activation of CQ.
Materials and Methods
Specimens and light sources
For the study, four different resin nanocomposites [Ceram X (CX), Grandio (GD), Premise (PE), and Filtek Z350 (Z3)] and two hybrid resin composites [Filtek P60 (P60) and Tetric Ceram (TC)] were examined. All have the shade, A3. A conventional QTH light [Optilux 501 (OP), Kerr, Danbury, Connecticut] and a DPSS laser (LAS) (LVI Technology, Seoul, Korea) of 473 nm were used as the light sources. The output power and spot size of LAS were ∼140 mW (PM3/FIELDMAX, Coherent, Portland, Oregon) and 7 mm, respectively. The raw beam was expanded to 7 mm using a beam expander. The output light intensity of OP was measured using a radiometer, which was internally set in the OP. The light intensities of OP and LAS were ∼800 and 400 mW/cm2, respectively. Table 1 lists the characteristics of the specimens used. The emission spectrum of the light sources and the absorption spectrum of CQ (Figure 1) were measured using a photodiode array detector (M1420, EG&G PARC, Princeton, New Jersey) connected to a spectrometer (SpectroPro-500, Acton Research, Acton, Massachusetts).
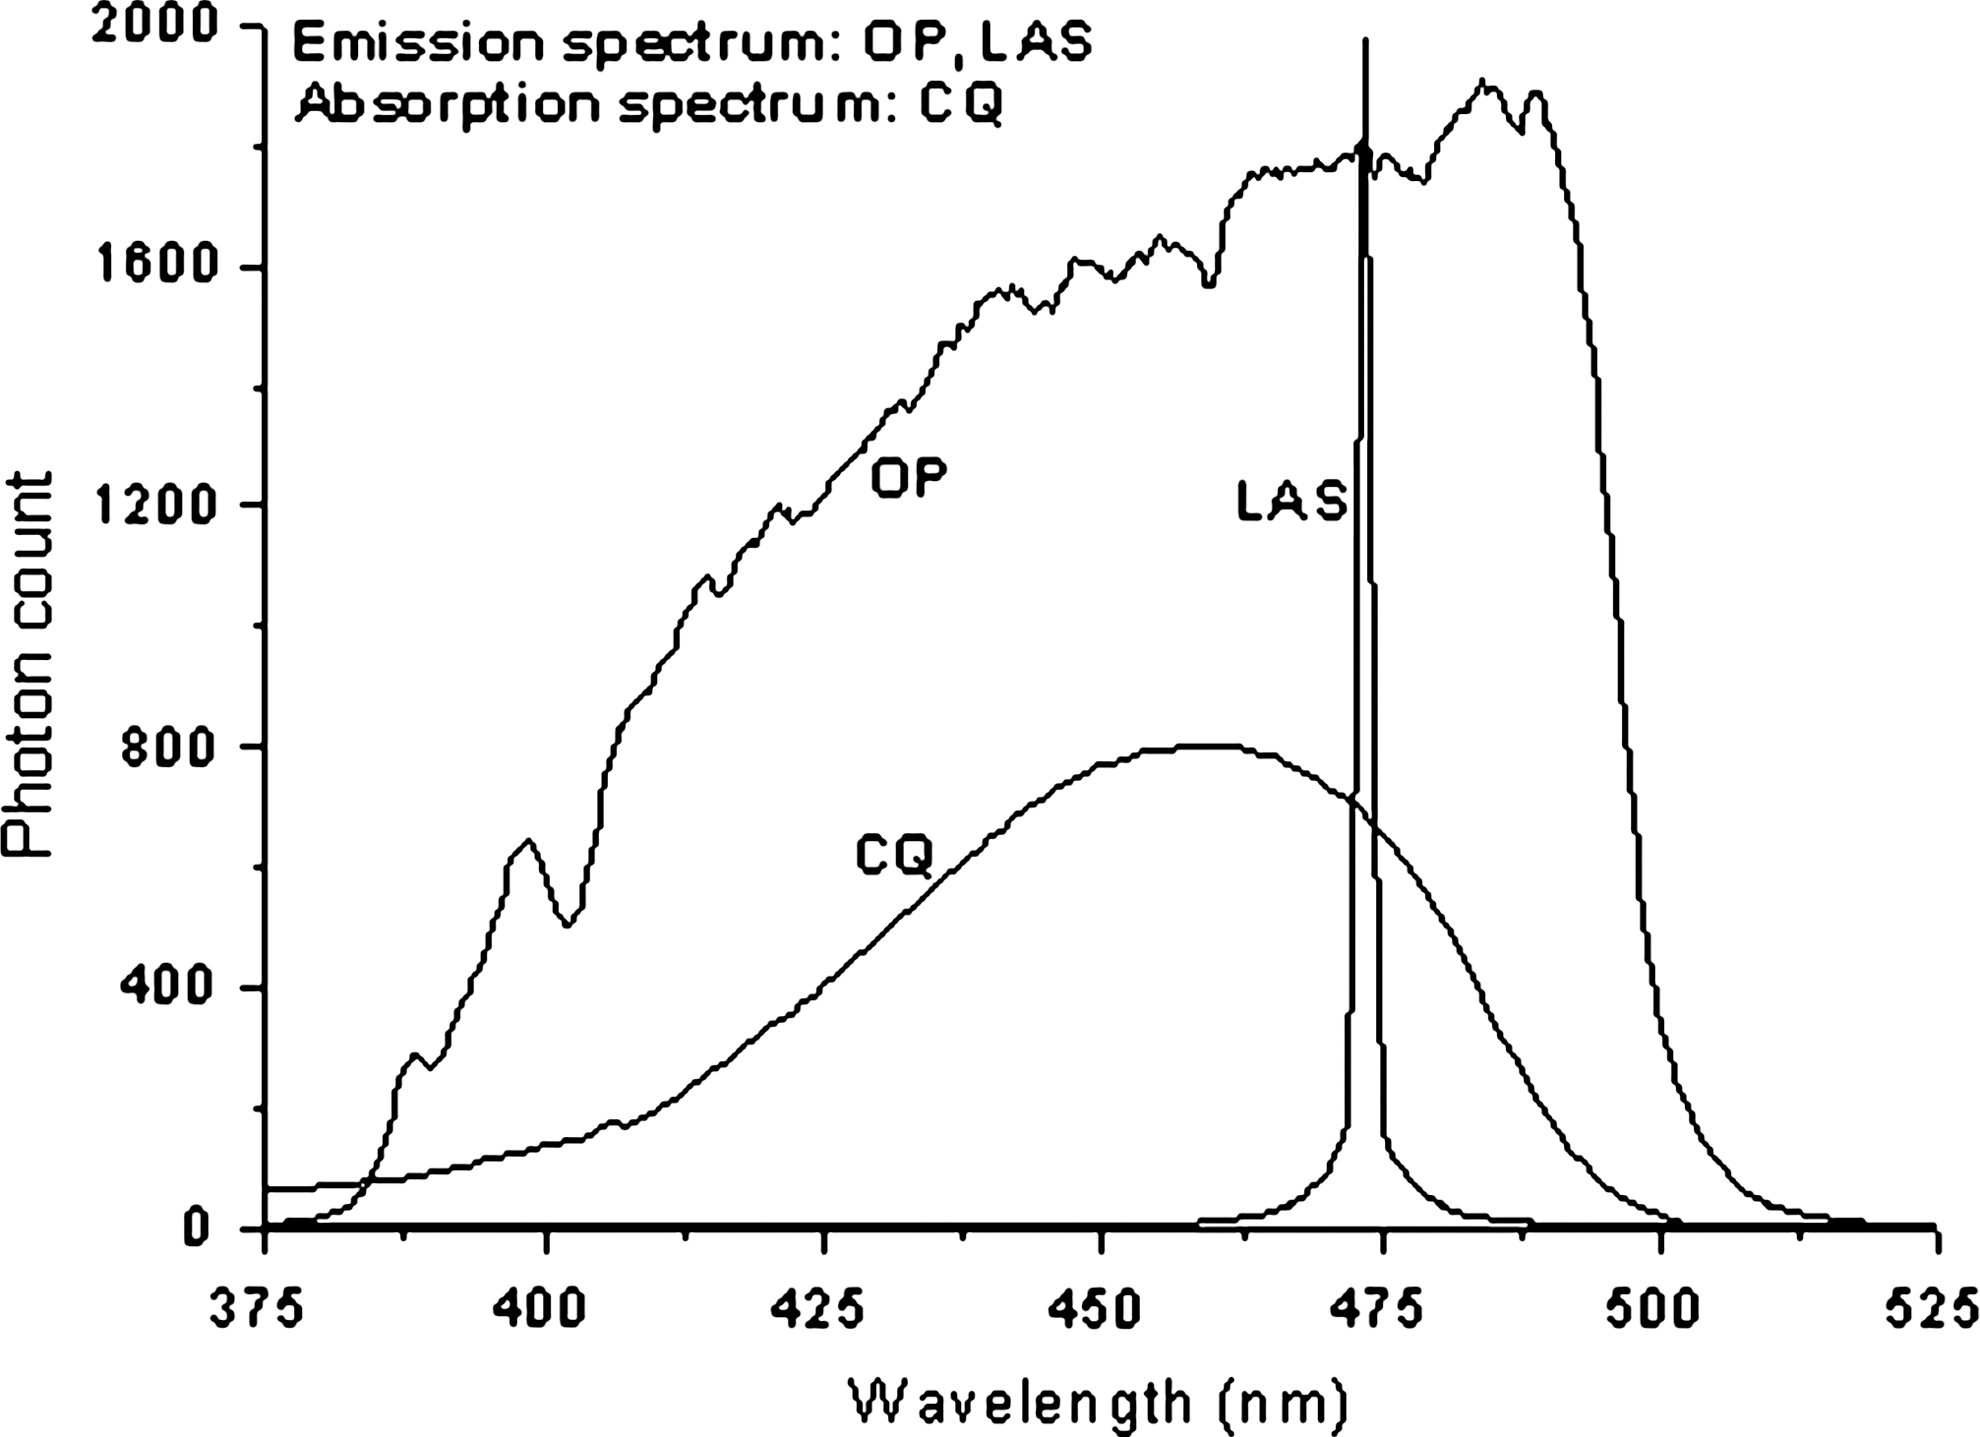
Emission spectrum of the light sources (LAS, OP) and the absorption spectrum of the photoinitiator (CQ).
CX, Ceram X; GD, Grandio; PM, Premise; Z3, Z350; P60, Filtek P60; TC, Tetric Ceram.
Bis-EMA, Bisphenol A ethoxylated dimethacrylates; Bis-GMA, Bisphenol A digycidyl methacrylate; TEGDMA, Triethylene glycol dimethacrylate; UDMA, Urethane dimethacrylate.
According to the manufacturers.
Measurement of polymerization shrinkage
The amount of polymerization shrinkage (n = 5 for each condition) during the light-curing process was measured using a linometer (RB 404, R&B Inc., Daejon, Korea). The resin was located between the covering slide glass and aluminum disc (the specimen stage over the shrinkage sensing part). A metal mold (inner diameter, 4 mm; thickness, 2 mm) was placed over the aluminum disc and filled with resin. After being completely filled with resin, the metal mold was removed (at this time one resin cylinder was made). A slide glass was then secured over the resin. The end of the light-guide (OP) made contact with the top surface of the slide glass. The resin was irradiated for 40 sec with the previously mentioned light intensities. As the resin polymerized, it shrank toward the light source and the aluminum disc under the resin and then moved toward the light source. The polymerization shrinkage was measured automatically for 130 sec using the non-contacting inductive gauge. The resolution and measuring range of the shrinkage sensor were 0.1 and 100 μm, respectively.
Measurement of mass change (water sorption and solubility)
For the mass change measurements (water sorption and solubility), the specimens (n = 10 for each case from each product) were prepared according to the ISO 4049 standards. 5 A ring-type metal mold (inner diameter, 15 mm; thickness, 1 mm) was placed over the thin slide glass. Each resin was placed in the mold and the top surface was covered with a thin slide glass. After pressing the top surface, light curing was performed for 40 sec. According to ISO 4049 standard, each specimen received nine overlapping steps of light irradiation for 360 sec on one side. The reverse side was then treated in a similar manner. The wall of the metal mold was pasted with a resin separator to allow easy removal of the specimen from the mold after light curing.
The specimens were removed from the mold and placed in a desiccator for 22 h at 37°C and then for 2 h at 24°C. Subsequently, the weight was measured to an accuracy of ± 0.001 mg (according to ISO 4049 standard, accuracy of ± 0.1 mg is adequate) using an analytical balance (Sartorius CP2P, Goettingen, Germany). This cycle was repeated until a constant mass m1 was obtained (in this study, a deviation <0.001 mg was assumed to be constant). The specimens were then immersed in distilled water (37°C) for 7 days. At this time, each specimen was placed in a tube filled with 15 ml of water. After 7 days, the specimens were removed from the tube, and the water on the surfaces was blotted away until there was no visible moisture. The specimen was then waved in air for 15 sec, and weighed (m2) 1 min after removal from the tube. Subsequently, the specimens were placed in a 37°C desiccator and weighed every 24 h until a constant mass (m3) was obtained. The specimen volume (V) was determined by measuring the specimen diameter at right angles to each other and the thickness at the center of the specimen as well as at four equally spaced points on the circumference using Vernier calipers (series 530, Mitutoyo, Tokyo, Japan) with an accuracy of 0.02 mm. The level of water sorption (Wsp) and solubility (Wsl) were calculated using the formula Wsp = (m2 – m3)/V and Wsl = (m1 – m3)/V, respectively, where V (mm3) is the specimen volume, and m1 (μg), m2 (μg) and and m3 are: the mass of the specimen prior to immersion, its mass after immersion for 7 days at 37°C, and its mass after immersion and drying, respectively.
Statistical analysis
The data for polymerization shrinkage, water sorption, and solubility was analyzed by ANOVA at the 95% confidence level. A Tukey's test was then used for a multiple comparison when deemed necessary.
Results
Figure 1 shows the emission spectrum of the light sources used in this study along with the absorption spectrum of CQ, which is commonly included in light-curing dental resin composites. The emission spectrum of OP matched completely with the absorption spectrum of CQ, whereas the emission spectrum of LAS matched the absorption peak of CQ only at its tail part.
Table 2 shows the maximum polymerization shrinkage (μm) during light curing. Among the specimens, TC and P60 (hybrid composite resins) showed the highest (18.1 ± 1.0 or 16.4 ± 1.3 depending upon the light source) and lowest (12.3 ± 0.9 or 13.1 ± 0.7 depending upon the light source) shrinkage, respectively, whereas the remaining nanocomposite resins (CX, GD, PM, and Z3) showed similar shrinkage between the two maximum and minimum values. The amount of polymerization shrinkage obtained using the two light sources was similar (p > 0.05).
CX, Ceram X; GD, Grandio; PM, Premise; Z3, Z350; P60, Filtek P60; TC, Tetric Ceram.
Statistically significant difference on product is shown by superscript lettersA,B. Same letters are not significantly different (p > 0.05). For the light source, no post hoc test was performed because there is no significant difference between values obtained from the different light sources.
On p-value, the letter β denotes product.
Figure 2 shows the polymerization shrinkage profile of the specimens light cured using LAS (Fig. 2a) and OP (Fig. 2b). Immediately after light curing for 40 sec, the specimens light cured using OP showed a more apparent second peak than that obtained using LAS.
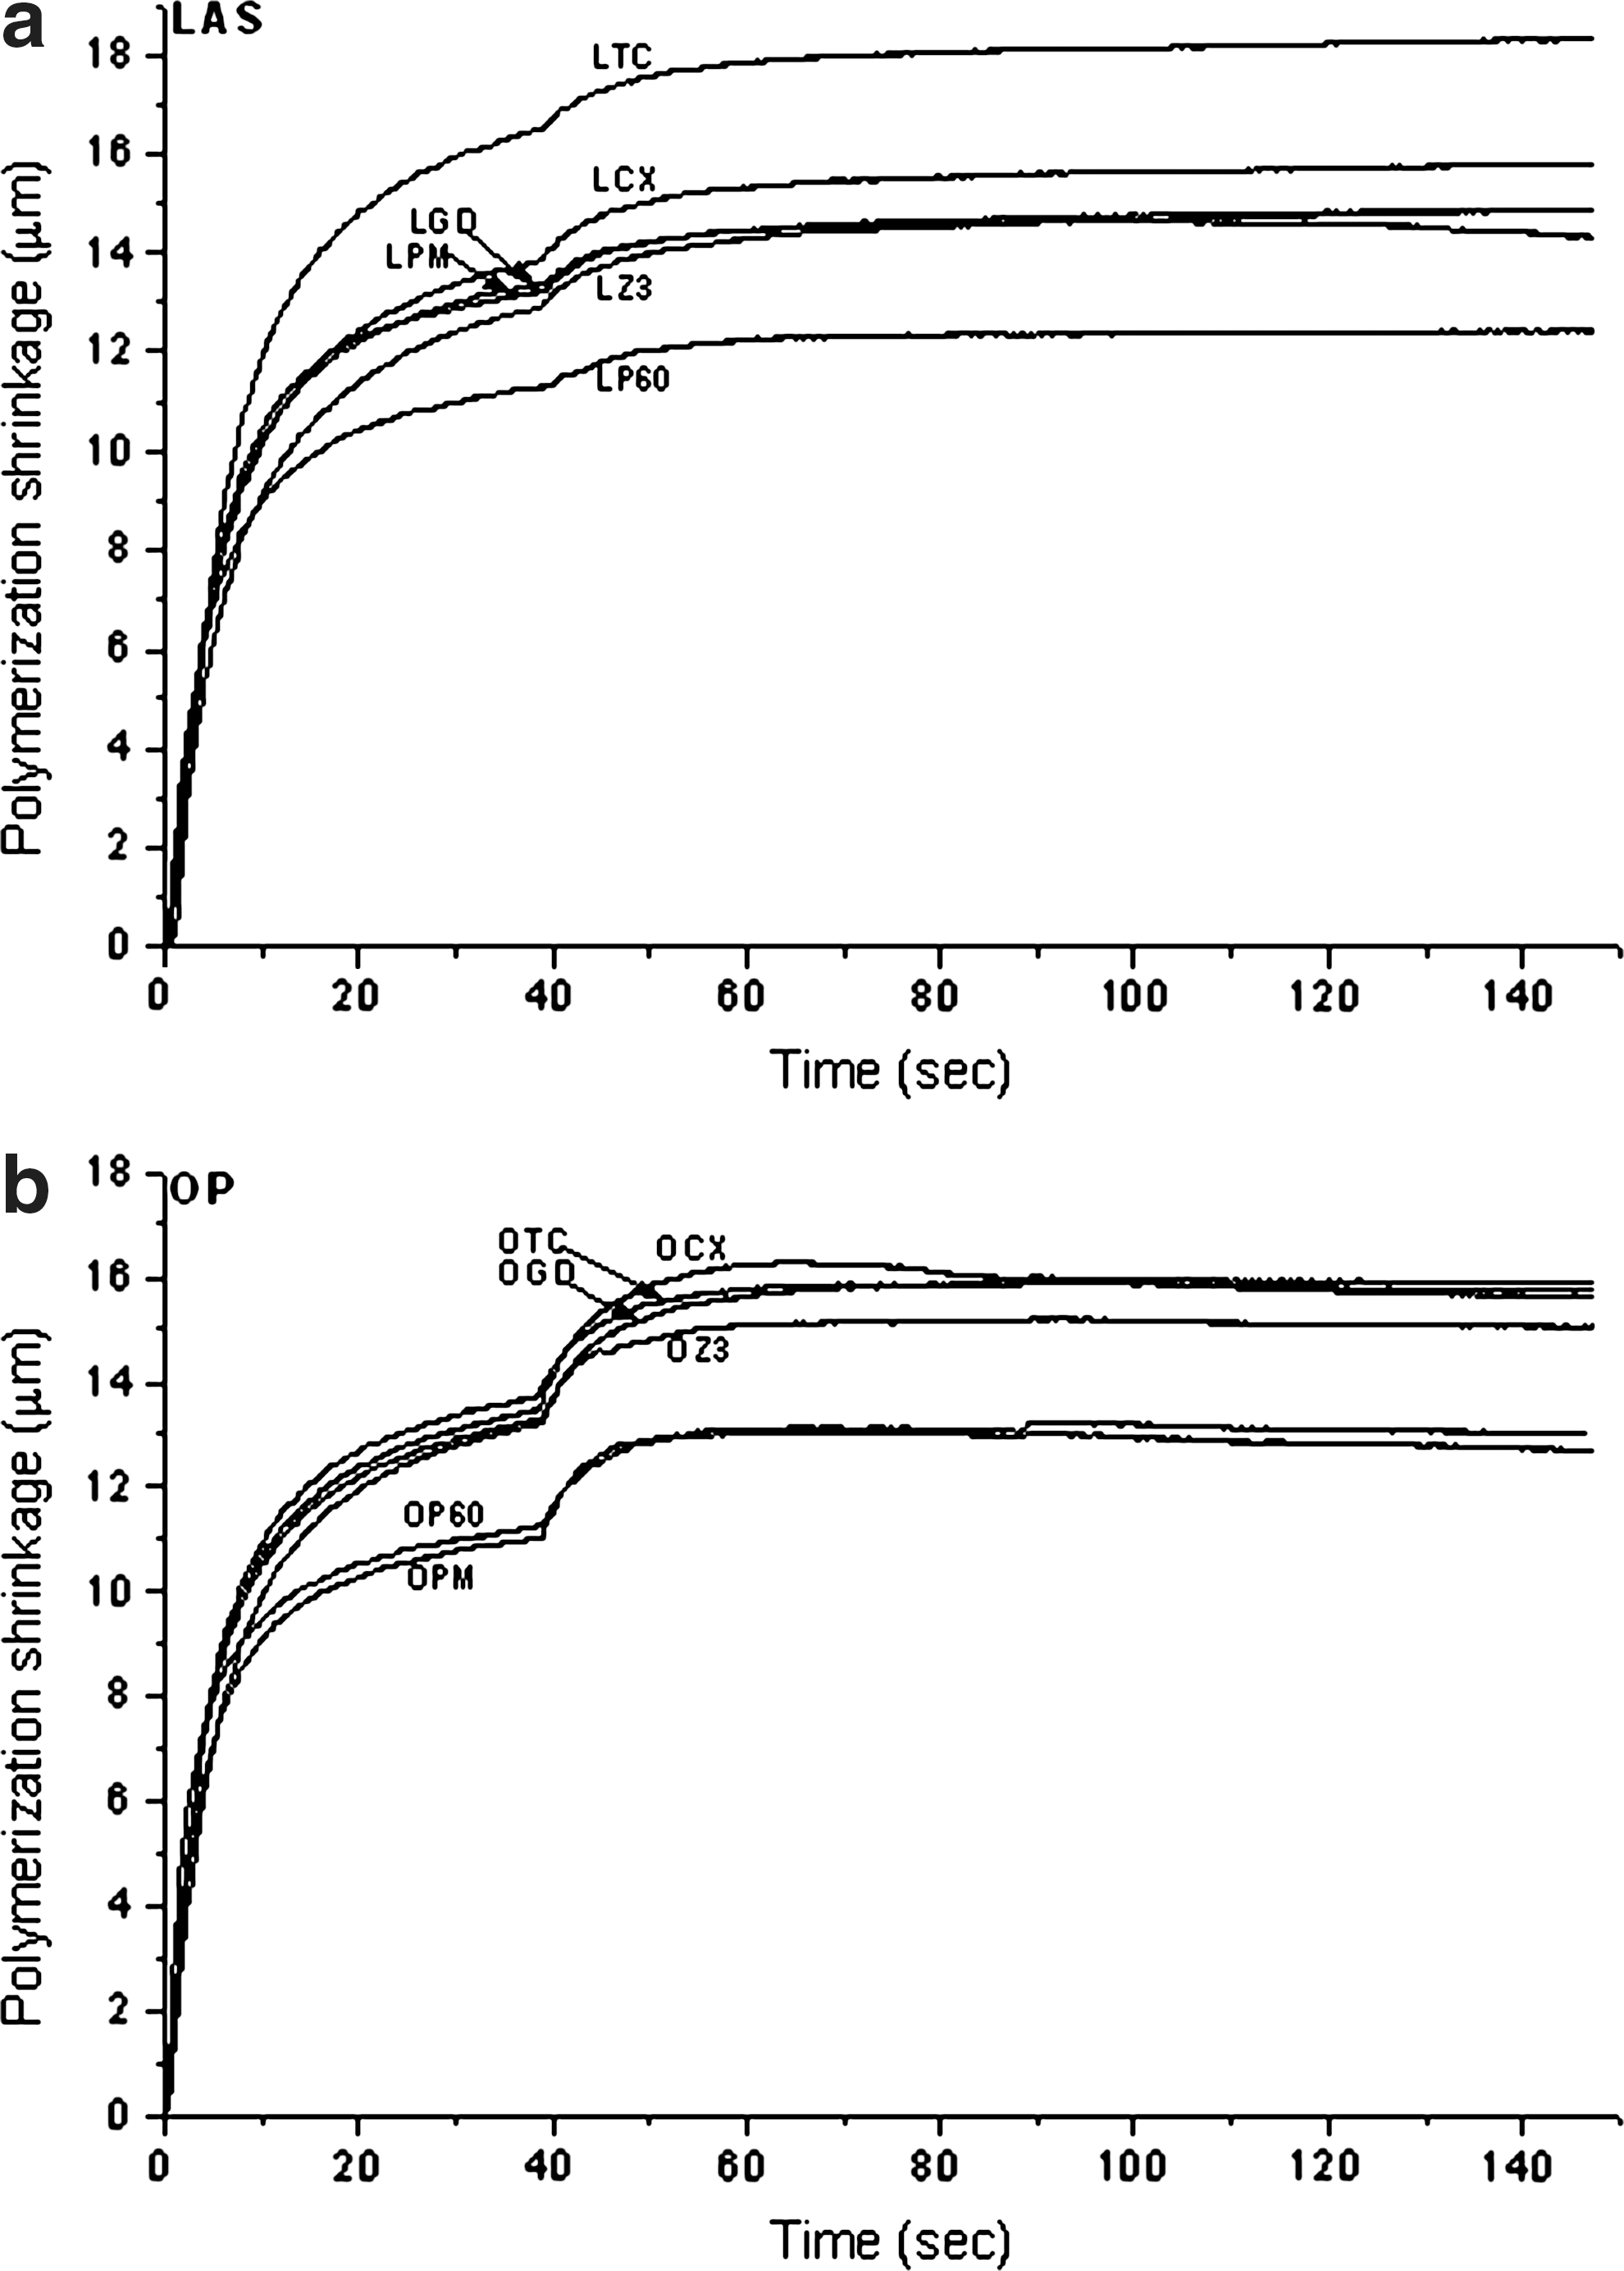
Polymerization shrinkage profile of the specimens during and after the light curing using LAS (
Table 3 shows the water sorption (μg/ mm3) and solubility (μg/ mm3) of the specimens light cured using either LAS or OP. The specimens light cured using the different light sources showed similar water sorption. Among the specimens, Z3 and GD showed the highest (24.1 ± 0.8) and lowest (11.3 ± 0.6) water sorption, respectively, depending upon the light source used. In the case of solubility, the specimens light cured using LAS showed a significantly higher solubility than those cured using OP. The maximum solubility was ranked from PE (6.6 ± 0.3 or 1.6 ± 0.1 depending upon the light source). P60 showed the lowest solubility (2.4 ± 0.4) when light cured using LAS, whereas a negative (−1.3 ± 0.6) solubility was observed when they were light cured with OP.
CX, Ceram X; GD, Grandio; PM, Premise; Z3, Z350; P60, Filtek P60; TC, Tetric Ceram.
Statistically significant difference on product is shown by superscript lettersA,B. Same letters are not significantly different (p > 0.05). For the light source in the water sorption, no post hoc test was performed because there is no significant difference between values obtained from the different light sources.
On p-values, the letters α and β denote light source and product, respectively.
Discussion
The polymerization of dental resin composites is initiated by irradiating the material with blue light. Blue light is essential for light curing because it activates the CQ contained in the resin matrix. Thus far, several different light sources have been used to generate blue light: QTH units, xenon lamp-based plasma arc units, LED units, and argon lasers. The QTH light used in this study emits a blue light at wavelength of 400–500 nm by filtering the white light emitted from the bulb. The light emitted from the QTH unit easily diverges in a similar manner to normal light. Such divergence significantly attenuates the initial light intensity with increasing distance between the light guide and specimen. During light curing, the light intensity can easily change if the distance is not kept constant. The advantage of QTH light is its excellent match with the absorption spectrum of CQ. According to the report by Rueggeberg et al. 17 , light irradiation with 400 mW/cm2 for 40 sec is sufficient to cure the composite resins to a 2-mm thickness. 17 Most QTH lights available on the dental market emit a much stronger light than this critical value. Nevertheless, because QTH light-curing units use a lifetime limited bulb, they require frequent replacement and maintenance to maintain reliable light quality.
The superiority of lasers over other types of lights is a result of their monochromaticity and coherence. In the case of the argon laser (the same as the DPSS laser), one of its emission frequencies (488 nm) matches the absorption peak of CQ at its tail part. Because all the photons emitting from the argon laser have the same wavelength, they can effectively activate the photoinitiator. The usefulness and efficiency of an argon laser in the polymerization of dental restorative materials has been demonstrated. 18 –20 Nevertheless, its high price and bulkiness precludes its routine use in dental clinics. A DPSS laser with an emission at 473 nm has many similarities to the argon laser. The wavelength of the DPSS laser matches the absorption peak of CQ more closely than does that of the argon laser. The advantages of DPSS lasers over argon laser are their price and compactness. However, only a few studies have evaluated the applicability of 473 nm in the polymerization of light-curing dental restorative materials. 13 –16
Polymerization shrinkage occurs when the monomers convert to a polymer network. At that time, the molecular spacing reduces as a result of polymerization. Generally, polymerization shrinkage depends upon a variety of factors, such as the filler loading, filler type, and composition of the resin matrix. 21 –24 According to studies, the total shrinkage of the specimens (or degree of conversion) increased with decreasing molecular weight of the monomers. 25 –27 Among the monomers used in this study, Bisphenol A ethoxylated dimethacrylates (bis-EMA and triethylene glycol dimethacrylate (TEGDMA) had the highest and lowest molecular weight, respectively [bis-EMA, 540; bisphenol A digycidyl methacrylate (bis-GMA), 512.6; urethane dimethacrylate (UDMA), 470; TEGDMA, 286.2]. Therefore, the total shrinkage of the specimens increases (or decreases) as a percentage of TEGDMA (bis-EMA) in the specimen increases. Both the filler loading and composition of the monomers may influence the result. GD and PM contain the highest amount of filler in their resin. On the other hand, CX and Z3 contain the lowest filler content (vol %) among the specimens tested in this study. The reason for the similar shrinkage in this contrasting situation is unclear. Both the filler loading and composition (content) of the monomers may be related in some complicated manner to the results obtained. Immediately after light curing for 40 sec, the specimens light cured using OP showed the initiation of a more apparent second peak in the 40–60 sec interval. The reason for such increase in the shrinkage profile may be related to the thermal expansion of the specimen by the heat from the light source and the exothermic heat of the specimen during the light curing. According to reports, the temperature rise on the composite resins reaches to the point that feels hotness. 28,29 Because of the heat from the QTH bulb, the heat is transmitted through the light guide, and through exothermic reaction, the specimen can expand during the light curing while the specimen undergoes polymerization shrinkage. However, if there is no light, the heat supply from the QTH bulb and the exothermic reaction will cease, and then shrinkage will occur dominantly without suppression.
When the filled dental materials come in contact with water (oral fluids) in the oral cavity, water sorption from the surface occurs mainly through the resin matrix. Within the resin matrix, the absorbed water can fill the pores made from the unreacted molecules. 3 In addition, water on the specimen surface and within the pores softens the resin matrix, resulting in the leaching of unreacted monomers, unbound components, and water-soluble elements. 30,31 The strength, volume, color stability, and biocompatibility of the dental filling materials can be adversely affected by this water sorption and solubility, even though some positive effects, such as marginal sealing by hygroscopic expansion, can be expected. 32 –34 ISO 4049 standard requires light-curing dental materials to have a maximum water sorption and solubility <40 and 7.5 μg/ mm3, respectively. The materials tested in this study satisfy this guideline. The fact that GD had the lowest water sorption was attributed to its highest filler volume. However, an explanation for the fact that Z3, which has the lowest filler volume, had the highest water sorption, may not possible. Generally, the amount of water sorption depends upon the monomer composition, surface condition, degree of polymerization, pore size, and volume within the resin matrix. 34 –37 A generally high (low) solubility was observed in the specimens showing high (low) water sorption. The relatively high solubility of TC may be partly caused by the leaching of the contained fluoride. TC contains Ba-Al-F-silicate glass and YbF3 as part of its fillers. It is unclear why there was a significantly higher solubility in the specimens light cured with LAS than in those light cured with OP, despite their similar water sorption. It might be related to the lower degree of polymerization. As the light intensity of LAS was 50% that of OP, the lower degree of conversion and more retention of the unreacted monomers would be natural. Such a state can increase the solubility of the LAS-cured specimens compared to those of the OP-cured specimens. The negative value from P60 suggests an increase in the resulting mass than before the immersion in distilled water. One of the possible reasons is the formation of a new compound within the structure. The glass filler and metal oxides are known to form metal hydroxides as reaction products when they interact with water. 4,38 The absorption of any substance or incomplete dehydration was not possible because the specimens were immersed in distilled water and fully dried.
Conclusions
The specimens light cured using LAS showed similar maximum polymerization shrinkage and water sorption to those cured using OP. In the case of solubility, the specimens light cured using LAS showed significantly higher values than those cured using OP. However, the maximum water sorption and solubility obtained using LAS were lower than the maximum values set by the ISO 4049 standard. The DPSS laser of 473 nm appears to have high potential as a light source for the light curing of dental restorative materials. For more concrete conclusions, future studies estimating the degree of polymerization by the DPSS laser, using various mechanical tests, will be needed.
Footnotes
Acknowledgment
This study is supported, in part, by NC Biotech Center, NIH/NIDCR K08DE018695, and R43DE020971.
Author Disclosure Statement
No conflicting financial interests exist.