
Abstract
Introduction
Fluorescence has been widely investigated. A review 13 describes general changes occurring in the state of cell and tissue during physiological and/or pathological processes. They produce modifications in the amount and distribution of endogenous fluorophores as well as in the chemical–physical properties of their microenvironment. Elastin, 14 collagen VI, 15 collagen VII, 16,17 flavins, 13 lysophospholipids, 18 and lipofuscin 19 are the molecules containing fluorescent groups which have been confirmed as key players in pathological processes including cancerogenesis and inflammation. Most of the fluorescent spectral properties of these products of cell activity are well known. 20
Our experience and that of other researchers has confirmed that ultraviolet excitation-based diagnostics, which exploit live cervical tissue fluorescence spectra, are complicated because of the overlap of fluorescence from the epithelium and the stroma. 10,21 –24 Content of the cervical smear exhibits strong visible fluorescence derived from cervical epithelium. 25,26 Compared with other optical techniques, the fluorescence detection-based equipment is less complicated. The aim of this work was to study the value of fluorescence-based photodiagnosis for cervical pre-cancer screening at the point of care. The main task of the study was to discover the spectral regions where the differences between pathology groups are most expressed and suitable for the creation of a diagnostic algorithm.
Methods
Samples and setup
With the permission (N61) of the Lithuanian Bioethics Committee and informed patient signed consent, 78 samples of normal and high-grade squamous intraepithelial lesion (HSIL) by cytology were investigated: 38 samples constituted a “normal” group, and 40 samples constituted an HSIL group. HSILs were confirmed by histology as a CIN2+ (precancerous state, second degree or higher cervical intraepithelial neoplasia) group of 28 samples, and a cervicitis group of 12 samples; 1 sample of CIN1 (first degree cervical intraepithelial neoplasia) did not allow us to form a separate group. Diagnosis of the “normal” group was confirmed only by a cytological test, as a biopsy is not performed unless a cytological test has indicated pathology. Sediments of the liquid cervical smear supernatant dried on a quartz plate were used as the specimens for this investigation.
The fluorescence of a sample was excited by the third harmonics (wavelength 355 nm) of sub-nanosecond (<1 ns), high pulse repetition rate (10 kHz), single longitudinal mode passive Q-switched Nd:YAG microlaser STA-01-TH (Standa, Ltd.). A UFS-1 filter was used for the elimination of the first and the second harmonics. A fiberoptic reflection probe was used to excite and to collect the fluorescence of samples. The fluorescence signal was registered in three locations of each sample by Ava-Spec-2048 spectrometer.
Evaluation of spectra
Measurement of the fluorescence of samples deposited on a substrate requires accurate removal of the substrate contribution. It was found that the sample fluorescence was absent in a region marked “a” in Fig. 1 (>800 nm). The removal of the quartz fluorescence contribution was based on the evaluation of the magnitude of quartz signal according to the specific quartz fluorescence peak shown in Fig. 1 as a “b” range. In order to get the specimen spectrum, the fluorescence of quartz was normalized multiplying it by the factor obtained as a ratio of peak intensity in the sample to peak intensity in quartz and subtracted from the sample spectrum. The residual signal in the region >800 nm was accepted as a noise level. The total noise of the fluorescence spectrum was reduced by averaging up to 25 adjacent points.
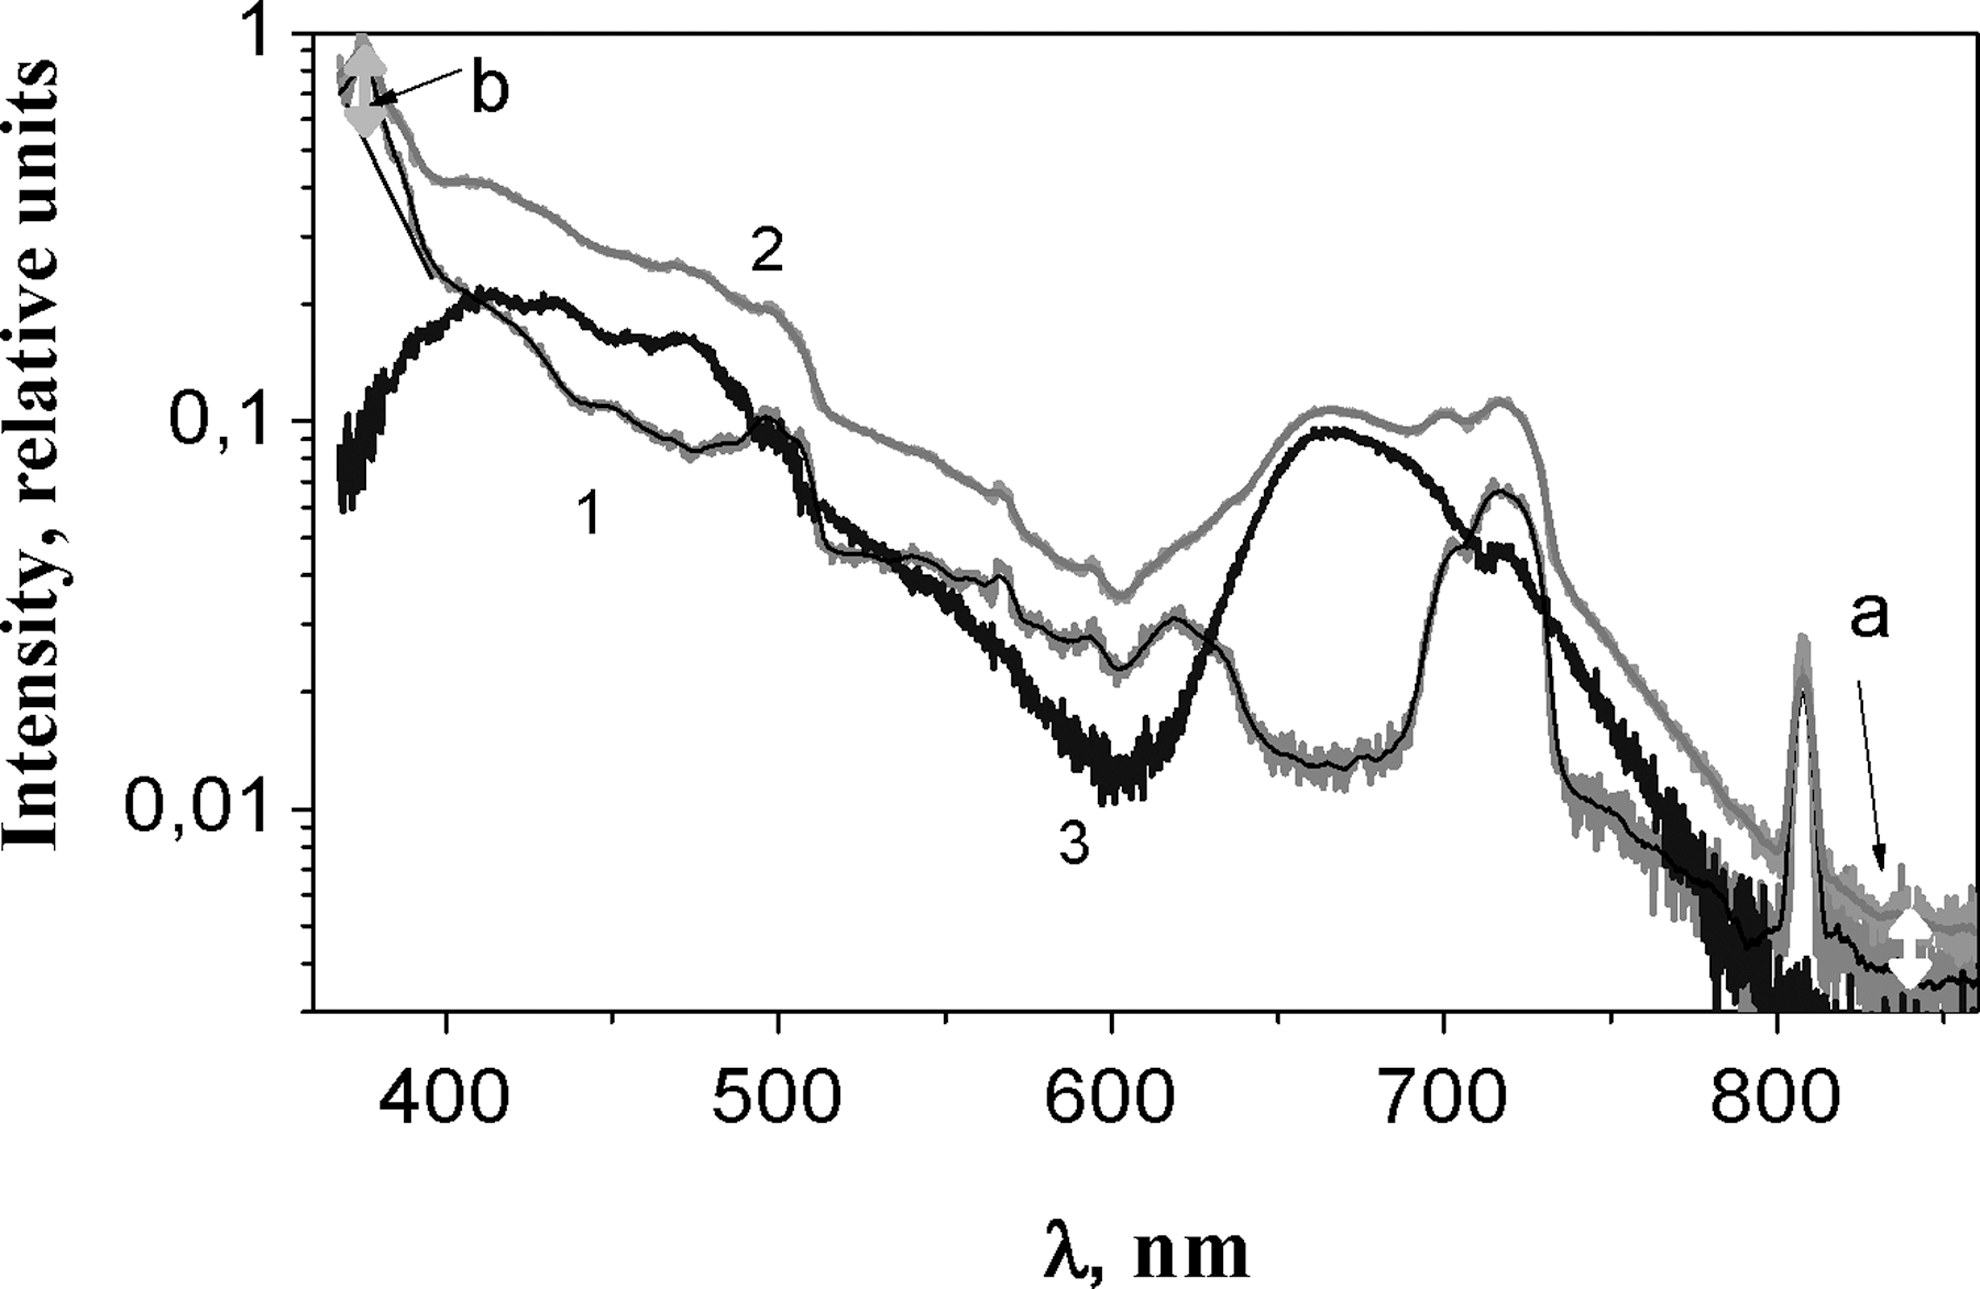
Spectra of (1) a substrate response and (2) a specimen. Spectrum of sample (3) was obtained by subtracting the spectrum of substrate. “
Data approximation
The fluorescence spectra of biomedical samples are complex as a result of the existence of different fluorophors in the tissue; therefore, different methods have been used for their analysis. We use an approximation to divide the spectrum into a series of Gaussian components. 27 This allowed us to follow the changes of the spectrum in its definite regions and to use a standard procedure of analysis. The spectral components were characterized using the parameters of Gaussian curves: A j – total area under the Gaussian curve from the baseline, w j – width of the peak at a half height, x j – position of the peak maximum where j indicates the j th Gaussian curve. This approximation is quite formal. However, the positive results speak in favor of the use of this method, although more detailed investigation into the nature of the components is still necessary. By means of Gaussian curves, two steps of the analysis of experimental spectra were performed, and each of them had certain preferences.
Method I
The division of the spectrum into components was performed by the method of multi-peaks analysis (Origin software version 7, OriginLab Corporation). To ensure equal conditions for all cases, a maximum number of eight Gaussian curves was chosen. After the approximation of all spectra, Gaussian curves were grouped into components according to the peak center positions (xj). An example of a sample spectrum with Gaussian components is presented in Fig. 2.
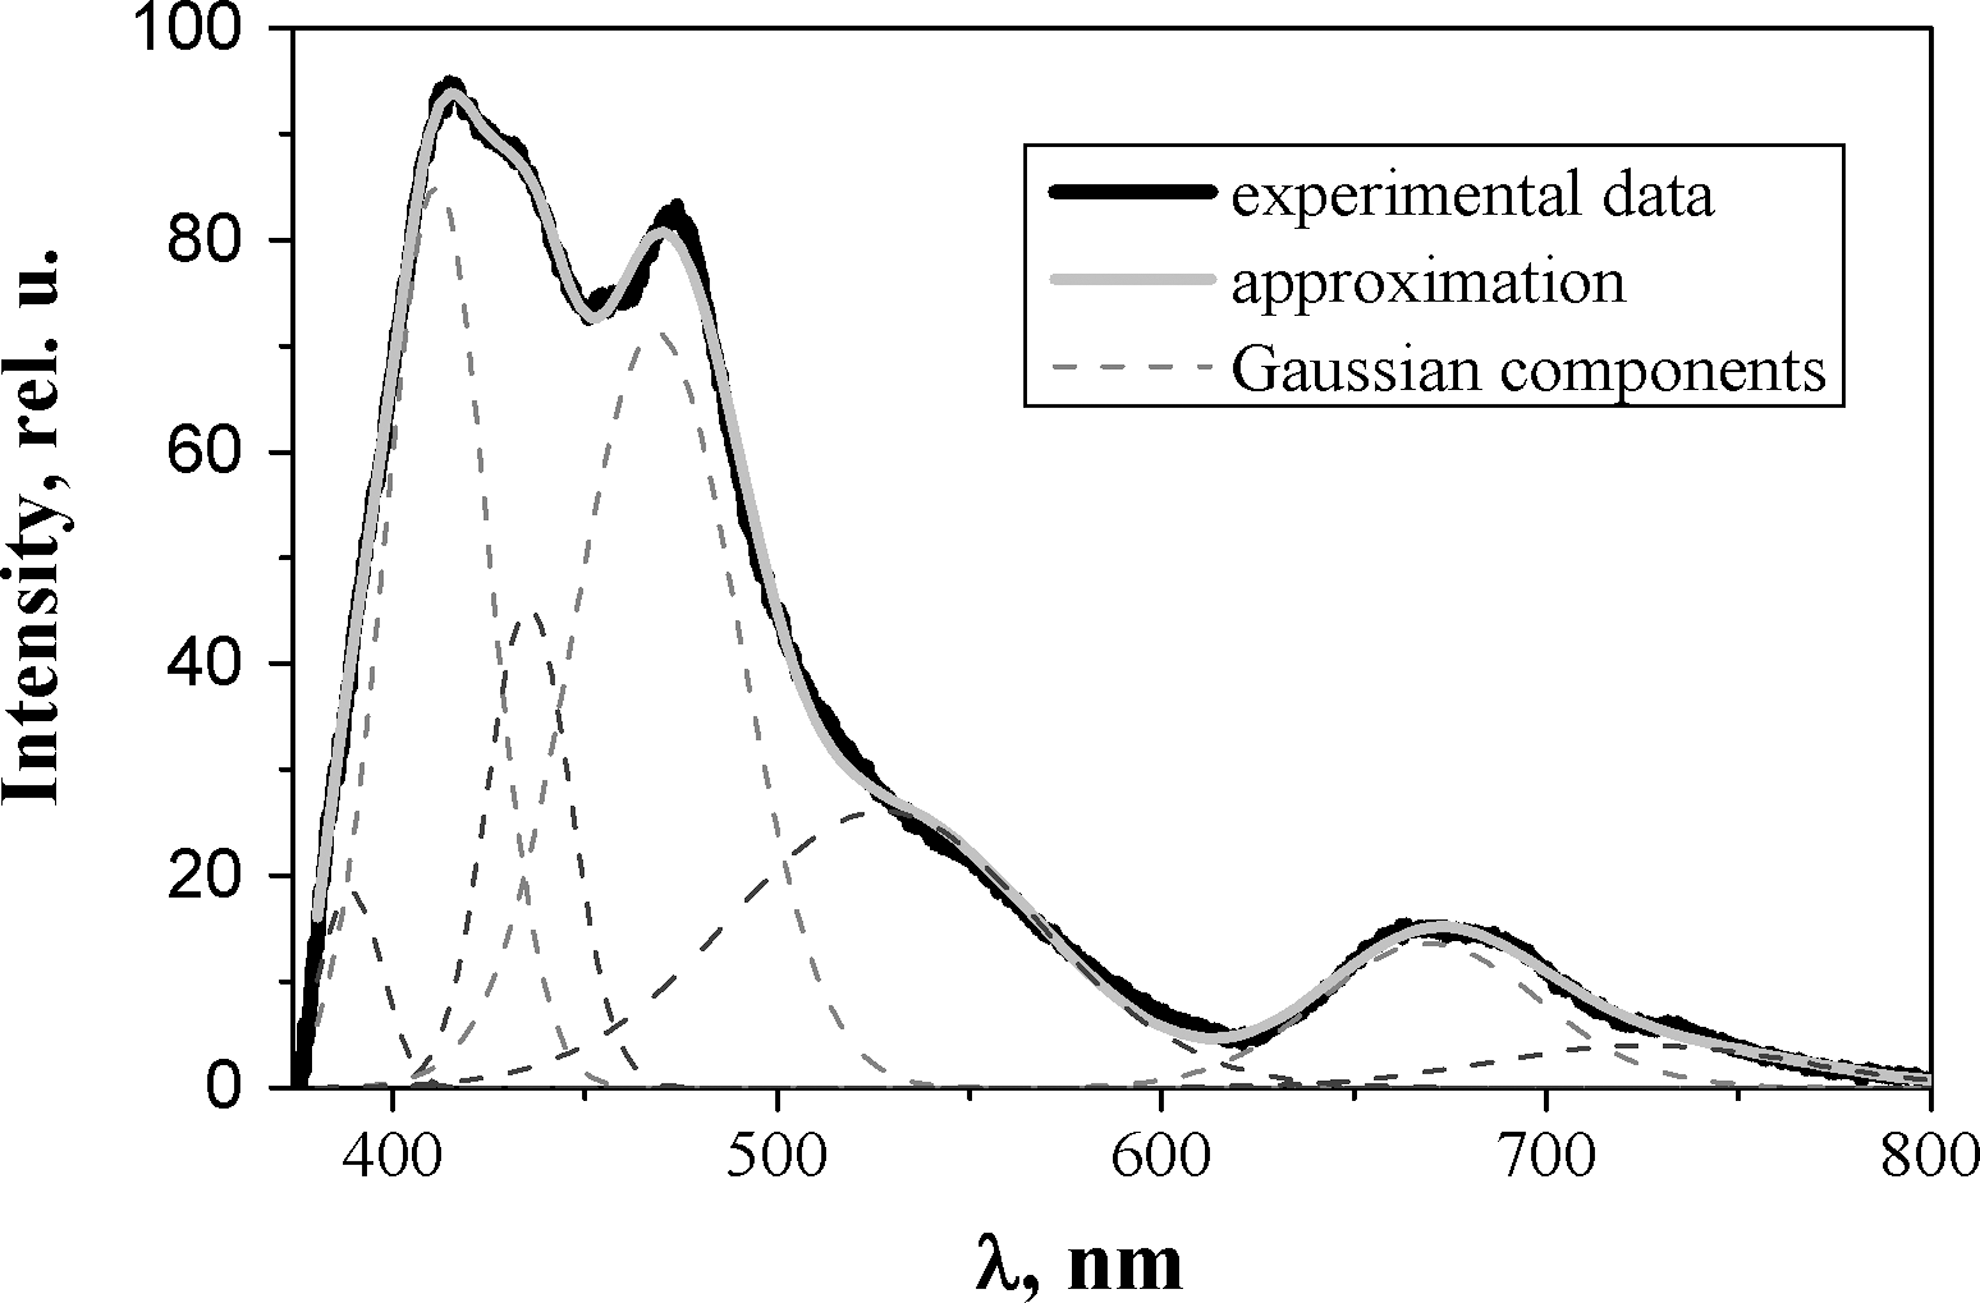
The example of experimental spectra approximated with a set of Gaussian components using method I. Black line, experimental data; solid grey line, the approximation; dashed lines, the Gaussian components.
Method II
Based on the results of method I, this method also involves curve fitting. It was evident that some distributions of the parameters of fitting curves exhibited a doublet structure. Limits of the variation of parameters (A j , w j , x j ) were introduced and optimal parameters (initial values and the boundaries) were found. Boundaries within which the parameters of Gaussian curves were allowed to vary were introduced into method II. Optimization was conducted on the basis of the assumption of 12 components, and initial parameter values and boundary positions were manipulated during roughly 25 approximations. The following optimization criterion was to be met: a bell-shaped distribution of parameters w j and x j found through the curve fitting, which involves the manipulation of boundaries and initial parameters. Figure 3 demonstrates the distribution of peak values of the components. Exceptions were made for the centers of three components with non-bell-shaped distributions: at 595–625 nm (probably this region could have been separated into two components, but we did not have enough data for the decision), 702–745 nm, and 745–770 nm (Fig. 3). These components mostly had small amplitude, their areas under the components curve in respect to the area under the whole experimental curve were small, and the statistical peak center was not clearly expressed. However, these components were important to ensure optimal parameters of other components.
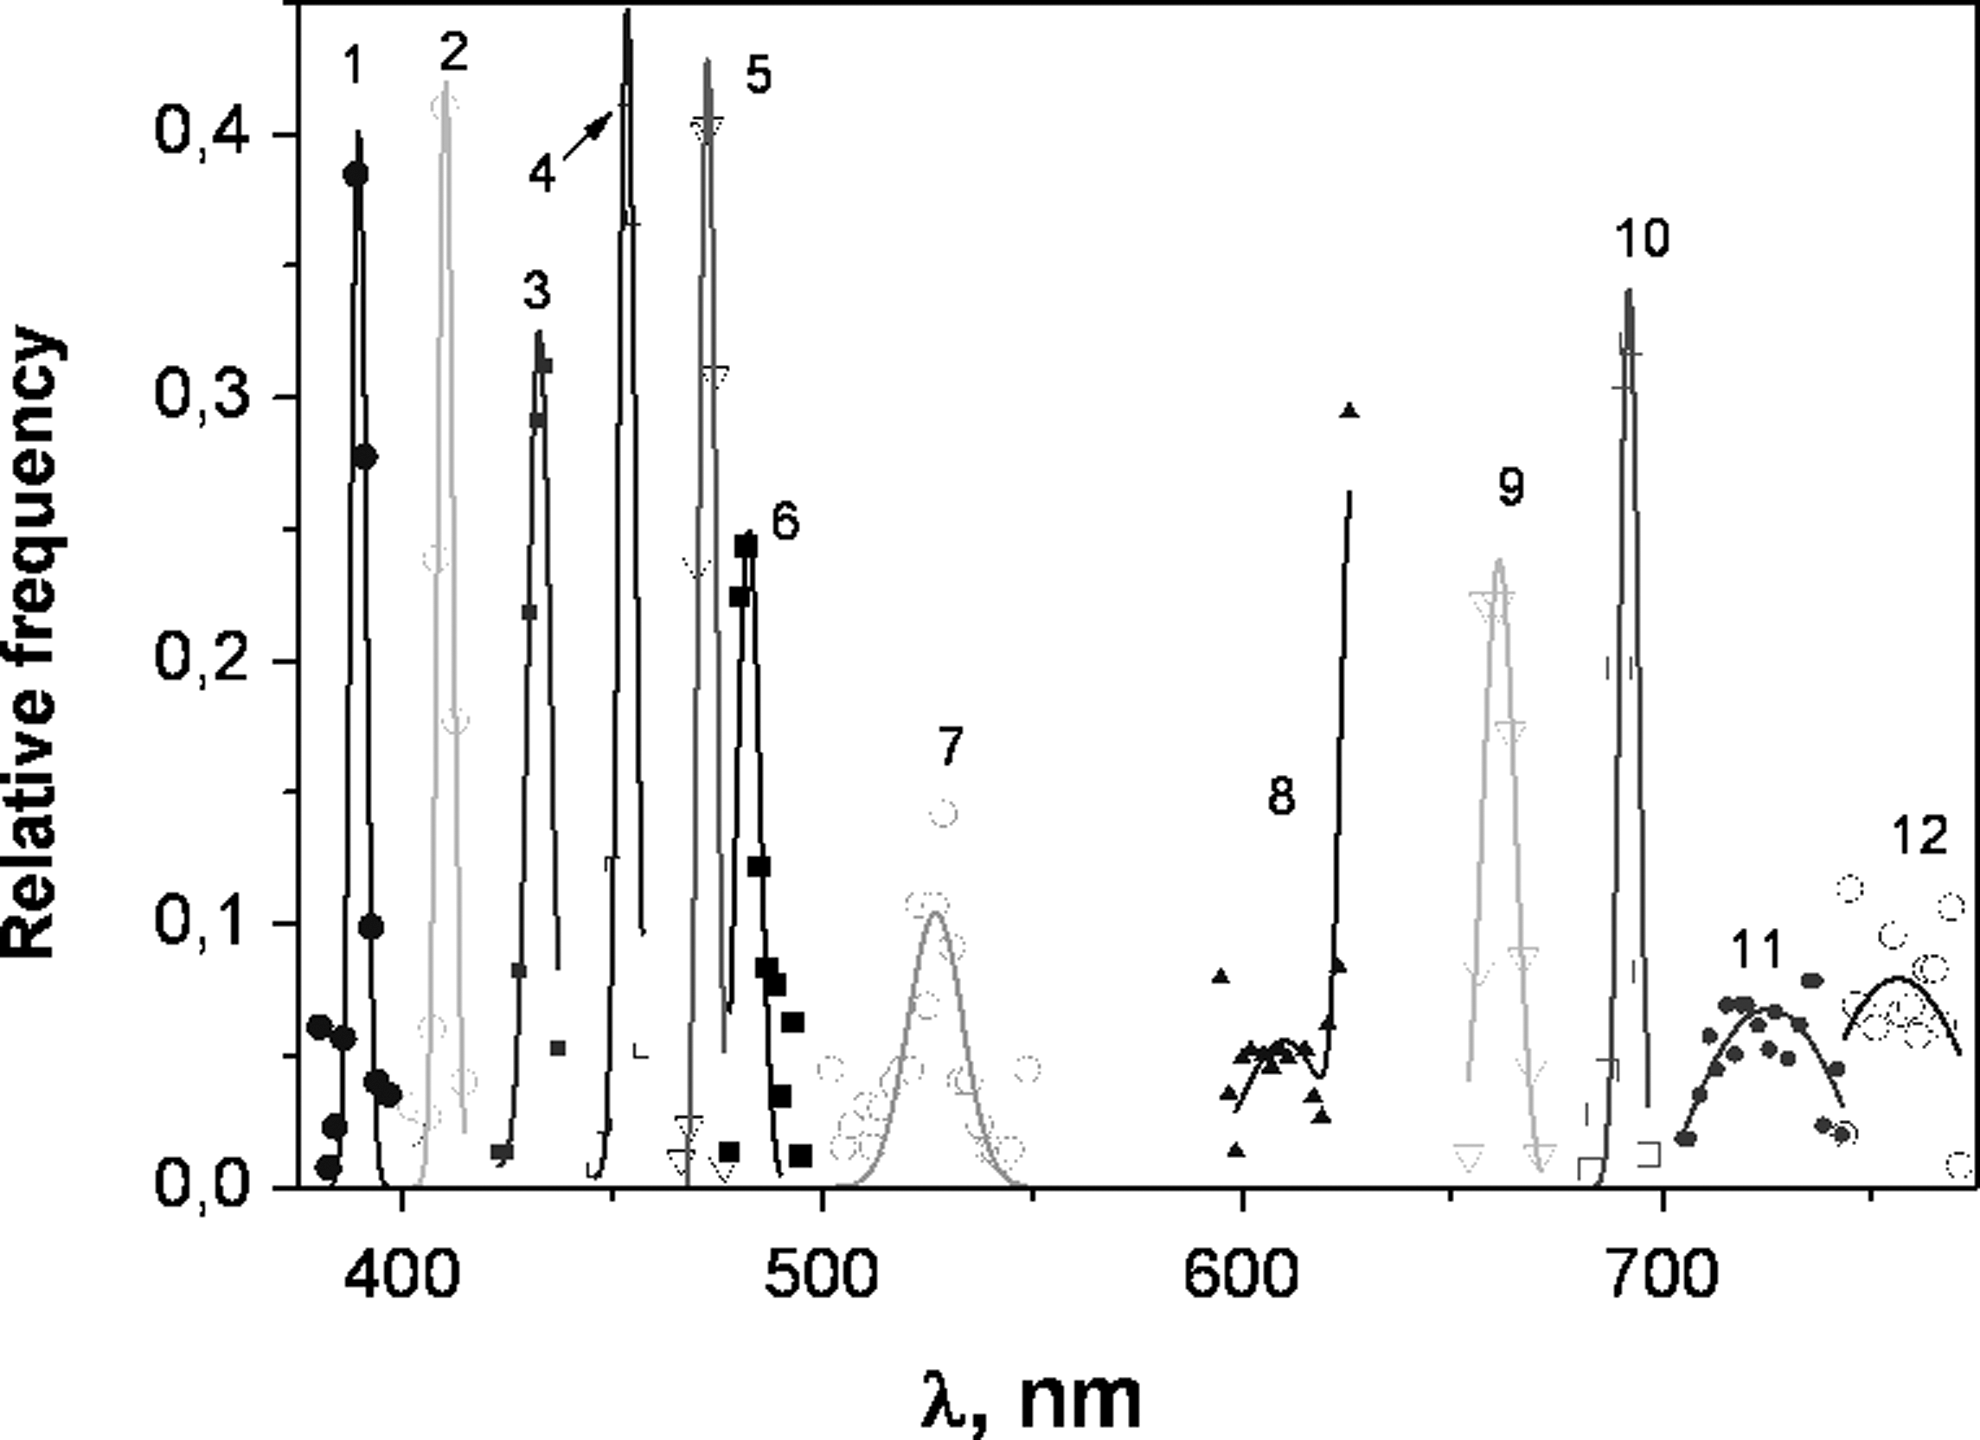
The distribution of Gaussian components' peak values obtained after optimization procedure in method II. Relative frequency is given to each component. The values of peak centers are grouped at intervals of 2 nm. The positions of components' peak centers are in a range: (1) 380–400 nm, (2) 402–416 nm, (3) 424–438 nm, (4) 446–457 nm, (5) 466–477 nm, (6) 478–494 nm, (7) 503–550 nm, (8) 595–625 nm, (9) 655–672 nm, (10) 680–696 nm, (11) 705–742 nm, (12) 745–770 nm. The center position distributions of components 1–7, 9, 10 are bell shaped. The distributions of components 8, 11, 12 are not so clearly expressed, and the lines are a guide for the eyes.
The ratio of spectral components' area to the area under the whole experimental curve (RA) was established for every component. As mentioned previously, the spectra from three points of one sample were registered and RAj values (here j indicates the j th component) from the same specimen were averaged before performing the Mann–Whitney test. If the fluorescence intensity in one or two points (out of three) was low and the noise was strong, these points were excluded from further analysis, and the average of RAj was calculated from two points or one point, respectively. Low fluorescence intensity was observed in nine cases.
A standard linear correlation analysis (Pearson's correlation) was performed for the averaged RAj values of components in method II. In cases in which the Pearson's correlation coefficient was higher than zero, the RAj values of those components were summed. These sums were called “complex components.” If the correlation coefficient was positive, higher values were summed with higher ones, and lower values with lower ones, so that the differences would become more obvious.
Every component of histological/cytological groups (CIN2+ vs. cervicitis; CIN2+ vs. normal and cervicitis vs. normal) as well as combined groups (CIN2+ and cervicitis as positive vs. normal; cervicitis and normal as negative vs. CIN2+; CIN2+ and normal as negative vs. cervicitis) were compared using the Mann–Whitney test, with confidence level α=0.05. The parameter compared is the averaged RAj values. For the cases in which the Mann–Whitney test showed statistically reliable differences between compared groups, receiver operating characteristic (ROC) curves were plotted and area under the curve (AUC) values were calculated using the XLSTAT 2009.5.01 program (Addinsoft SARL). The Youden index J 28 was used to set a statistical cutoff point of the RAj value for the determination of optimal value of sensitivity (Se) and specificity (Sp) for making a decision. J equals to a maximal value of (Se+Sp-1).
Results
Results of the statistical analysis are presented in Tables 1 and 2. Some general comments can be made for each of the methods used.
ROC, receiver operating characteristic; AUC, area under the curve; Se, sensitivity; Sp, specificity; ACC, accuracy; PPV, positive predictive value; NPV, negative predictive value; RA i , relative area of the j th component, where “j” is indicated in column “No”.
ROC, receiver operating characteristic; AUC, area under the curve; Se, sensitivity; Sp, specificity; ACC, accuracy; PPV, positive predictive value; NPV, negative predictive value. Component number (2,3) means that the RA of component j=2 and j=3 were summed.
Method I
Eight Gaussian components were used in this approximation. The Mann–Whitney test showed 13 cases in which RAs of cytological/histological groups differed significantly. ROC analysis revealed that the maximum AUC and positive predictive value (PPV) were achieved comparing normal versus CIN2+ using the component at 402–420 nm (AUC=0.74, se=90.0%, sp=60.7%, index J=77.9%; PPV=76.6%, negative predictive value [NPV]=81.0%). The lowest AUC=0.527 was found comparing CIN2+ versus cervicitis. The lowest PPV=29.6% and the highest NPV=92.5% were reached following the comparison cervicitis versus others using the 480–515 nm component.
Method II
This approximation was performed with 12 Gaussian components. RAs of cytological/histological groups differed significantly in 25 cases according to the Mann–Whitney test. The maximum AUC value was reached in comparing normal versus CIN2+ using the component at 402–416 nm (AUC=0.82, se=85.7%, sp=65.8%, index J=74.2%). If normal groups versus cervicitis were compared and the component at 595–625 nm was used, the maximal values of specificity and accuracy were reached (AUC=0.72, se=41.7%, sp=100%, index J=86.0%). High accuracy was reached in comparing CIN2+ to others using a complex component, which is the RA sum of components at 402–416 nm and 424–438 nm (AUC=0.74, se=50.0%, sp=94.0%, index J=78.2%). The highest PPV was reached by comparing normal versus cervicitis using the 595–625 nm component (PPV=100%, NPV=84.4%). Comparing normal to others and CIN2+ to normal using the complex component 402–416 nm and 424–438 nm, the PPV >90 was reached, and the best AUC (0.82) and the best PPV (100%) values were achieved by applying method II. Method I can give higher sensitivity and method II can give higher specificity. Method I requires experienced personnel to perform the multipeak analysis because of the necessity of manual setting of the initial data. Method II is more automatic.
Discussion
The success of this investigation into the liquid cervical smear supernatant sediment in comparison with earlier works in which a live cervix surface was investigated, may be accounted for by the principle of investigation. The smear consists of all products produced by the processes taking place in the cervix epithelium; therefore, the investigation eliminates the influence of stromal and blood vessel collagen and elastin, which contribute to the cervix's subepithelial autofluorescence. In addition, cell viability-related fluctuations are eliminated in a fixed smear. It summarizes interfering fluorophore information from the squamous, glandular, transition zone (TZ) epithelium; therefore, it eliminates diagnostic problems related to the transformation zone complex anatomy. 21,22,24,29 The results presented earlier demonstrate the differences between normal, cervicitis, and CIN2+ groups that have been established by detecting the main differences in spectral regions at 402–420 nm, 480–515 nm, and 595–625 nm, and also by cooperative response of contributions in the combination of regions 402–416 nm and 424–438 nm. These regions narrow down the spectral regions used for diagnostics in previous works 30,31 that point out the overlap of different fluorophores' contribution, 18,20 and the resulting narrower regions reveal the differences of the previously mentioned contributions better.
Similarly, Millot et al. 32 used confocal fluorescent microscopy involving a 363 nm laser beam for malpighian epithelium cells cytoplasm prepared by Thin-Prep technique. Instead of the whole emission spectrum, the dual wavelength emission images at 425 and 525 nm were compared, and it caused an increase in the analyzed cell number and improve the classification.
In the present study, the region of 355 nm/395 nm (where collagen I fluorescence is maximal according to the excitation/emission matrice) was not found to be important for diagnostics because spectra started to be analyzed at 376 nm, and a contribution of the substrate signal was big in this region (Fig. 1). We can suggested that collagen VII and elastin in 402–416 nm and 424–438 nm spectral region under 355 nm excitation 3,20,33 –38 can be most important fluorophores for the differentiation of cervical smear supernatant sediment.
Additionally, based on our earlier spectroscopy study that demonstrated the difference of emission near 420 nm under 355 nm excitation in cervical smear related to hormone fluctuation during cervical maturation in pregnancy, 38 we suggest the effect of sexual hormones on the group differences in diagnostics. Sexual hormone relations to stromal component changes are established in other works. 39 –41
The fluorescence of smear supernatant sediment at 595–625 nm is important for normal versus cervicitis differentiation and probably corresponds to collagen VI 42 and mucin I, 20 whereas the fluorescence at 480–515 nm, important for the diagnostics of cervicitis, could be related to lipid fluorescence; 17,43 it can cause flavins, the main cell and secretary granules' florescent components. 44 The diagnostic significance of spectral region 402–416 nm and 424–438 nm fluorescence in a smear is in harmony with the dynamics of main fluorescent constituents of the neoplastic epithelium proven elsewhere, and could serve as a cervical smear prognostic marker at the point of care and in the cytology laboratory. 2,33,45
Fluorescence decay time measured by us under 280 nm excitation in the same samples revealed differences in spectral region 320–360 nm (collagen IV, keratin) between normal and CIN2+ groups. 25,45 For this reason, combination of a few excitation waves is possible in Nd:YAG based microlaser for the purpose of improving the accuracy of epithelium diagnostic. We can use this dangerous excitation beam because we perform our measurements in vitro.
The absence of a CIN1 group is a weak point in this investigation, but inflammation and low- grade intraepithelial lesion (LGSIL) were found similar in earlier investigation. Cervical biopsies excited by 488 nm fluorescence intensity Student t test showed the chronic inflammation (CC) and LGSIL ratios having no significant spectroscopic difference. The sensitivity and specificity of the high-grade intraepithelial lesion (HGSIL) intensity compared with the mean ratio of CC and LGSIL was 89% and 100%. 46
Excitation by two waves and decay time evaluation would be the advancement elements of the device, but equipment cost enhancement is not suitable in terms of cancer screening economics. The application of smear/biopsy autofluorescence diagnostics in other high-risk human papilloma virus (HPV) related cancers' prevention at the point of care is reasonable to test, because global figures of head and neck cancer are higher than those for cervical cancer. 47,48 Moreover, unprocessed fresh samples are suitable for photodiagnostic purposes. The application of laser-induced fluorescence spectroscopy (LIFS) upon excitation of 405 nm, the comparison of emission spectra of bone cells, revealed that fluorescence intensity and the area under the spectra of malignant bone cells was lower than normal. This indicates the usefulness of simple fluorescence evaluation technology for the detection of malignancy at the point of care in the suspension of live cells. 49
Conclusions
In conclusion, a few diagnostic algorithms of high accuracy can be created by using the fluorescence spectra analysis by comparing its Gaussian components and revealing the flourescent markers. The autofluorescence spectral analysis of cervical liquid smear content permits the diagnostics of cervical epithelium: normal, cervicitis, and CIN2+.
Footnotes
Acknowledgments
The authors express their gratitude to the National Pathology Center for the cytological and histological evaluation of biopsies.
Author Disclosure Statement
No competing financial interests exist.