
Abstract
Introduction
The arterial stiffness is suggested to affect the propagation velocity of the pulse wave (PWV), and wave reflection can be altered by changes in the perfusion condition of the peripheral vascular beds. Time-domain indexes based on arterial pulse wave analysis could therefore help in establishing the extent of cardiovascular disease and in monitoring the effects of therapies. 3 –5 Photoplethysmography (PPG) is an optical measurement technique used to monitor blood volume changes in microvascular beds of peripheral tissue, and also to monitor arterial pressure and compliance. 6 Because the blood pressure (BP) inside an artery distends the vessel wall, changes in BP can be correlated with changes in the vessel volume and, therefore, the PPG signal. We previously demonstrated that an appropriate contact pressure could improve the reconstruction of the BP waveform (BPW) from noninvasive PPG measurements and frequency-component analysis. 7
The vascular responses during CS have been studied using PPG, but most studies have focused on time-domain waveform indexes, 8,9 Two main analysis focuses include waveform characteristics and the pulse transit time (PTT): for the former, the amplitude of contralateral-finger PPG signals were markedly decreased during CS, 10 and peripheral vascular compliance as evaluated by corresponding changes between PPG and BP was found to be decreased during CS; 11 whereas for the latter, the PTT calculated from PPG signals and referred to the transmission of the arterial pulse wave from the heart to the periphery has often been used as a noninvasive measure of arterial elasticity. 12,13 Sympathetic stimulation during CS was found to lead to vasoconstriction, stiffen the arterial wall, and therefore shorten the PTT. 14
Time-domain waveforms can be distorted by various types of small perturbation, especially at the peak point (which leads to an erroneous PTT value) or other parts of the pulsatile PPG waveform (which can lead to errors in calculating the pulse width). 7 These characteristics might limit practical applications of the time-domain PPG waveform index. Frequency-domain analysis has been applied to the BPW to monitor the distribution function of the blood supply and to predict outcomes for important cardiovascular diseases, 15,16 and to the PPG signal to study autonomic nervous control of the peripheral circulation. 17 Because the heartbeat is quasi-periodic, harmonic analysis is a particularly appropriate frequency-domain analysis method for several cardiovascular signals, including BP and PPG waveforms. 6,16 Wang suggested that individual vascular beds exert independent, frequency-specific, and linearly additive effects on the peripheral pressure wave, and also suggested that changes in the elastic properties of local vascular beds are correlated with the harmonic components of the arterial BPW. 18 Because the first 10 harmonics of the BP pulse waveform contain most of its total power, 19 harmonic analysis of the BPW can focus on these components.
Many previous studies have found that using CS as a challenge (e.g., immersing the hand into 10°C cold water) can induce interference (e.g., shiver or pain 2 ) rather than a true CS response. To increase the physiological relevance, the mild CS applied in the present study represented a smaller-than-usual temperature difference and was located at a distant site rather than near the measurement site. Moreover, we incorporated several real-time and noninvasive measurement techniques for the cardiovascular system to constitute an integrated system for evaluating the hemodynamic response induced by CS: ECG R-peaks helped to identify the cut point of each pulse, the radial BPW provided information about the upstream pulse transmission, the finger PPG signal reflected the downstream volume change during each pulse, and laser Doppler flowmetry (LDF) helped to confirm the myocardial blood flow (MBF) condition following CS. By focusing on the BP and PPG waveforms following mild CS, we aimed to determine if an index involving harmonics (including their amplitudes and phase angles) could help to characterize the induced hemodynamic response and changes in arterial pulse transmission. Such a technique might be useful in developing a new noninvasive index for monitoring the blood flow condition at local vascular beds induced by CS or chronic diseases that impair local blood supply.
Methods
Experimental procedure
Trials were performed on male healthy volunteers (n=29) aged 25–31 years and without signs or symptoms of cardiovascular or neurological disease. The subjects were lightly clothed, supine, and were allowed to stabilize for at least 10 min before recording commenced. The subjects were asked about their psychological condition to prevent the interference effect. The environmental temperature was within 23–25°C during the entire measuring period. All subjects gave their informed consent before experiments commenced, were asked to not take any medication for 3 days before experiments, and did not consume food at least 1 h before each experiment. All subjects were nonsmokers, and did not take coffee or drinks containing alcohol at least 1 day before experiments. 7
As shown in Fig. 1, the mild CS was applied by placing a bag filled with 2000 cc of water at 19–21°C around the right lower arm, and ECG, PPG, LDF, and BPW signals were measured simultaneously and noninvasively (typical BP and PPG waveforms are shown in Fig. 2). ECG signals were measured by surface electrodes, and acquired by a preamplifier (lead II, RA-LL; 6600-series, Gould, USA). BPW was measured by a pressure transducer (Kyowa KFG-2-120-D1-11). This device is linear within±0.1% of the rated output and has a flat frequency response between 0 and 5 kHz. A 1.5-cm-wide plastic belt was used to hold the pressure sensor around the right wrist. LDF (MBF3, Moor Instruments, UK) was used for measuring the skin-surface MBF on the back of the right hand. 20,21 The PPG signal from a 940-nm-wavelength infrared LED (QED233, Fairchild Optoelectronic) penetrating the finger tissue was acquired by a photodiode (L-SB1R9PD1D1, Para, Japan). When performing PPG measurements, subjects were instructed to put the right middle finger into a self-made measurement cavity that had a black inner wall to reduce interference from light leakage. A hand-shaped mold was placed under the palm to improve the positioning reproducibility of the hand and finger. Contact pressure was applied around the first knuckle of the finger using a 3-mm-thick sponge as a force cushion. The vertically applied pressure was pre-calibrated and monitored by a force gage (1000 gw, OHBA SIKI, Japan) to be ∼60 mm Hg in order to improve the PPG measurement stability and to reduce user discomfort. 7, 22 The BP signal was connected to a preamplifier (UV-10, Sensotec), the PPG signal was connected to a self-made current-to-voltage converter circuit, and all signals were then connected to an analog-to-digital converter card (PCI-9111DG, Adlink Technology, Taiwan) operating at a sampling rate of 1024 Hz.
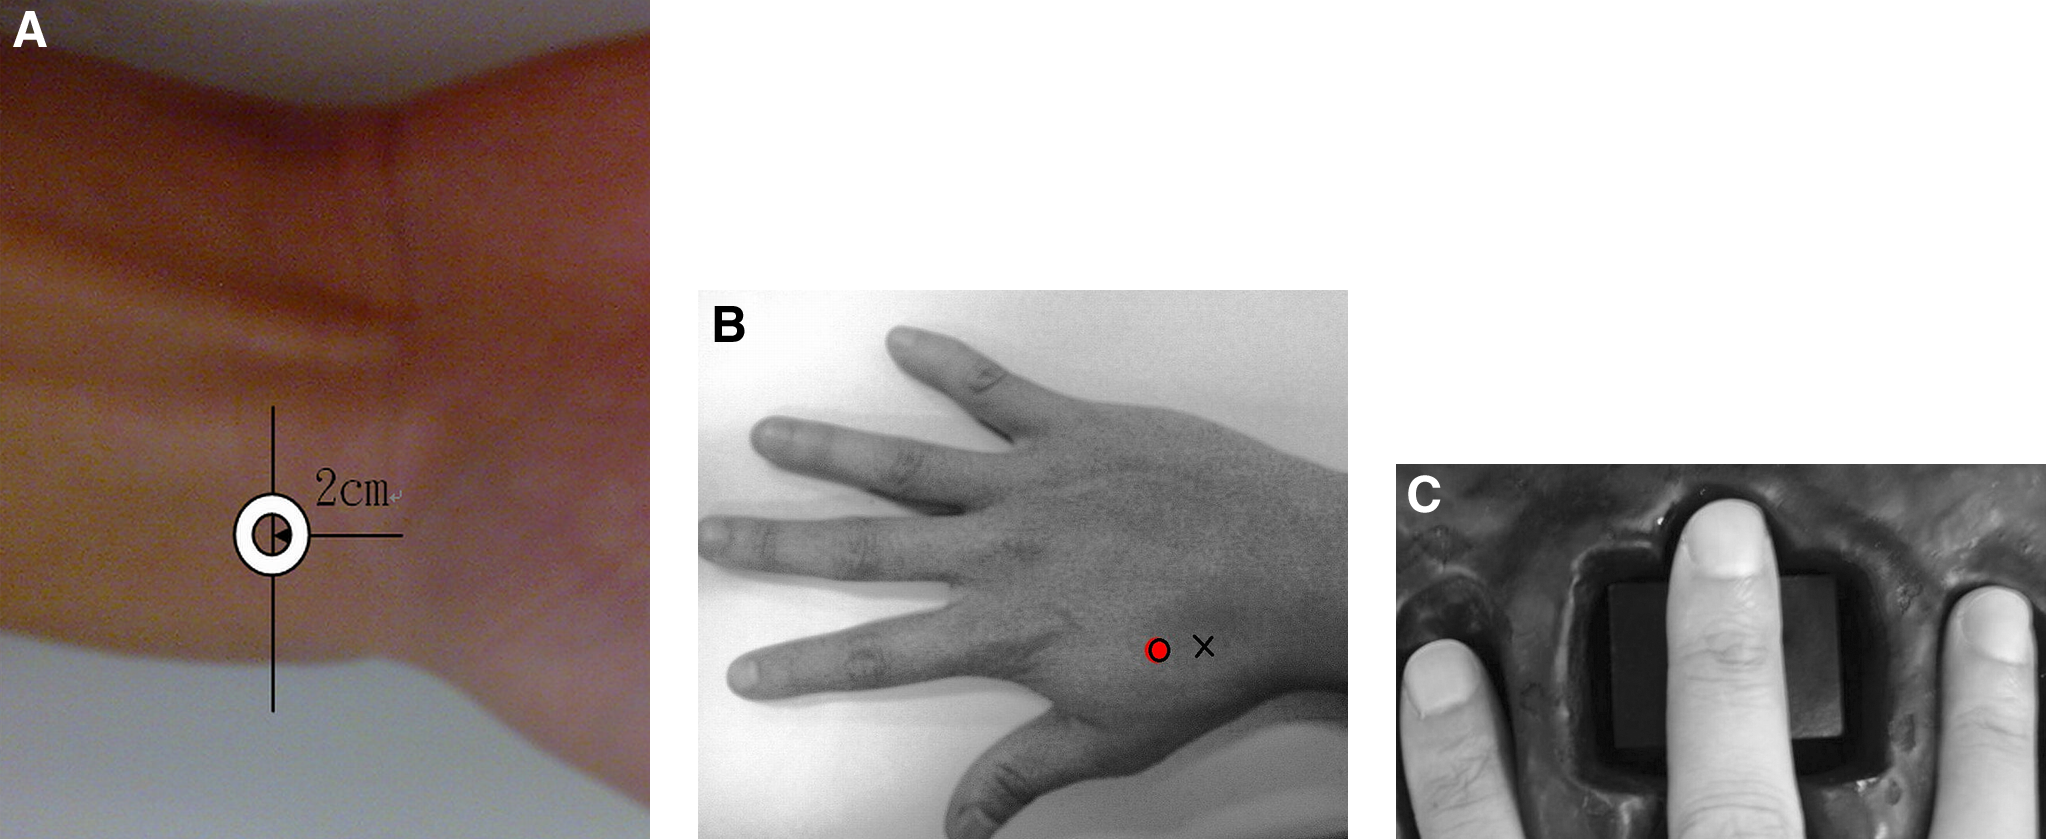
Illustration of the setup for the sensors and cold stimulation (CS) apparatus.
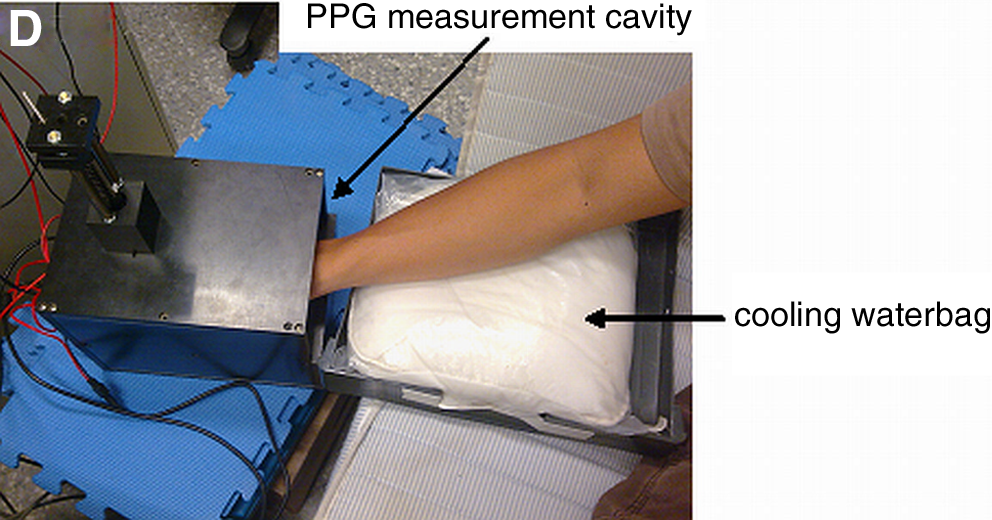
Typical measured time-domain BP and photoplethysmography (PPG) waveforms (acquired from one male 25-year-old volunteer; in arbitrary units).
For each experiment, we recorded a 3-min baseline-data sequence (M0), applied local mild CS and recorded a 3-min effect sequence (M1), and then recorded another 3-min effect sequence immediately after stopping the stimulation (M2). The application of CS was sustained for 5 min, and M1 measurement was performed during the first 3 min of CS. Before and after the whole procedure, we measured fundamental physiological parameters of the subject, including heart rate (HR), systolic BP (SBP), and diastolic BP (DBP) using a sphygmomanometer (MediGuard 150i, Rossmax). One thermistor was attached to monitor the contact temperature between the skin surface and the waterbag. The resistance of the thermistor was transformed into voltages (by a custom-made circuit) that were also sampled every minute by the analog-to-digital converter card. 21 The acceptable range for the temperature stability during the baseline period was a temperature variation of<1.0°C. The monitored skin-surface temperatures during M0, M1, and M2 were 31.8±1.3°C (mean±SD), 27.4±2.5°C, and 29.7±2.0°C, respectively, which illustrates that the applied mild CS induced significant temperature changes (p<0.05 by two-tailed paired t test).
Signal analysis
For the LDF signals, the mean MBF (MMBF) was defined as their average values during each 3-min data sequence. The PPG and BP signals were first passed through a digital 11th-order high-pass Chebyshev filter with a cutoff frequency of 0.01 Hz to eliminate the baseline drift. To determine each beat-to-beat waveform, the two neighboring minima of a signal helped to identify the cut points to define the pulse. 21,23
In time-domain analysis, the foot delay time (FDT) of the BP or PPG waveform was defined as the average time difference between the ECG R-peak and the onset point (lowest point) of all the pulses during each 3-min measurement period. This definition was adopted to evaluate the PTT for BPW, as the determination of the foot point could be less distorted than that for the peak point.
In harmonic analysis, the acquired BPW or PPG pulse [x(t)] can be represented by the following finite series:
24
The Fourier coefficients (An
and Bn
) of the BPW pulse can be calculated by
where ω is the angular frequency and ts
is the sampling time interval. The amplitude (Ampn
) and phase angle (φn
) of each harmonic can then be calculated by
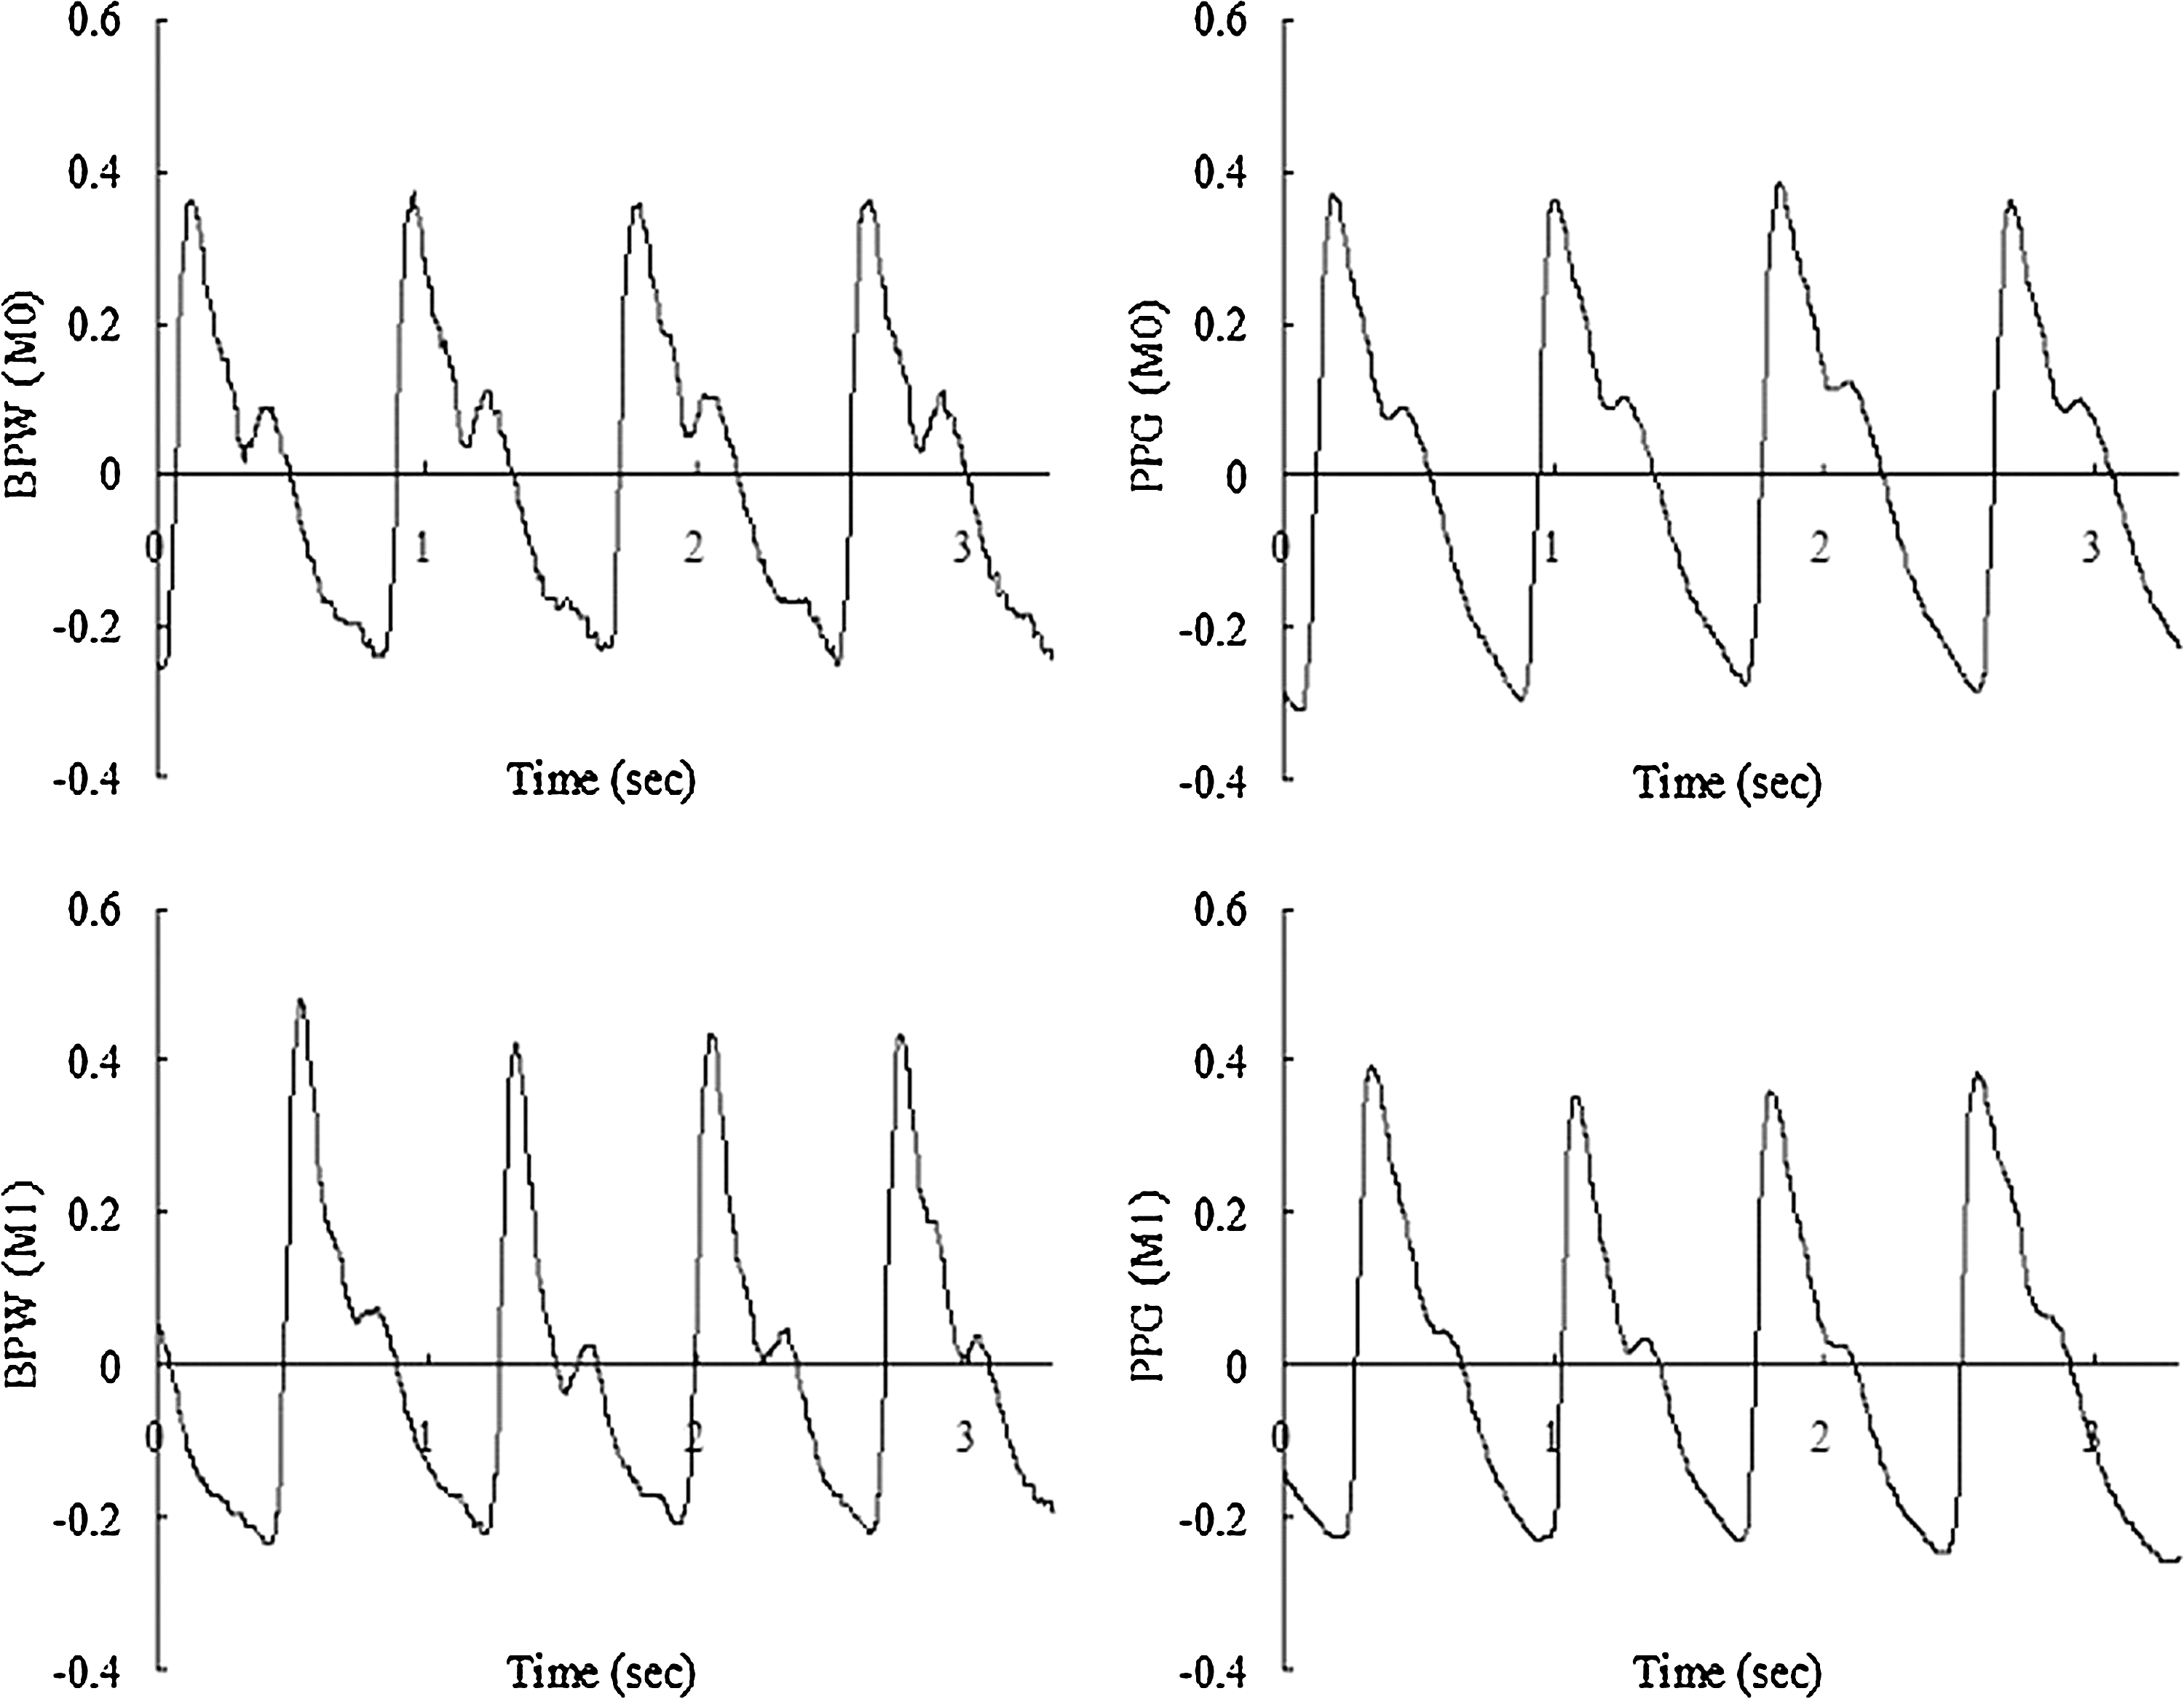
BPW and PPG spectra were calculated from the averages of all of the pulses during the entire measurement period for the amplitude proportion (Cn ) of the nth harmonic according to Ampn /Amp 0×100% for n=1–10, where Ampn is the amplitude of the nth harmonic of the BPW and Amp 0 is the DC component of the pulse spectrum. The phase angle of the nth harmonic (Pn ) was also calculated. [Cn (M1 or M2)/Cn (M0)] and [Pn (M1 or M2)–Pn (M0)] were then calculated to evaluate the hemodynamic effects induced by CS. Signal processing was performed with MATLAB. Differences were considered significant when p<0.05.
Results
The fundamental physiological parameters (HR, SBP, and DBP) listed in Table 1 did not change significantly during the time period between before and after the CS (p>0.2 by two-tailed paired t test). Table 2 reveals that the MMBF was significantly decreased following CS, thereby illustrating prominent influences on the local MBF supply. There were no significant changes in FDT, which implies that the applied mild CS did not induce significant changes in the PTT.
“Pre” and “post” indicate values measured before M0 and after M2, respectively. There were no significant changes in these basic physiological parameters by two-tailed t test.
MMBF of laser Doppler flowmetry signal is in arbitrary units; FDT is in sec.
p<0.05 compared with the baseline (M0) value by two-tailed t test. The only significant change was in MMBF.
Changes in the amplitudes of the harmonic components of the BP and PPG waveforms are compared in Fig. 3. For the BPW, C 2 was significantly decreased while C 4–C 10 were increased. The trend of the changes in the PPG waveform was similar; the main difference was that there were more prominent effects, considering the statistical significance for higher-frequency components (C 5–C 10) than for the BPW.
Changes in amplitudes of the harmonic components (Cn values) of the BP and photoplethysmography (PPG) waveforms. The presented changes are relative to the mean baseline value. The overall data are mean and SD values. “*” and “+” indicate p<0.05 and 0.05<p<0.1, respectively, compared with the baseline value by two-tailed paired t test.
Changes in the phase angles of the harmonic components of the BP and PPG waveforms are compared in Fig. 4. The changes were more prominent in the BPW than in the PPG waveform. For the BPW, the phase angles of the 3rd to the 10th harmonics were increased (significantly in P 3–P 6 and P 8) during M1. The only significant increases in PPG waveforms were in P 3 and P 4 (during M2), but these increases were smaller than those in the BPW.
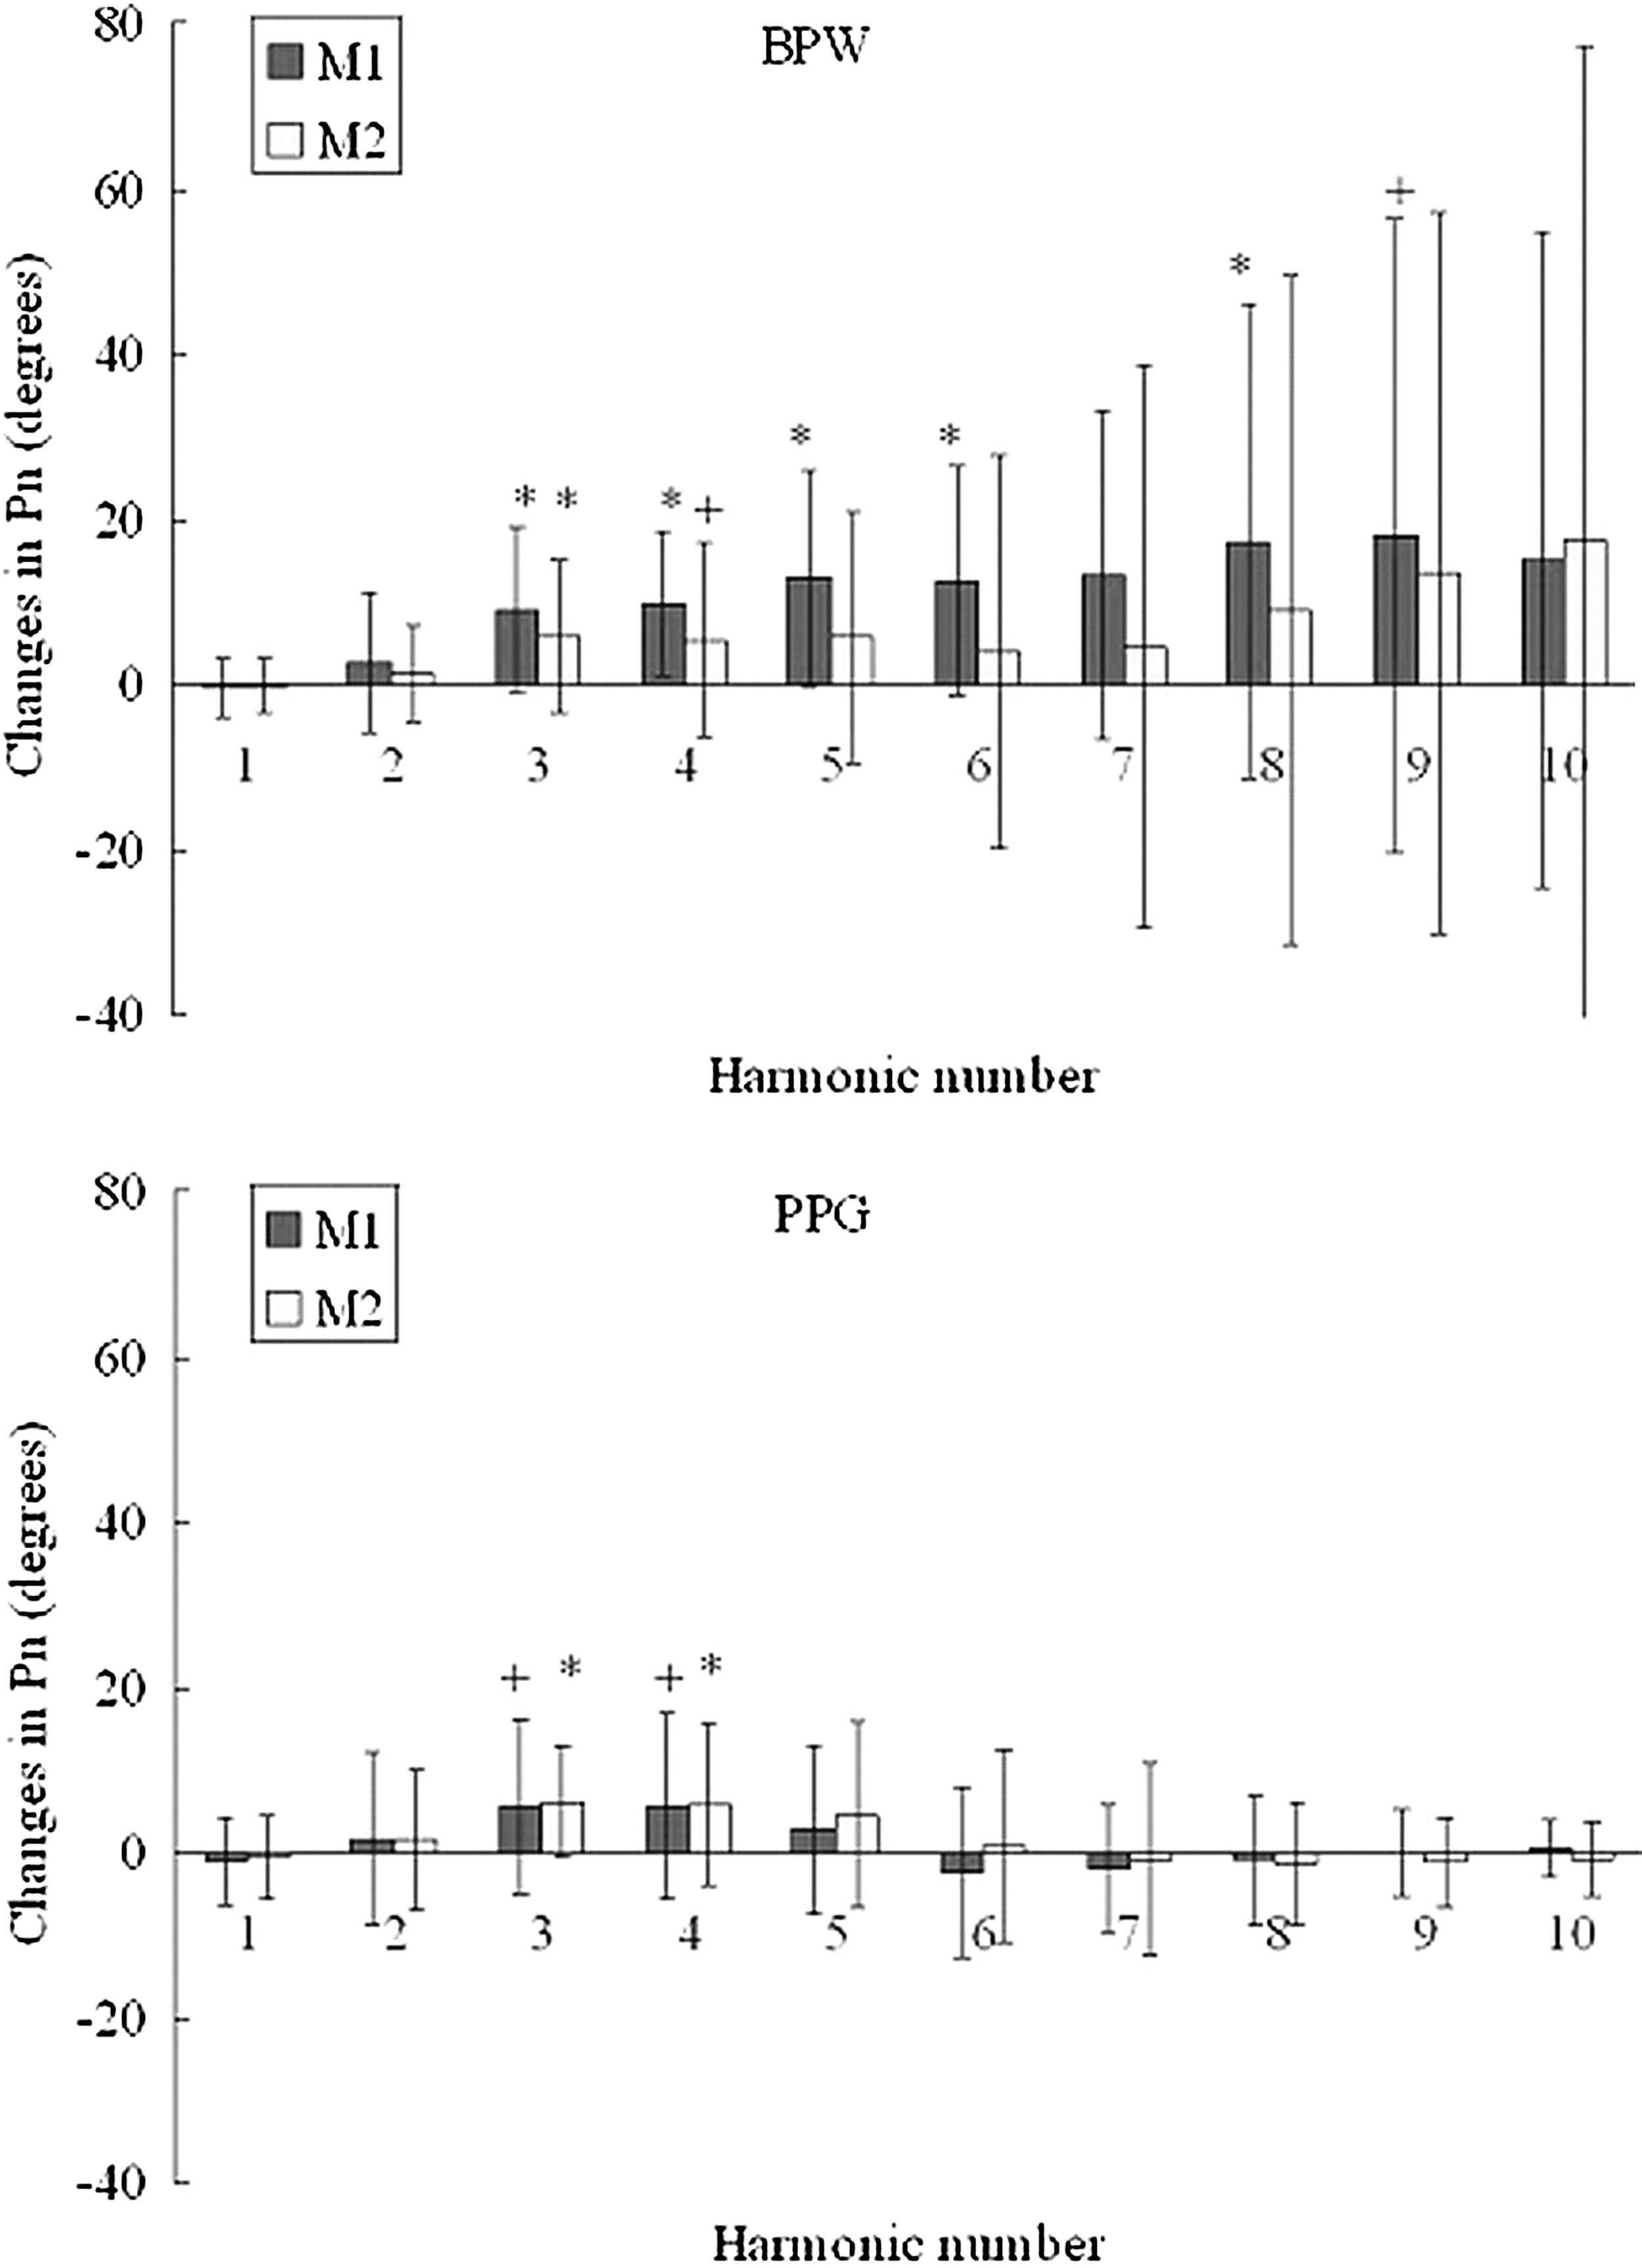
Changes in phase angles of the harmonic components (Pn values) of the BP and photoplethysmography (PPG) waveforms. The presented changes are relative to the mean baseline value. The overall data are mean and SD values. “*” and “+” indicate p<0.05 and 0.05<p<0.1, respectively, compared with the baseline value by two-tailed paired t test.
Discussion
The obtained results revealed that a mild CS can induce prominent changes in the harmonic components of the radial BP and finger PPG waveforms. CS has been used to assess cardiovascular neural control by observing its pressor response, possibly induced by increased cardiac output and enhanced sympathetic nerve activity. 25 Some previous studies investigated changes in time-domain indexes of the BP and PPG waveforms, whereas here we adopted harmonic analysis as a new approach in order to enhance the assessment and understanding of the CS response. Significant differences in the LDF MMBF and monitored skin surface temperature were found, whereas the absence of significant differences in fundamental physiological parameters indicated that the applied mild CS induced no prominent whole-body effects, which ensured only a local response around lower arm and minimized the interference of other sensational effect induced by CS. Because the induced arterial stiffening might have only taken place around the applied site of CS (the lower arm), and the applied CS was mild, it is possible that changes in the elastic properties of the whole arterial system faced by the heart were not prominent. The induced responses in sympathetic neural activities were therefore confined around the CS site, the adjustment of the heartbeat was not prominent, and hence there were no significant changes in HR following the present mild CS.
Amplitude
In harmonic analysis of BP and PPG signals, amplitude can be used to evaluate differences in the distribution efficiency of the spectral powers of different frequency components during pulse transmission. Figure 3 reveals that in the BP and PPG spectra, there were significant (or near to borderline statistically significant) decreases in the 2nd harmonic and increases in higher-frequency (4th through the 10th) harmonics; these were more prominent for PPG than for the BPW (based on the levels of statistical significance).
CS is suggested to induce sympathetic activation and vasoconstriction, and hence the present results may be at least partly attributed to induced increases in arterial stiffness. Arterial stiffness is known to increase systolic BP because of an inability to absorb pulsations from the heart and an increase in wave reflection from the periphery. A stiffened vessel wall might improve the transmission efficiency for the higher-frequency components of the pulse, and hence increase the amplitudes of these harmonics. It has been previously found that administering vasoconstrictors (e.g., norepinephrine 26 or serotonin 27 ) may induce a frequency increase of the first minimum in the impedance spectrum. Because the vasoconstriction effect of CS might be similar to that induced by administering drug vasoconstrictors, the lowered impedance for the higher-frequency components associated with the change in the impedance spectrum might contribute to an improvement of the transmission efficiency. Moreover, peripheral arterioles are often regarded as major reflecting sites. The improved transmission efficiency for higher-frequency components might mean that they are reflected more than lower-frequency ones, because vasoconstriction induced by CS might increase the amount of reflection from terminal vascular beds. This could be another mechanism accounting for the changes in the harmonic amplitudes observed following CS.
Phase angle
The phase angle in harmonic analysis of the BP and PPG signals may correspond to the time delay of each harmonic during wave transmission, and therefore could be used to evaluate their transmission speed. A larger phase angle implies the faster appearance of a specific harmonic, and therefore corresponds to a shorter transmission time. Figure 4 reveals that in the BP spectrum, the phase angles of the 3rd through the 10th harmonics were increased (significant for 3rd through the 6th and 8th harmonics). Pressure waves generated by the heart are buffered by the elastic arterial wall. Compared with the larger elastic arteries, which buffer pulsations from the heart, muscular arteries can alter the velocity of pressure waves along their length and determine when reflected waves return back at the heart. 4,28 The changes in phase angle observed in the present study illustrated that the stiffening of the arterial wall following CS might increase the transmission speed of higher-frequency components of the BPW, possibly through activation of smooth muscle in the arterial wall. This was in agreement with the present conjecture about harmonic amplitudes.
In contrast to the BPW, the only significant increases in phase angles were in the third and fourth harmonics of the PPG spectrum. It is possible that there are more smooth-muscle fibers in the radial artery than in the arterial vascular beds of the finger. In this case the effects of arterial stiffening induced by activation of smooth muscle could be less prominent around the PPG measurement site than for the BP, and thus lead to less prominent increases in the phase angles in the PPG spectrum. Therefore, considering the phase angles in the present type of harmonic analysis may help in noninvasively discriminating differences in the extent of arterial stiffening between measurement sites.
The PTT is widely used as an index to evaluate the PWV, and is reportedly shortened significantly in response to cold stress. 14 However, the present analysis revealed no significant changes in the FDT following CS, possibly because of the smaller temperature difference induced by the use of only a mild CS. This illustrates that although a time-domain index could not discriminate the effects induced by a mild CS (such as that applied in the present study), the results of the frequency-domain phase-angle analysis could reflect the induced arterial stiffening. One possible explanation for this discrepancy is that the PPT or FDT are calculated from the whole BPW itself, whereas harmonic analysis can provide detailed information about the transmission of each harmonic component of the BPW.
Conclusions
In summary, we have demonstrated that despite using only a mild CS in this study (in order to minimize interference of other physiological mechanisms), harmonic-analysis indexes of the BP and PPG waveforms—which are possible indicators of wave transmission and arterial stiffness—were significantly changed. The results of this preliminary study suggest that the responses of harmonic indexes of the BP and PPG waveforms can be used to quantify the sympathetic reactivity to CS and the resultant arterial stiffening, by providing more detailed information about the pulse transmission of each frequency component. This provides new insight into the cardiovascular responses to CS, and could be useful in developing an index for improving the ability to resolve the changes in arterial elastic properties induced by CS, other forms of external stimulation, or pathological factors.
The pulse waveform can vary between different sites during its arterial transmission. The BP pulse contour is often difficult to assess noninvasively, except at some specific sites such as the skin surface of the radial artery or the carotid artery. Compared with BP measurements, assessing PPG waveforms is easier at many sites, such as the downstream site (the finger) of the radial artery. This advantage of PPG measurements may facilitate the development of an easier and more user-friendly method to noninvasively evaluate the condition of arterial pulse transmission, and may be pertinent to the development of medical devices for application in point-of-care devices or in telemedicine.
Footnotes
Acknowledgments
The authors thank the National Science Council and Department of Health, Taipei City Government for partial support of this work.
Author Disclosure Statement
No conflicting financial interests exist.