
Abstract
Introduction
LCU is the device that can irradiate light to the composite resins. Thus far, several different LCUs have been developed. The conventional quartz-tungsten-halogen (QTH)-based light matches most widely with CQ, but the unit produces heat from the internal lamp, causing temperature rise in the composite resins and oral cavity mainly by heat diffusion through the light guide. 1 –3 The light-emitting diodes (LEDs) are convenient to use because of they are handy and wireless types with sufficiently high light intensity. They produce less heat compared with QTH LCU. Because of their many favorable attractions, LEDs are gradually replacing QTH LCUs. 4 –6 The application of laser in dentistry started almost from the beginning of the development of lasers. 7 The advantages of lasers as a light source are their coherent and monochromatic natures. Among the lasers, argon laser had been used as a light source for the curing of composite resins because of the spectral match between CQ and argon laser. 8 –10 However, despite its excellent efficiency as a light source, argon laser is not as common as QTH and LED LCUs because of its bulky size and high price. A diode-pump solid state (DPSS) laser of green color was firstly introduced as a light source for flow cytometers. 11,12 DPSS laser system was realized through the advanced laser diode technology. The advantages of this laser system are that it is handy and reasonably priced. Among the other available wavelengths, a laser of 473 nm is seeking its application in dentistry for light curing of composite resins. 13 –15 The blue light of 473 nm matches more closely with the absorption peak of CQ than the argon laser (488 nm); therefore, this DPSS laser may have more favorable attractions than the argon laser.
As tooth-colored restorative material, composite resins are translucent or turbid depending upon their constituents and concentration. In these materials, external light inevitably attenuates through events such as absorption and scattering. As the light-curing process is initiated by the light, understanding the polymerization in the subsurface is important for the proper and better use of LCUs as a light source. The purpose of the present study was to investigate the influence of DPSS laser on the polymerization of composite resins in terms of curing depth. Through the study, the potential of DPSS laser of 473 nm as a LCU was tested.
Materials and Methods
Specimens and LCUs
For the study, three different composite resins (Esthet-X [ES], Premise [PE], and Filtek Z350 [Z3]) of shade A3 were examined. The characteristics of the specimens used are summarized in Table 1. For the light curing, a conventional QTH (Hilux 601, First Medica, Greensboro, NC), an LED (L.E.Demetron, Kerr, Danbury, CT) LCUs, and a DPSS laser (LVI Technology, Seoul, Korea) of 473 nm were used as light sources. The output light intensity of QTH and LED was ∼900 mW/cm2 according to the built-in radiometer. The output power and spot size of LAS were ∼140 mW (PM3/FIELDMAX, Coherent, Portland, OR) and 6 mm, respectively. The raw beam was expanded to 6 mm using a beam expander. The resultant light intensity of LAS was ∼500 mW/cm2. The emission spectrum of the light sources and the absorption spectrum of CQ (Fig. 1) were measured using a photodiode array detector (M1420, EG&G PARC, Princeton, NJ) connected to a spectrometer (SpectroPro-500, Acton Research, Acton, MA).
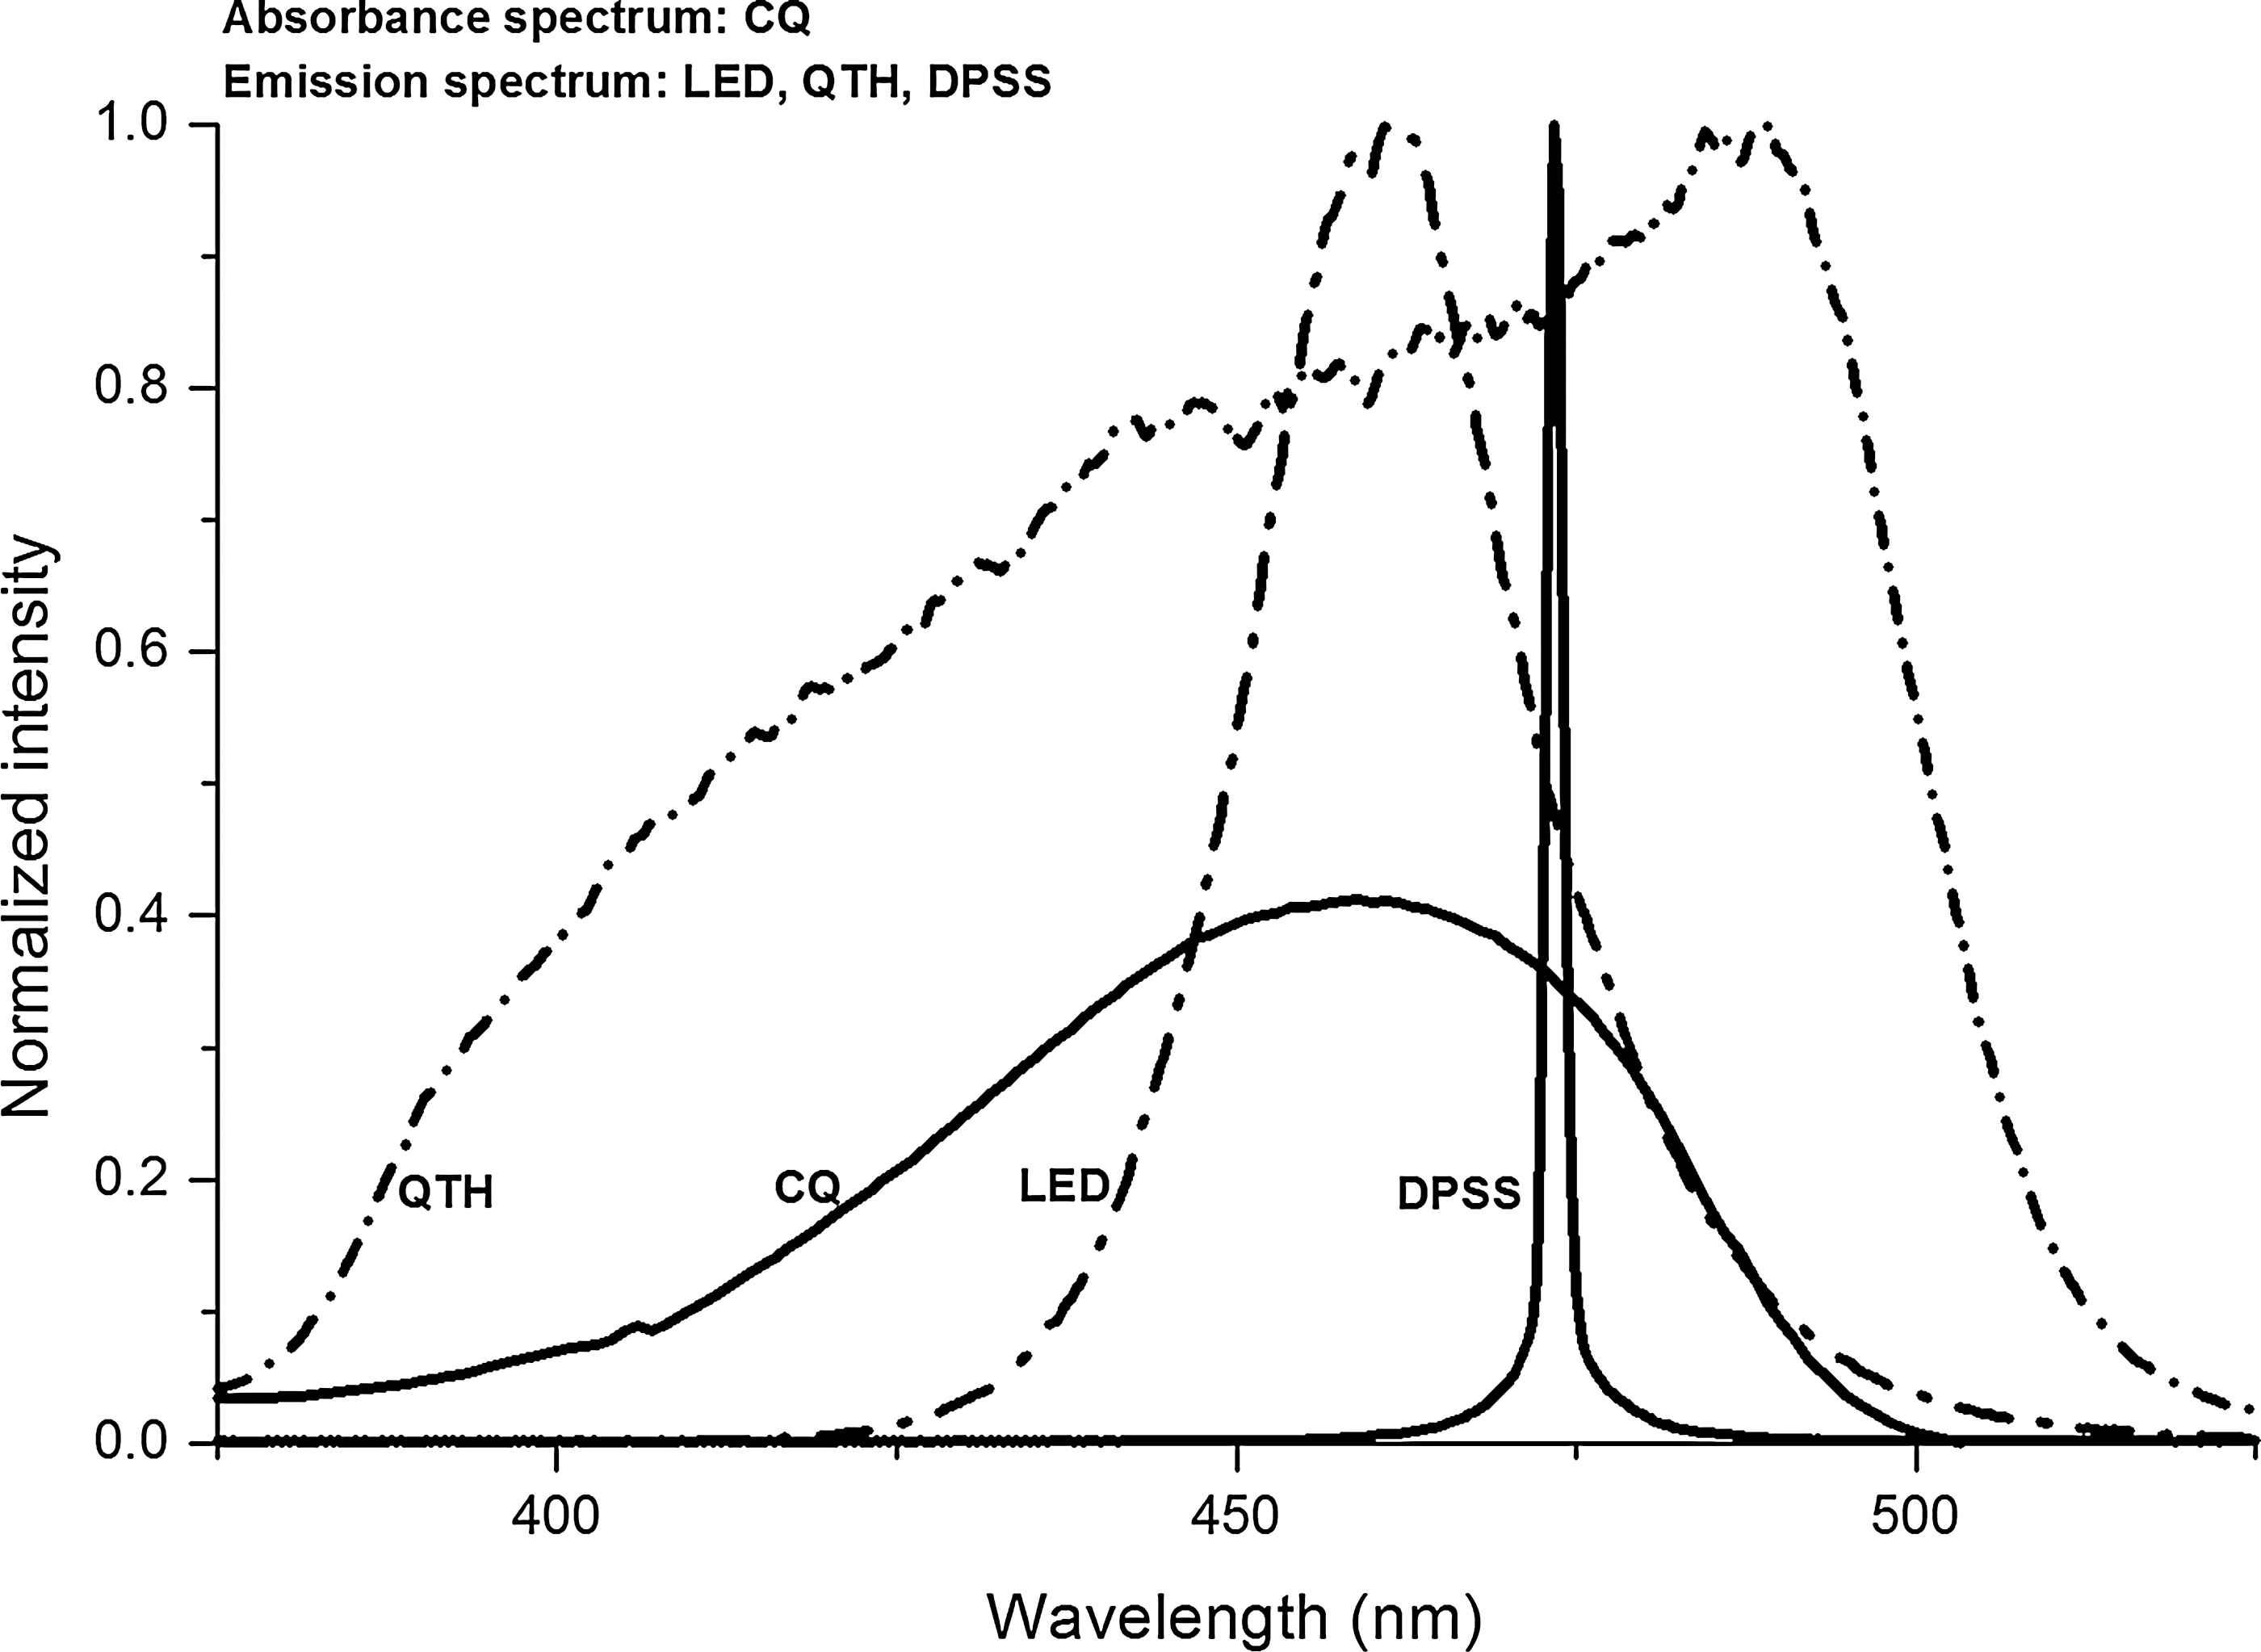
Emission spectra of the used light-curing units (LCUs) and the absorption spectrum of camphorquinone.
ES, Esthet X; PR, Premise; Z3, Filtek Z350; Bis-EMA, ethoxylated bisphenol A glycidyl methacrylate; Bis-GMA, bisphenol A glycidyl methacrylate; TEGDMA, triethyleneglycol dimethacrylate; UDMA, urethane dimethacrylate.
Photon counts
To measure the number of photons transmitted through the specimen of different thicknesses, the same photodiode array and detector system that were mentioned previously were used. At this time, all the measured photons have the same emission wavelength. For the measurement, the light-cured specimens of different thicknesses (diameter: 7 mm; thickness: 1, 2, and 3 mm) were placed over the 1 mm-thick stage that had a hole with a diameter of 6.6 mm. Light from the LCU was irradiated from above the hole onto the top surface of the specimen. Below the hole, the detector was placed in a fixed position to measure the transmitted photons with consistency.
Degree of conversion (DC)
To evaluate the DC, the specimens (diameter: 7 mm; thickness: 1, 2, and 3 mm; n=5 for each condition) were light cured for 40 sec and aged for 24 h in a 37°C dry chamber. To make the flat surface, thin slide glasses were covered on the top and bottom surfaces. Thereafter, each surface (top, 1, 2, and bottom surfaces) of the specimen was scratched (at the depth of 100–150 μm) using a scalpel to obtain the powder. The collected powder was dissolved in ethanol for transmission FTIR (Nicolet 6700/8700, Thermo Fisher Scientific Inc., Waltham, MA). Thirty-two scans were obtained at 0.09 cm−1 resolution in 7800–350 cm−1 wave number range. The DC of the cured resins was evaluated using the baseline technique. The peak from the aliphatic C-C bonds (at 1636 cm−1) and the reference C-C aromatic ring bonds (at 1608 cm−1) were determined. The paste of the uncured resins was similarly tested. DC (%) was calculated using the following formula:
Microhardness
To measure the surface microhardness of the specimens, resin was filled into a metal mold (4×2×3 mm), secured the top and bottom surfaces with thin slide glasses, and light cured for 40 sec using an LCU. The cured specimen was removed from the mold and aged for 24 h in a 37°C dark chamber. The microhardness of the top (z=0) and bottom (z=3 mm) surfaces was measured using a Vickers hardness tester (MVK-H1, Akashi, Tokyo, Japan) by evaluating the size of microindentations (n=12 for each test condition). To make the microindentation, a 200 gf load and 10 sec dwell time conditions were applied.
Refractive index
The refractive index of the thin slabs was measured using a commercial Abbe-type refractometer (NAR-1T; ATAGO, Tokyo, Japan). For the measurement, a tiny amount of resin was sandwiched between two thin slide glasses ∼50 μm thick, placed below the mold of 1, 2, and 3 mm thickness, and light was irradiated from the top of the mold to the bottom direction for 40 sec. The light-cured thin slabs were aged for 24 h in a 37°C dark chamber. One drop of high refractive index interfacial contact agent, monobromonaphthalene, was added on the specimen and then the milky white refractor (ND=1.6199) was placed over it to enhance diffuse scattering of the cured slabs. Diffuse scattering at the front surface is necessary to improve the accuracy of the measurement. Refractive index readings were performed at room temperature (22.5±1.0°C) unless otherwise mentioned. The measurement was performed under the D line (589 nm) wavelength.
Statistical analysis
The data for DC, microhardness, and refractive index were analyzed by ANOVA at the 95% confidence level. A post-hoc Tukey test was then followed for a multiple comparison.
Results
The number of the detected photons in the specimens of different thicknesses and the attenuation coefficient of the incident photons are shown in Table 2. Within the specimens and according to the curve fit, the number of incident photons exponentially decreased as photons reached at the bottom. Among the LCUs, QTH showed the least (lowest) photon loss (attenuation coefficient) within the specimens. Among the specimens, Esthet X made much greater light attenuation than the rest of the resin products, regardless of LCUs.
LCU, light-curing unit; ES, Esthet X; PR, Premise; Z3, Filtek Z350; AC, Attenuation Coefficient; LED, light-emitting-diode; DPSS, diode-pumped solid state; QTH, quartz-tungsten-halogen.
Table 3 shows the resultant DC (%) at depths. The specimens light cured using DPSS and QTH showed a significantly greater (p<0.001) DC than that by LED. Depending upon the resin product, DC of the top surface showed 17.1–39.0%, 23.6–27.9%, and 19.8–30.4% decrease on the bottom surface (3 mm) if the specimens were light cured using LED, DPSS, and QTH, respectively. DC negative linearly correlated with specimen thickness (R: 0.98–0.99) regardless of LCUs.
Statistically significant difference on LCU is shown by superscript numbers,1,2 and on composite resin by superscript letters.A,B Same letters or numbers are not significantly different (p>0.05).
On p values, the letters α and β denote LCU and resin product, respectively.
DC, degree of conversion; LCU, light-curing unit; ES, Esthet X; PR, Premise; Z3, Filtek Z350; LED, light-emitting-diode; DPSS, diode-pumped solid state; QTH, quartz-tungsten-halogen.
Table 4 shows the mcrohardness of the specimens for different thicknesses and LCUs. The microhardness of the top surface showed 14.5–23.4%, 22.3–34.9%, and 14.6–34.9% decrease on the bottom surface if the specimens were light cured using LED, DPSS, and QTH, respectively. The specimens light cured using DPSS showed slightly lower microhardness both on the top and bottom surfaces than specimens cured by the rest of the LCUs. Negative linear correlation was found between microhardness and specimen thickness (R: 0.88–0.99) regardless of LCU.
Statistically significant difference on LCU is shown by superscript numbers,1,2,3 and on composite resin by superscript letters.A,B,C Same letters or numbers are not significantly different (p>0.05).
On p values, the letters α and β denote LCU and resin product, respectively.
LCU, light-curing unit; ES, Esthet X; PR, Premise; Z3, Filtek Z350; LED, light-emitting-diode; DPSS, diode-pumped solid state; QTH, quartz-tungsten-halogen.
The refractive index of the specimens is shown in Table 5. Among the specimens, Z3 showed the highest refractive index. On each depth, the effect of LCUs on the mean refractive index was insignificant (p>0.05). Refractive index negative linearly correlated with specimen thickness (R: 0.87–0.99) regardless of LCU.
Statistically significant difference on LCU is shown by superscript numbers,1,2,3 and on composite resin by superscript letters.A,B,C Same letters or numbers are not significantly different (p>0.05).
On p values, the letters α and β denote LCU and resin product, respectively.
LCU, light-curing unit; ES, Esthet X; PR, Premise; Z3, Filtek Z350; LED, light-emitting-diode; DPSS, diode-pumped solid state; QTH, quartz-tungsten-halogen.
Table 6 shows that correlations exist among DC, microhardness, and refractive index. DC linearly correlated with microhardness (R: 0.79–0.99) and refractive index (R: 0.88–0.99) regardless of LCU. Microhardness also linearly correlated with refractive index (R: 0.86–0.98).
DC, degree of conversion; LCU, light-curing unit; ES, Esthet X; PR, Premise; Z3, Filtek Z350; LED, light-emitting-diode; DPSS, diode-pumped solid state; QTH, quartz-tungsten-halogen.
Discussion
The present study investigated how the blue DPSS laser affects the polymerization of composite resins in terms of curing depth.
When light irradiates onto the material, the light partly reflects from the surface and transmits into the specimen. Within the specimen, the transmitted light confronts various events, such as absorption and scattering, through its propagation by light absorbing agents (mainly photoinitiator and pigments), refractive index mismatch, and fillers. In a turbid media (such as composite resins) light intensity (number of photons) decreases exponentially because of such scattering and absorption within the media. The incident photons interact with photoinitiators that ubiquitously distribute within the specimen. In the present study, the number of photons passing specimens of different thicknesses showed a fit to an exponential decay model (Beer–Lambert formula). This means that the number of available photons needed to trigger photoinitiation will rapidly decrease at the bottom of the thick specimens. As a result, less polymerization can happen at the bottom surface and it can cause restoration failure at the interface. To avoid such incomplete curing, incremental filling is recommended. 16,17 In many cases, within the composite resins, the light decreasing of LCUs has no specific or consistent pattern and looks more product specific. 15
In a correlation test between DC and specimen's thickness, specimens showed a strong inverse linear correlation between them even though the incident light decreased exponentially regardless of LCU. The reason may be found in the chain-reaction nature of polymerization. Because the polymerization process through the chain reaction converts monomers to polymer network along the horizontal direction and from top to bottom surface by way of branching and cross-linking, insufficient activation of photoinitiator by insufficient photons at specific depth can be compensated. However, because of absolutely fewer photons, much less DC on the bottom surfaces (17.1–39.0%) compared with the top surface is inevitable. The pattern of DC decrease in the subsurface is not consistent with the pattern of photon attenuation for resin product and LCU. The reason may be the result of the complicated factors, such as fillers, monomer distribution, and degree of cross-linking, that affect DC together with light distribution from the curing light. 18 –20
Material's hardness reflects the resistance of a material to plastic deformation. In composite resins, microhardness values offer a qualitative idea of the specimen's degree of polymerization in conjunction with the evaluation of DC. Generally, filler content, monomer commixtures, and cross-link density affect the resulting microhardness in a complicated manner. 21 –23 According to the linearity test, microhardness is inversely linearly correlated (R: 0.88–0.99) with the specimen's thickness regardless of resin products and LCUs. Unlike the exponential decrease of photon number, microhardness decreased linearly in the subsurface of the specimens, so that at the bottom surface (3 mm away from the top surface), microhardness decreased merely 14.5–34.9% compared with the top surface. The decrease is similar to the DC decrease even though DC and microhardness decrease pattern do not exactly match with each other. A strong linear correlation (R: 0.79–0.99) was found between DC and microhardness. The specimens light cured using the DPSS laser showed a slightly lower microhardness than the rest, and such slight lowness may be caused by the lower light intensity. 15,24 Among the specimens, Z3 showed the greatest microhardness and Premise followed second. However, this order is somewhat different if compared with that of DC values. For the DC evaluation, powder was collected from the wide area (circle of diameter 7 mm) of the specimen. At this stage, any possible variation will be mixed and averaged. In practice, the uniformity of photoinitiator, monomer, and filler distribution within resin matrix and radial light distribution from the LCUs cannot be warranted. 25 Because microhardness value is the evaluation of one microindentation made on one specific position at the size of <100 μm, the measured values are sensitive to thee-dimensional situation. In the microhardness measurement, the existing three-dimensional variations can be reduced by increasing measurement number and measuring site, but nonetheless, such increment seems to impose apparent limitation in reducing the difference between DC and microhardness.
Refractive index of the medium is the measure of light velocity in that medium; therefore, the refractive index depends upon the state of the medium. Many factors can be involved in the change of light velocity (refractive index), but in conjunction with our study, polymerization-induced shrinkage of the specimen can be one possible reason. Because the degree of polymerization on the surface is much higher than that of the bottom surface, condensation caused by shrinkage in the upper surface can be much greater than that of the lower surface. In the case of glass materials, as the material's density increases, the refractive index increases as well. 26 In the present study, as it reaches from top to bottom surface, the refractive index linearly decreases regardless of resin products. Specimens light cured using the DPSS laser showed slightly lower refractive index at the bottom surface even though, in most cases, it had insignificant statistical difference, and it is ascribed to the lower light intensity of the DPSS laser compared with the rest of the LCUs (500 vs. 900 mW/cm2). The decreasing pattern of the refractive index was identical to that of DC in terms of specimen thickness. As a result, there was a linear correlation between DC and refractive index (R: 0.88–0.99) regardless of resin products and LCUs. 27 –29 As the specimen thickens, light curing and then polymerization can be insufficient, inducing less shrinkage and condensation. High refractive index values on the top surface compared with the bottom surface can be understood that way. Because insufficient polymerization yields low microhardness value, a linear correlation between microhardness and refractive index (R: 0.86–0.98) seems natural regardless of LCU.
Conclusions
The influence of the blue DPSS laser of 473 nm was tested to see how it affected the polymerization of composite resins in terms of specimen thickness (curing depth). The incident light (number of photons) exponentially decreased as it reached to the bottom surface. However, DC, microhardness, and refractive index linearly correlated with thickness; therefore, these values linearly decreased as the specimen thickened. The linear nature can be a useful factor in understanding the degree of polymerization within the specimen. The values obtained using three different LCUs were similar even though the DPSS laser had lower light intensity than the rest of the LCUs. The similar values obtained using the DPSS laser suggest a potential for this laser as a light source for the light curing of composite resins.
Footnotes
Author Disclosure Statement
No competing financial interests exist.