
Abstract
Introduction
Investigations for a noninvasive technique to detect blood metabolites and others biofluids have been conducted by many researchers during the last few decades. 2 –5 Nowadays, many studies have reported the use of optical methods as efficient tools for diagnostics,for example: laser-induced fluorescence, 6 infrared vibrational spectroscopy, 7 and Raman spectroscopy. 5 There is a continuous search for an online method that can be used to characterize bioanalytes and metabolites. Therefore, the ideal method should be one that can be performed in real time, less invasively, less painfully, more precisely and cost effectively.
Among distinct optical techniques used in diagnosis, Raman spectroscopy is very promising, as it can be easily applied to the analysis of biological fluids, with no need of any previous treatment of the sample. Saade and coworkers 8 identified hepatitis C in human blood samples by near infrared Raman spectroscopy (NIRS), Dou and coworkers 9 quantitatively determined the concentration of glucose, acetone, urea, and creatine in human urine. Measurement of multiple key analytes such as cholesterol, urea, glucose, and others, were performed by Berger and Feld 10 at physiological concentrations using a dispersive Raman spectroscopy system (near-infrared diode laser 830 nm) confirming the possibility of using this technique as a noninvasive and effective method for biofluids diagnosis.
Some works report the use of infrared absorption spectroscopy for detecting biomolecules in biofluids. 7,11 However, the broad bands always present in the infrared spectra make difficult a precise identification of the analytes. The usefulness of infrared absorption spectroscopy is even less when used to investigate analytes in blood and urine samples, because of the strong absorption in the infrared, caused by the water present in both kinds of samples. In such cases, preprocessing steps are usually required in order to dry the samples prior to the spectroscopic measurements. These steps allow the removal of the dominant water background, providing better accuracy. 2,7 In contrast to Infrared absorption spectroscopy, the lines in Raman spectra are usually sharp, well resolved, and distinctly characteristic for each material. Furthermore, the Raman modes of human blood samples are much more numerous than infrared modes, ensuring more rich information in a spectral point of view. 12
Some of the main advantages of using Raman spectroscopy over other techniques available to analyze blood metabolites are that Raman spectroscopy allows real time analysis, presents high precision, is inexpensive, and is transparent to water, which is ideal for the analysis of biological fluids. 5
The aim of the present work is to investigate whether Fourier transform (FT)-Raman spectroscopy is a suitable technique to detect carbohydrates in whole blood samples, as well as to measure their concentration in real time. As far as we are aware, this study is the first to investigate carbohydrates in blood serum using the FT-Raman technique (1064 nm). Furthermore, we have proposed and performed the experiments as a medical assay effectively, because the FT system is a closed system/device and can be performed in any laboratory, the way other routine assays are performed daily.
Materials and Methods
Human blood samples
A total of 29 human blood serum samples (6 healthy, 11 diabetic, 6 hypoglycemic, and 6 threshold) in which carbohydrate concentration varied independently (0–440 mg/dL) were obtained from ATHEL Clinic (Atendimento Hemoterápico Laboratorial, Campos do Jordão, SP, Brazil), collected from 18 subjects aged from 25 to 50 years, of both sexes, who underwent blood analysis. The categories healthy, hypoglycemic, and threshold had three patients in each, and all of them contributed two blood samples taken on different days in order to improve the statistical analysis. The diabetic category had nine patients and two of them contributed two blood samples. The collected blood samples were stored in glass tubes and maintained at 4°C prior to their use. At the moment of Raman spectral analysis the samples were brought to room temperature (18°C). This protocol was approved by the Ethics Committee of the University of Vale do Paraíba under number H273/CEP/2007.
Calibration mode
We evaluated the capability for calibration curve on a Raman instrument for identification and monitoring of the carbohydrate bands and chose Raman averaged signal of five bands, labeled as A, B, C, D, and E shown in Fig. 1 for the evaluation. The correlation coefficient (R) was calculated in accordance with the following equation:
Here, xi and yi respectively represent: carbohydrate concentration and Raman scattering intensities for each xi, while X and Y are average values of xi and yi.
Raman spectroscopy system
FT-Raman spectra were obtained using a spectrometer (model RFS 100/S, Bruker Inc., Karlsruhe, Germany) that uses a Nd:yttrium–aluminum–garnet laser at 1064 nm operating wavelength and 200 mW of excitation power. Spectra were obtained with 120 scans, with collection time of 6 min under a spectrometer resolution of ∼4 cm−1.
Results and Discussion
The Raman scattering effect is an inelastic process that occurs when a sample is illuminated with a light source (such as a laser beam). In this process, energy from the incident photons is transferred to the sample molecules, exciting them to high vibrational modes. Scattered photons have a lower frequency than the incident ones because of the energy change that is lost in the scattering process. The frequency shift of the excitation radiation corresponds to the different vibrational frequencies of the molecules of the sample material. Thus, a Raman spectrum help us to determine the biochemical composition of the sample, since each molecule has its own characteristic Raman spectrum like a fingerprint. 11
Figure 1 shows a Raman spectrum of human blood serum of a diabetic patient measured with the excitation wavelength of 1064 nm (∼200 mW). Note that the obtained spectrum is completely free from fluorescence interference. As known, fluorescence phenomenon results from an electronic absorption process. The longer wavelengths used for Raman scattering excitation are further from the electronic absorption bands and therefore fluorescence becomes lower, enabling more visibility of the Raman bands in the spectra. 11 Furthermore, the wide range of the spectrum is measured simultaneously during 360 sec.
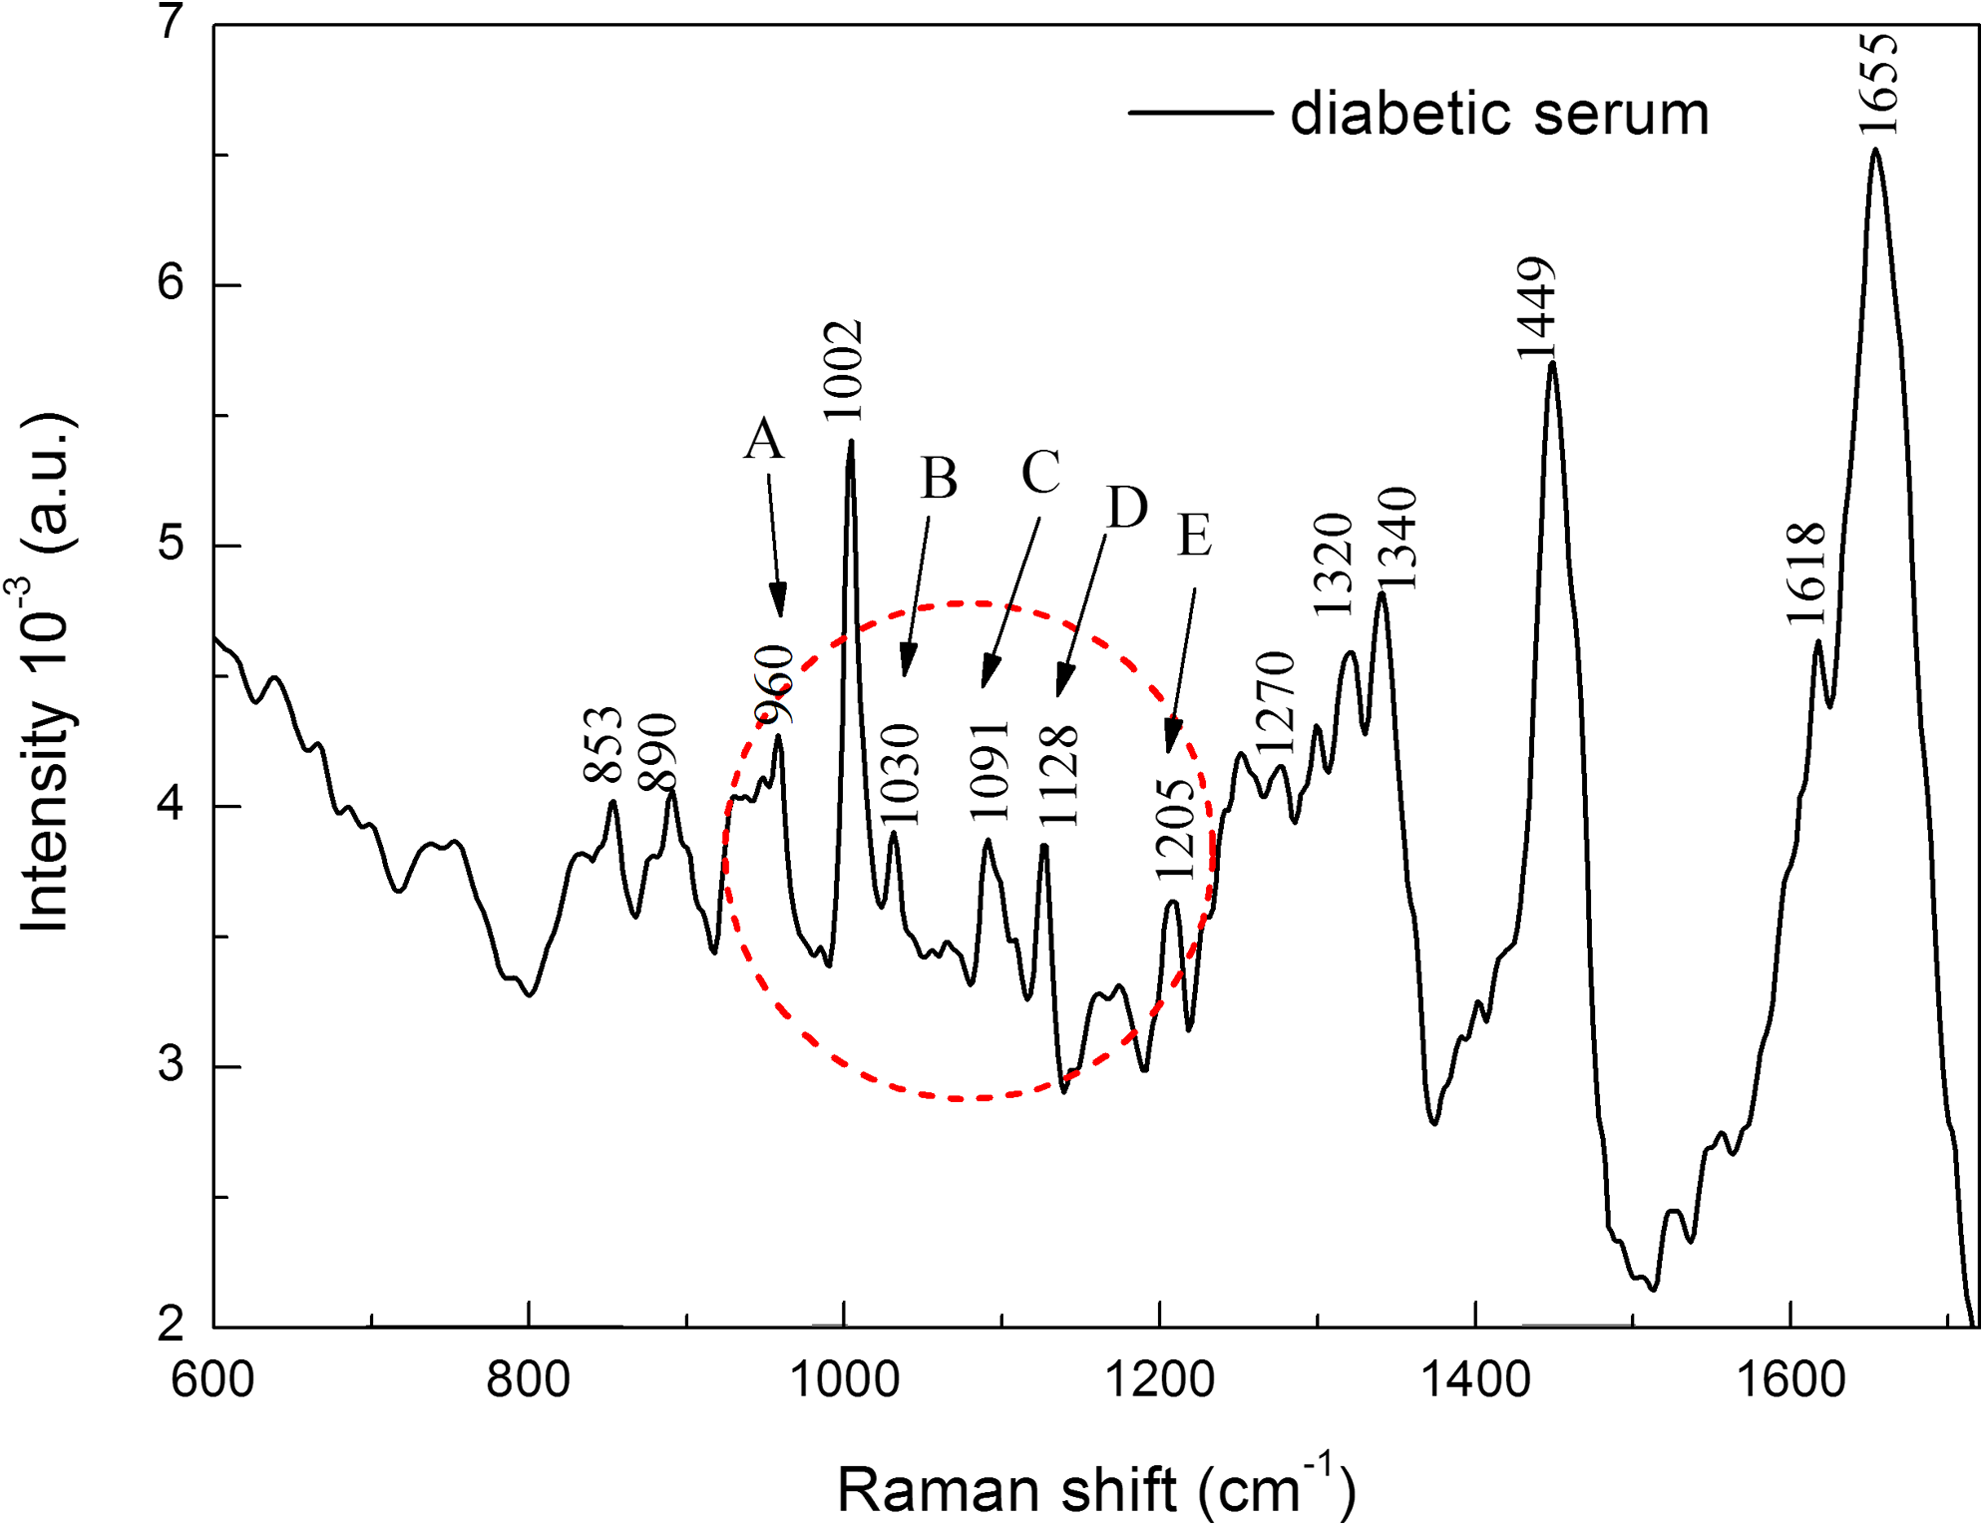
Raman spectrum of diabetic human blood serum. The bands labeled A, B, C, D, and E are assigned to some carbohydrates present in human serum.
Proteins exhibit characteristic vibrations of the polypeptide skeleton. The most pronounced peak at 1655 cm−1 is assigned by the amide I vibration mode relative to peptide chain. Similarly, the peaks near 1270 cm−1 can be assigned to the amide II and amide III vibrations modes. The essential amino acids phenylalanine and tyrosine are identified at 1002 cm−1 and at the 829/851 cm−1 duplet structure. 12
The spectrum exhibits the mains bands that can be related to the carbohydrates placed about 960, 1030, 1091, 1128, and 1205 cm−1 referents to C-O, C-C (stretching), C-O-H and C-O-C. 13,14 Peaks found in 1449 and near 1340 cm−1 can be related to lipoproteins, but their concentrations and even absence can change because the blood from some patients presents individual differences; some include large amounts of proteins and lipids whereas others contain only a large amount of glucose because the metabolites presents in blood fundamentally depend upon the alimentation of each person. The most important components found in healthy human blood and their average concentrations are summarized in Table 1. 10
TP, total protein.
Figure 2 shows the monitoring of blood sample of one patient by Raman spectroscopy revealing the spectral changes to each 30 min after the consumption of glucose. The spectra relative to 30 min (curve b) reveal the maximum concentration of carbohydrates in the blood. After this time, the concentration falls slowly and almost linearly so that after 180 min the concentration of glucose still is high when compared to the fasting spectra.
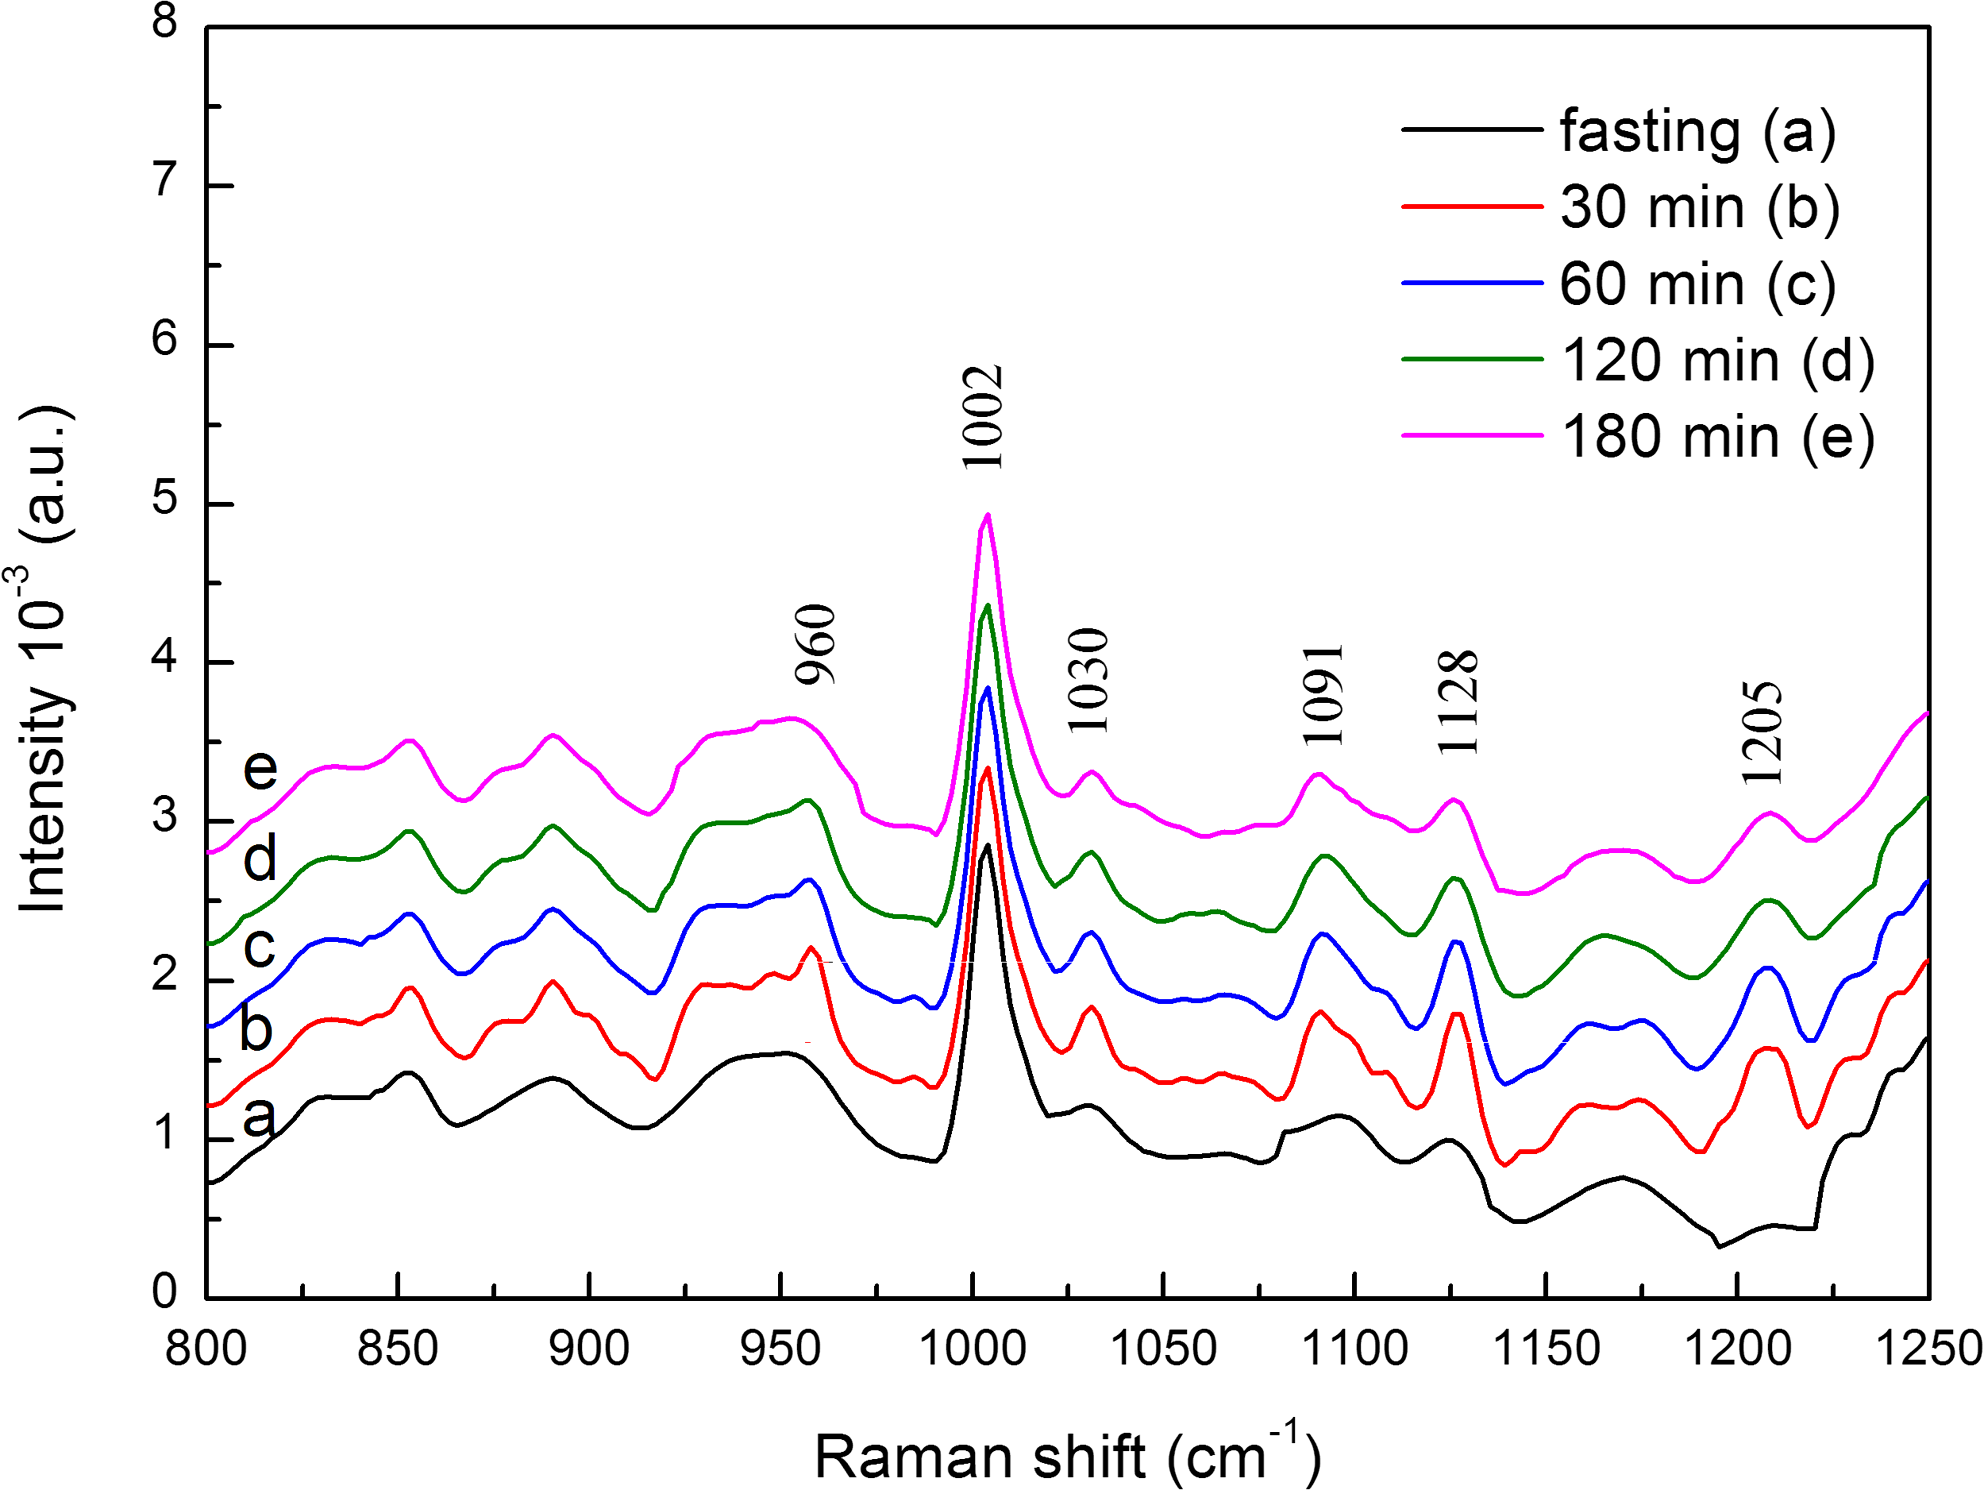
Raman spectra of the blood serum sample of one patient revealing the spectral changes after the consumption of glucose. During 180 min, this sample, relative to only one patient, was monitored with five spectra taken every 30 min. As can be seen, the bands relative to carbohydrates placed in the range from 900 to 1200 cm−1 reached their highest intensity soon after the first 30 min and then they began falling. The peak placed at 1002 cm−1 refers to the ring breathing mode of phenylalanine aromatic amino acid and does not vary.
In Fig. 3, the calibration model for carbohydrate concentration applied directly to human blood can be observed. In order to build this curve, 26 spectra were utilized classified as: hypoglycemic, diabetic, healthy, and threshold serum. This curve shows that carbohydrate concentration is linearly related to Raman peak intensity. The higher measure observed was ∼440 mg/dL and the lower measure was 81 mg/dL. It also indicates that concentrations lower than those reached in this curve could be obtained by extrapolation near those extremes values. This quantitative analysis shows that Raman approach provides unique advantage for immediate testing method for blood screening. Detection limits reported in this article correspond to the concentrations of carbohydrates that provide Raman spectra of signal-to-noise ratio of two.
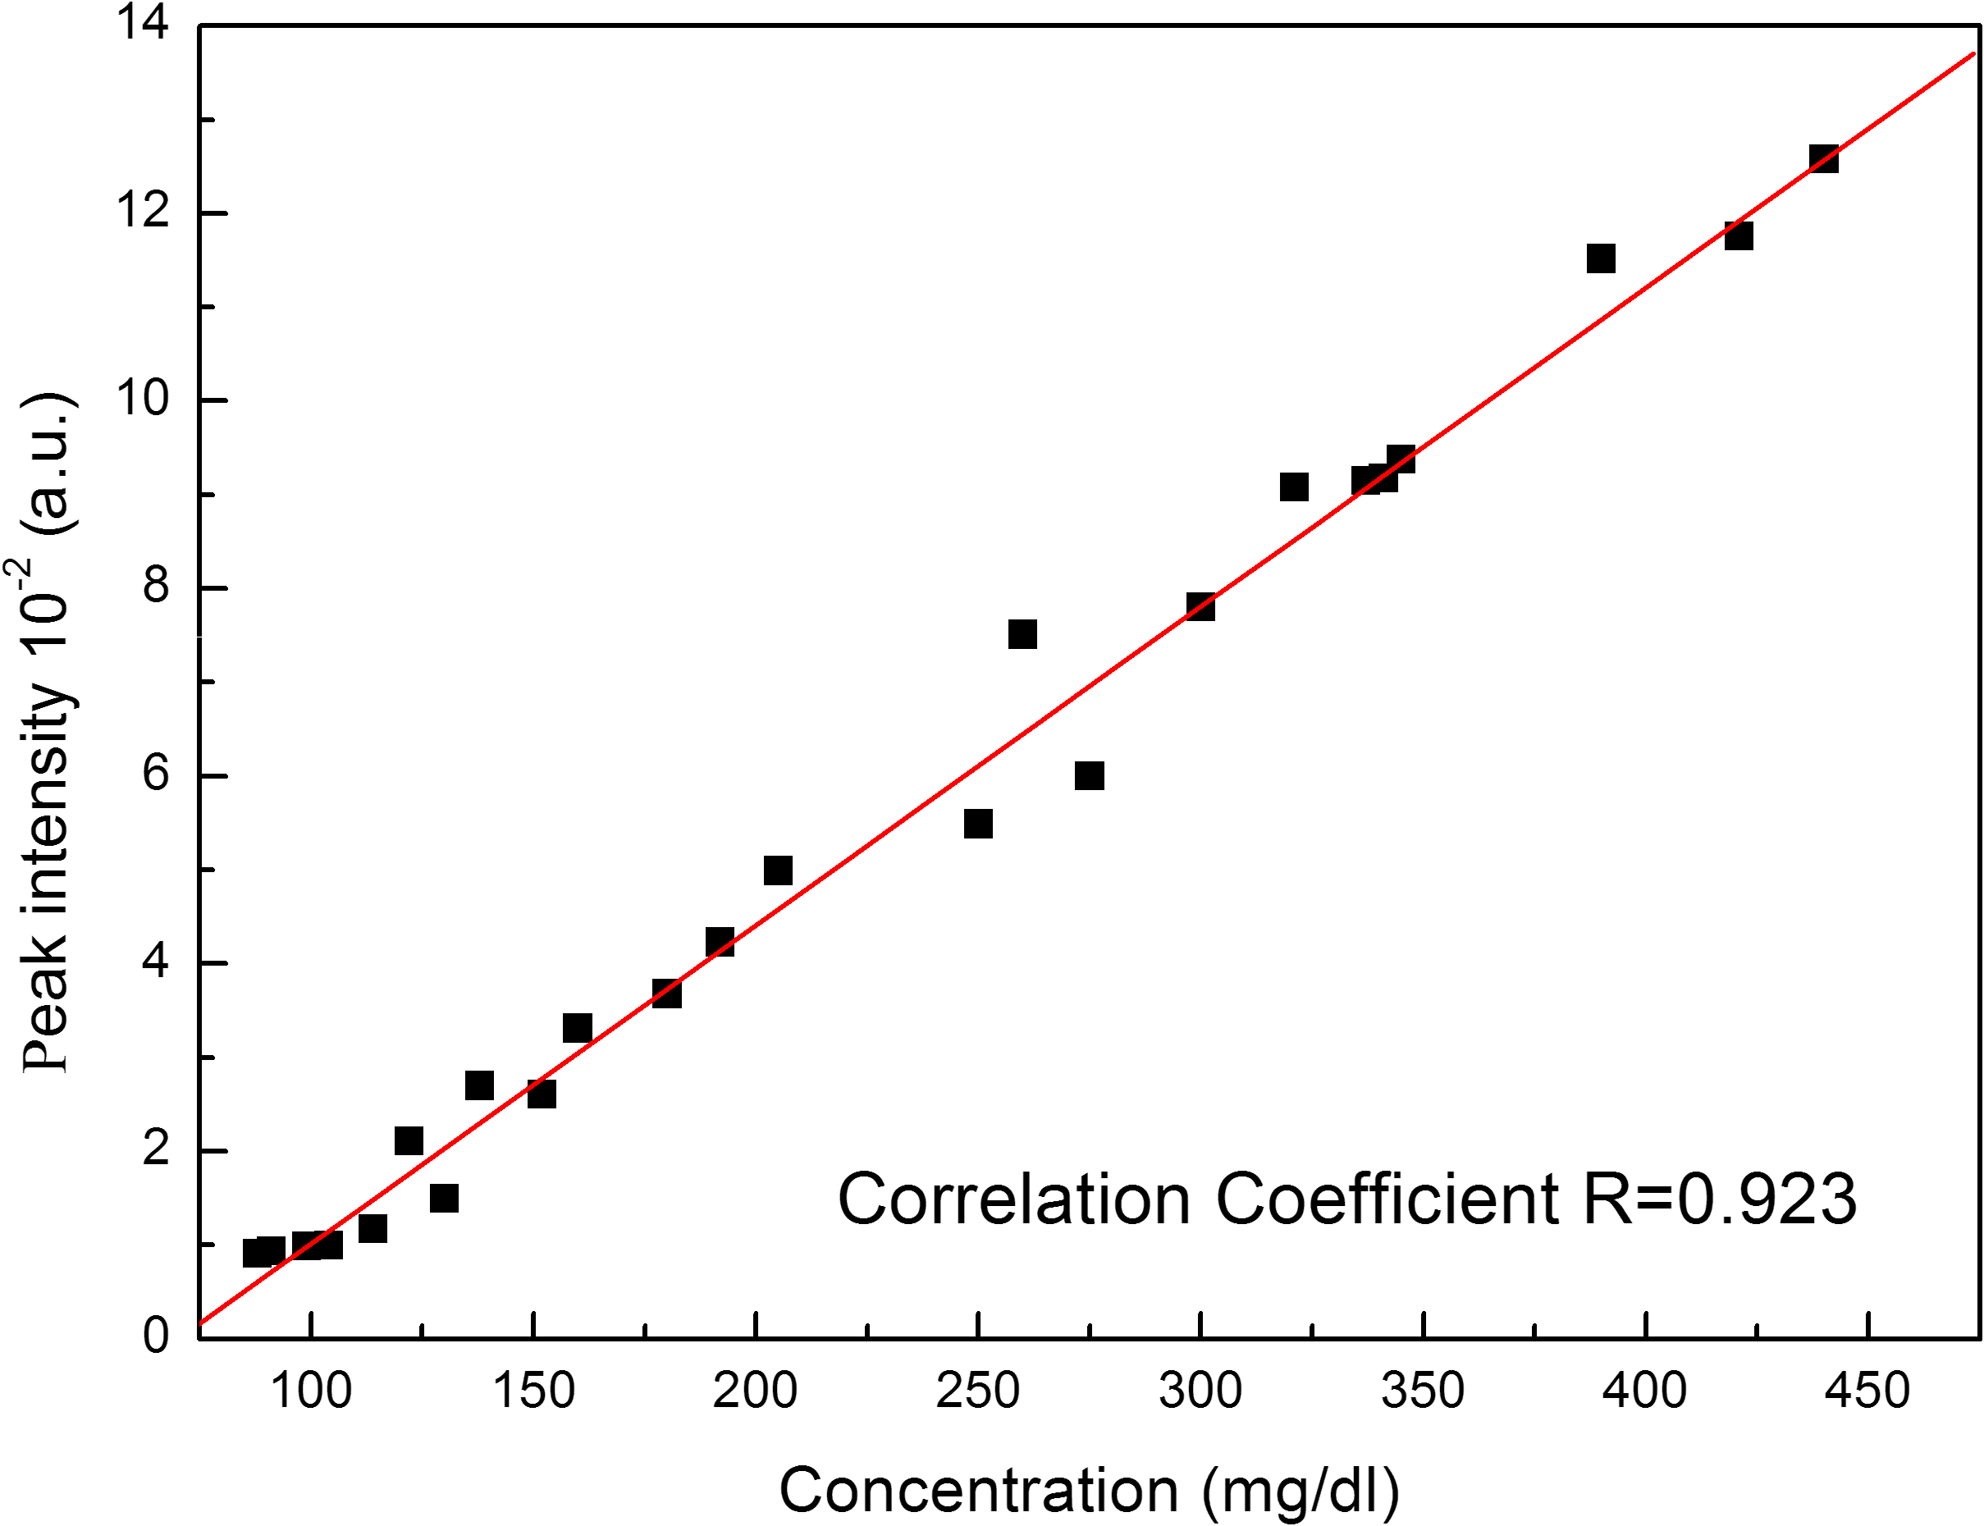
Calibration mode based on 29 spectra of patients classified along all categories: hypoglycemic, healthy, threshold, and diabetic serum.
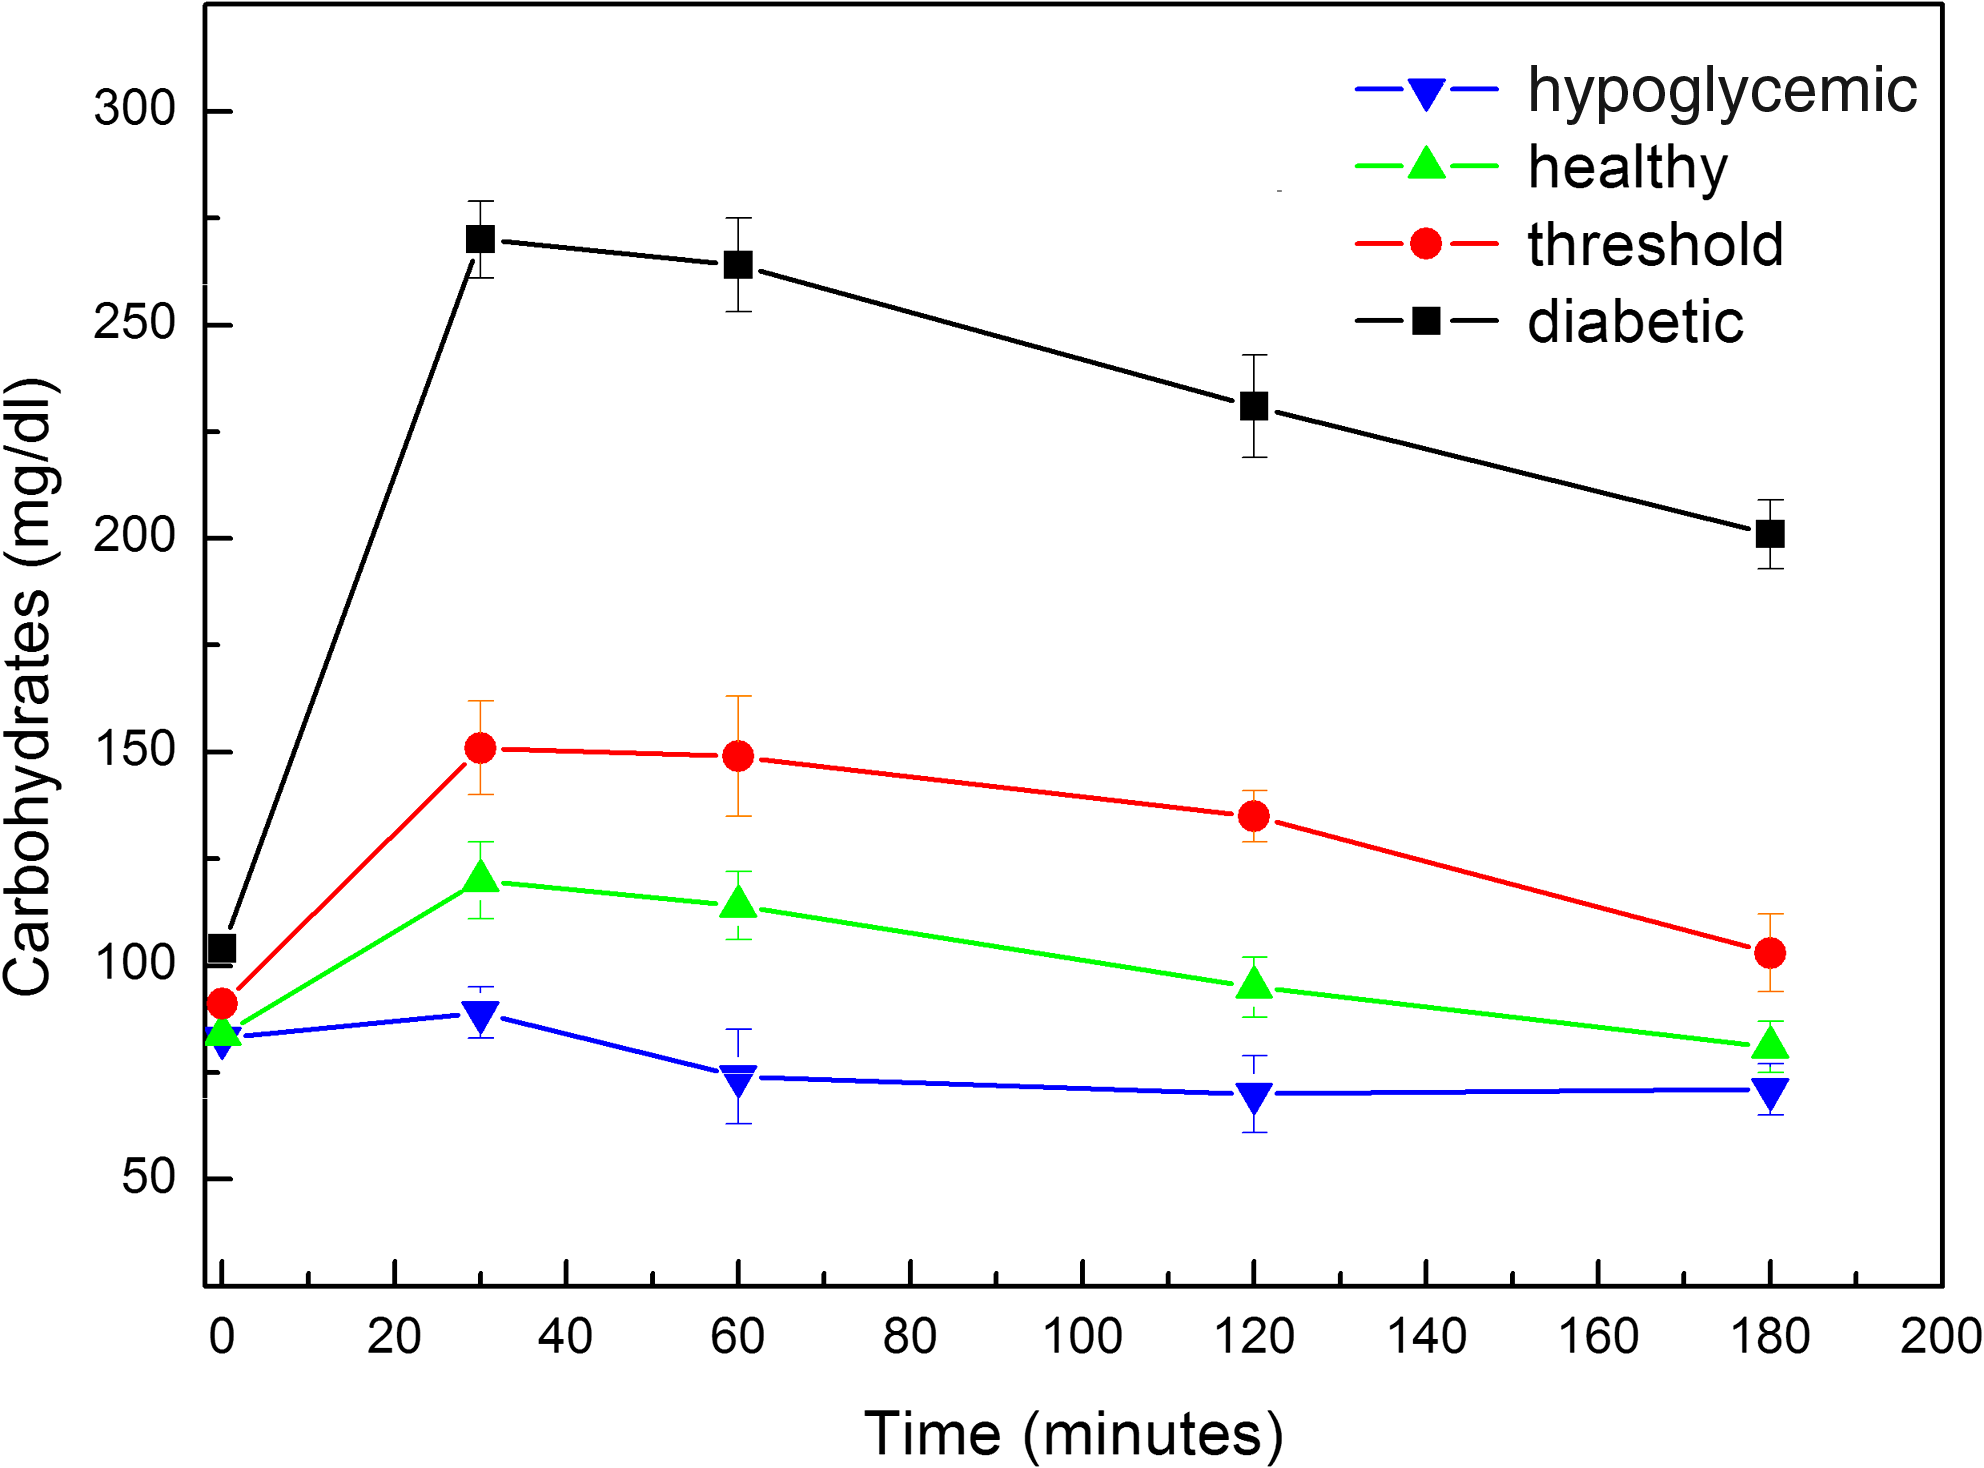
The glicemical curve is a biochemical trial wherein the glucose concentration is measured in a fasting blood test, collected at regular interval of time, before and after the consumption of a great amount of glucose. The traditional glicemical curve referents, four patients categories taken from average values of all patients of each group (hypoglycemic, diabetic, healthy, and threshold serum), are shown in Fig. 4 and the glicemical curve obtained by FT-Raman methodology taken from average values of all patients of each group is shown in Fig. 5, exhibiting reasonable concordance with the traditional glicemical curve.
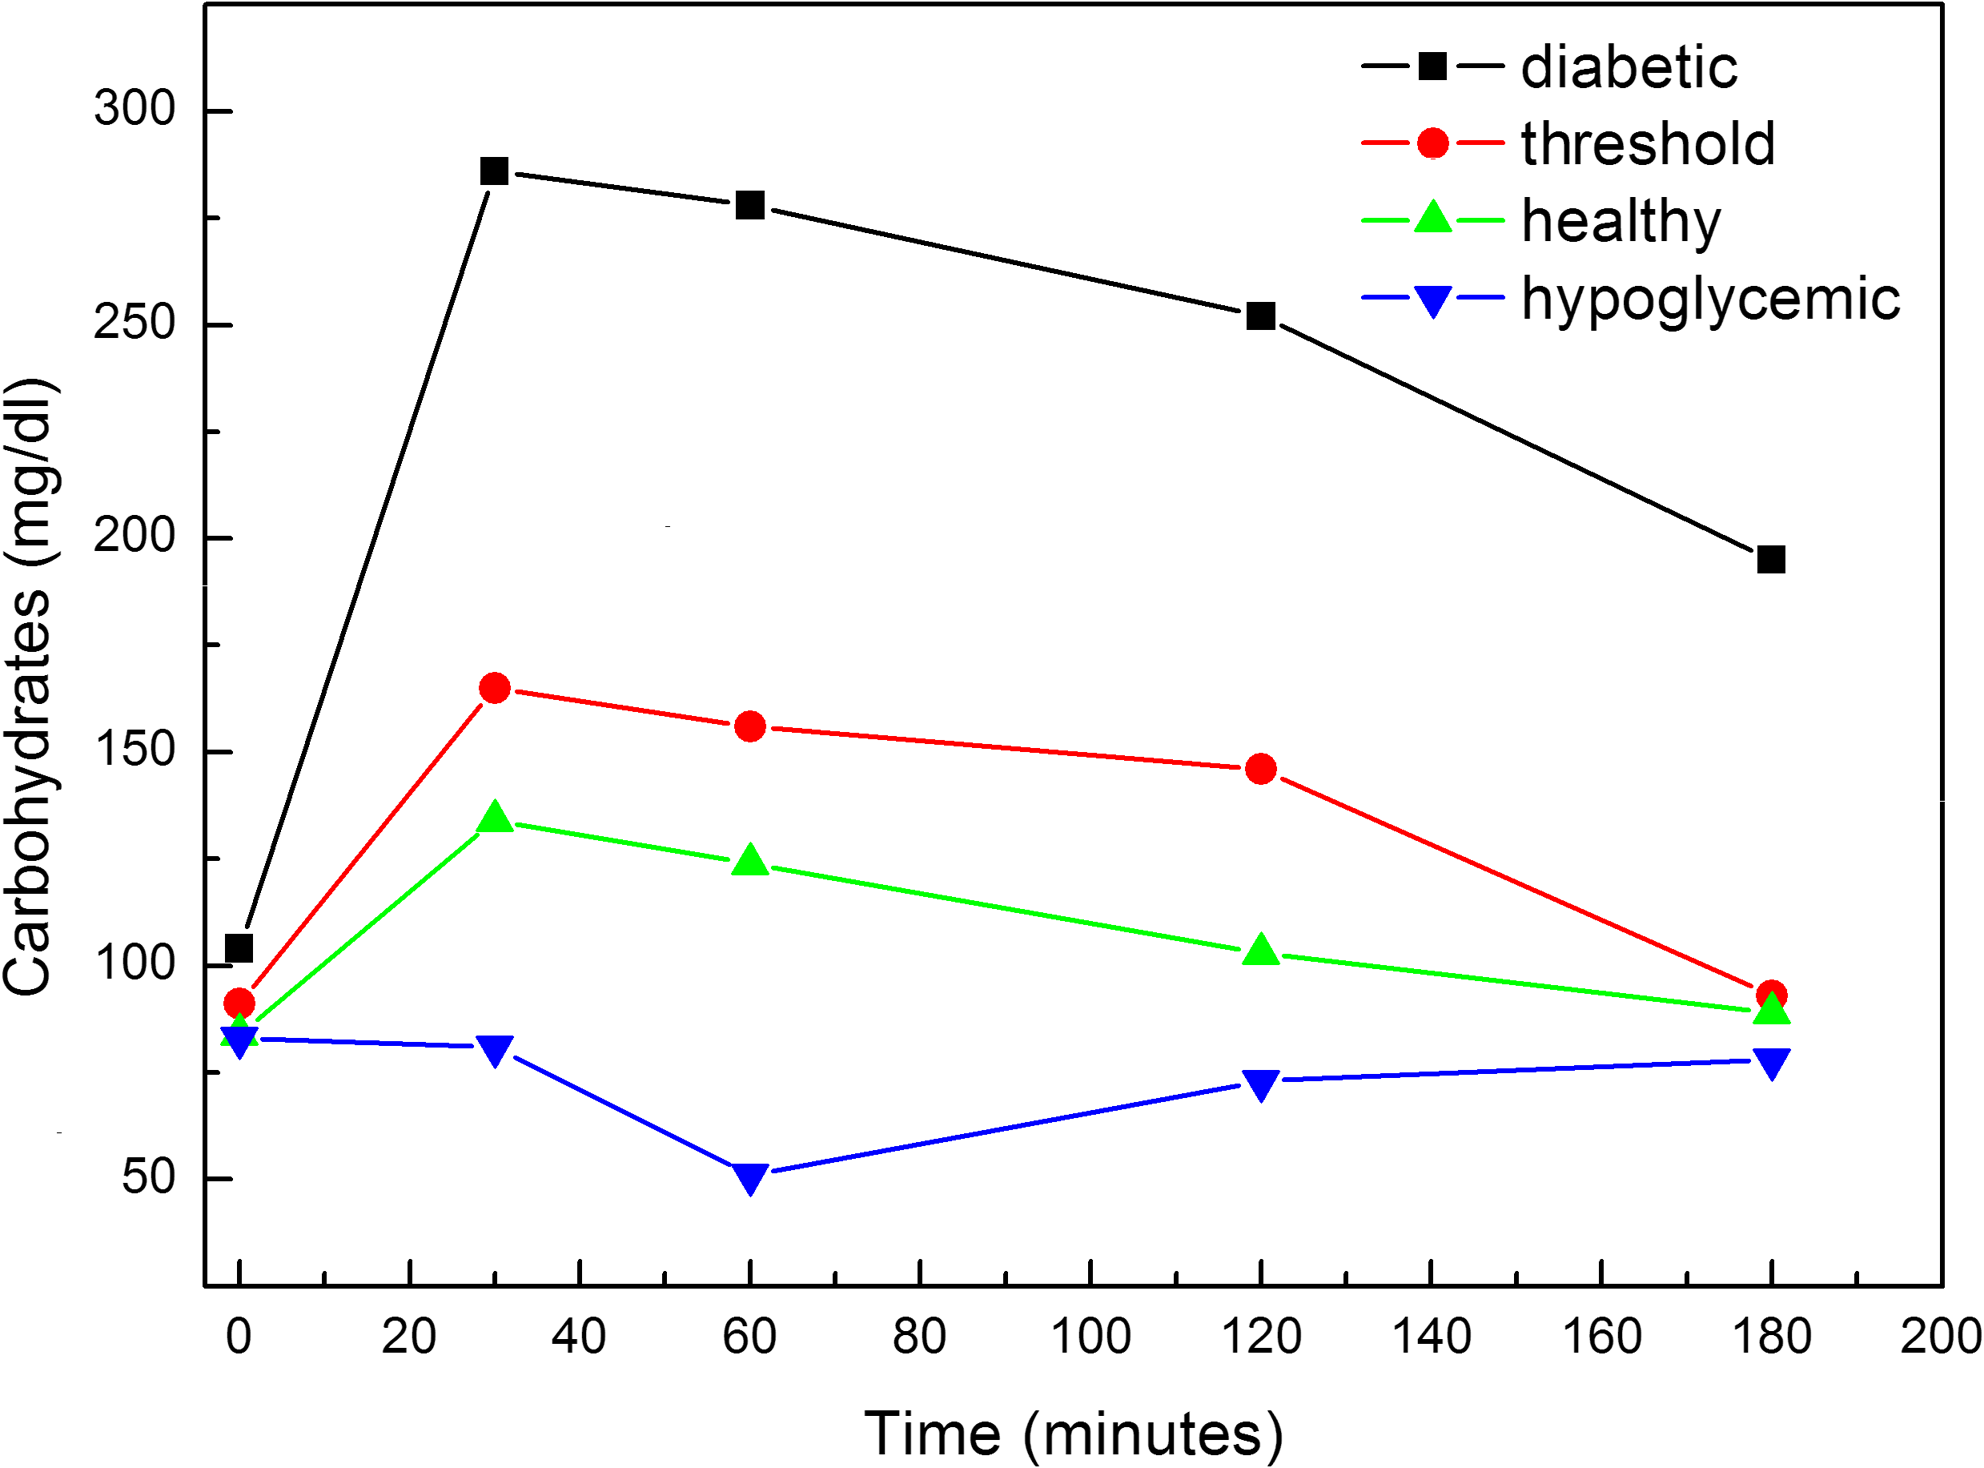
Traditional glicemical curve taken from average values of all patients of each group.
Curve obtained by FT-Raman methodology taken from average values of all patients of each group, exhibiting good accordance with traditional glicemical curve.
As can be seen in Table 2, the accuracy of present-day laboratory testing for the parameters investigated is still somewhat better that our spectroscopic results. However, spectroscopy has the advantage that only one measurement is needed in order to quantify all the shown parameters simultaneously and no reagents are needed for the analysis, thereby eliminating reagents costs and reducing logistical efforts. Moreover, many trials have been made to improve or enhance the sensitivity of Raman spectroscopy. The use of resonance Raman effect is one of them. Surface enhanced Raman spectroscopy (SERS) has recently been a matter of keen interest because it can readily enhance Raman signals 15,16 by a factor of 103–1014. Since the success of Raman measurements of single molecules by SERS, 17 this phenomenon has attracted much greater attention than before from the points ov view of both basic science and applications. Therefore, the next step in this work is to verify the enhancement of Raman signal of carbohydrates into human blood by noble metal colloids added to the blood sample.
The sequence of values corresponds to the fasting, 30, 60, 120, and 180 min, respectively.
Standard clinical laboratory analyzers employ an array of sensors, each measuring one chemical in separate aliquots. Because the detection is performed using enzymes and electrodes, the sample cannot be used again for other measurements. Development of reagentless, multichemical sensors could have significant impact in high-throughput arenas such as primary care facilities, hospitals, and locations for screening of military and inmate populations. However, the FT-Raman methodology presented in this study does not need more than a small volume of biofluid in order to analyze a large amount of information from biochemical analytes such as carbohydrates. Moreover, this small volume of biofluid carries information that can be obtained at the same time as the only a single Raman spectra thanks to the optical technology employed by the Raman method.
In the past, the consideration of Raman spectroscopy as a tool for biofluids analysis has been overlooked for two reasons: the size and cost of the instrumentation of Raman spectrometers and the inherently low sensitivity of a Raman signal. However, the availability of small, portable, and low-cost Raman units changes the view of the Raman method as being only confined to laboratory use. 18 Nowadays, such available Raman technology makes the Raman tool a practical option for serum and other biological fluid analysis. 8 –10,12
Conclusions
Numerous approaches are being used to develop technology that will permit noninvasive measurement of blood glucose in humans. Thus far, studies using Raman spectroscopy to predict glucose concentration have demonstrated reasonable accuracy of measurement within clinically relevant ranges. This article has demonstrated that our proposed FT-Raman system, consisting of an excitation laser source at 1064 nm, is able to analyze carbohydrates in diabetic human blood. Thanks to the Raman bands placed from ∼900 to 1200 cm−1 also present in healthy serum and in threshold samples analyzed in this work, we can conclude that quantitative monitoring of carbohydrates is also possible with reasonable precision by an optical technique in a very short time when compared to traditional analysis, requiring small sample volumes and not needing any previous treatment or substance added to it.
Footnotes
Acknowledgments
Jamil Saade and Josivandro do Nascimento Silva are grateful to CNPq and CAPES for the financial support.
Author Disclosure Statement
No conflicting financial interests exist.