
Abstract
Introduction
In order to reduce the polymerization shrinkage, development of new monomers that have increased molecular weight or reduced reactive sites, or increase of filler content by adopting the recent nanotechnology, were addressed. 6 –9 Most commercially available composite resins involve bis-GMA as a backbone monomer. However, recently introduced silorane-based composite resin achieves low shrinkage through the oxirane molecules. 10 –12 Unlike the methacrylate-based composite resins, oxirane molecules achieve much less polymerization shrinkage through the cationic ring opening, flattening, and extending mechanism toward each other molecule.
The light-curing unit (LCU) is a system that supplies photons that are essential for initiating the polymerization process. The initiation of polymerization process is triggered by the formed free radicals from photoinitiator camphorquinone (CQ) and photoaccelerator (amines). The light from the LCU excites CQ and leads the formation of free radicals. To activate CQ, the light should match with the absorption band of CQ in part or in the whole range. The conventional quartz–tungsten–halogen (QTH) LCUs emit light of the widest distribution, ranging ∼380–520 nm. The light-emitting diodes (LEDs) show much narrower light distribution than do QTH LCUs, near at the absorption peak of CQ (∼463 nm). The argon laser emits the narrowest light at the wavelength near the tail part of CQ absorption band. Each LCU has its advantages and disadvantages. 13 –16 The QTH units generate much heat from the bulb, causing temperature rise in the oral cavity and specimen by the heat conduction through the light guide. Their lifetime is shorter than that of LED units, whereas LED units are convenient to use and have high light intensity. The QTH LCUs have a long history of usage, but recently their popularity has gradually decreased in favor of LED units. The argon laser has many excellent features as a light source compared with ordinary light sources. However, despite coherence and monochromaticity, its high price and bulky size have made the laser less common than QTH and LED units. Recently, diode-pumped solid state (DPSS) lasers have been developed using advanced laser diode technology and applied to a flowcytometry as a light source for the excitation of phycoerythrins, and in dentistry to test whether the DPSS laser of blue light is capable of polymerizing composite resins of various categories. 17 –20 The advantages of the DPSS laser with blue light (473 nm) would be its handy size and reasonable price.
To activate CQ, the application of external light is essential. One factor that determines the quality of light from the LCU is light intensity (the power per unit area). As the power is related to the numbers and wavelengths (photon energy) of photons, high light intensity implies high number of photons for a specific wavelength. The curing time determines the length of photon supply; therefore, as the curing time increases the total number of photons increases as well. By changing the light intensity and curing time, energy density can be controlled.
The purpose of the present study was to evaluate how the energy density affects the polymerization of low-shrinkage composite resins using two different light sources. Through the study, feasibility of the DPSS laser of 473 nm as a light source for light curing was also tested.
Materials and Methods
Composite resins, LCUs, and light intensities
Three commercially available composite resins were selected as outlined in Table 1 (silorane-based: Filtek LS [LS]; methacrylate-based: Premise [PR], and Venus Diamond [VE]). These materials were selected as products of low shrinkage based on the manufacturers' claim.
LS, Filtek LS; PR, Premise; VE, Venus Diamond; Bis-EMA, ethoxylated bisphenol A glycidyl methacrylate; Bis-GMA, bisphenol A glycidyl methacrylate; TCD-DI-HEA, 2-Propenoic acid, (octahydro-4,7-methano-11H-indene-5-diyl) bis(methyleneiminocarbonyloxy-2,1-ethanediyl) ester; TEGDMA, triethyleneglycol dimethacrylate; UDMA, urethane dimethacrylate.
For the light curing, a QTH light (Hilux 601 [QTH], First Medica, Greensboro, NC) and a DPSS laser (LVI-VA473-250 [DPSS], LVI Tech., Seoul, Korea) with a wavelength of 473 nm were used. The light intensity of QTH was 900 mW/cm2. The output power and spot size of DPSS were ∼150 mW (PM3/FIELDMAX, Coherent, Portland, OR) and 5.6 mm, respectively. The light intensity of DPSS was ∼600 mW/cm2. Other light intensities for QTH and DPSS, 600 and 400 mW/cm2, respectively, were obtained by attenuating the light using ND filters (Thorlab, Newton, NJ). Light curing was performed for 30 or 40 sec. The resultant energy densities (=light intensity·time) for QTH were 36, 27, 24, and 18 J/cm2; for DPSS they were 24, 18, 16, and 12 J/cm2. Figure 1 shows the emission spectra of these lights.
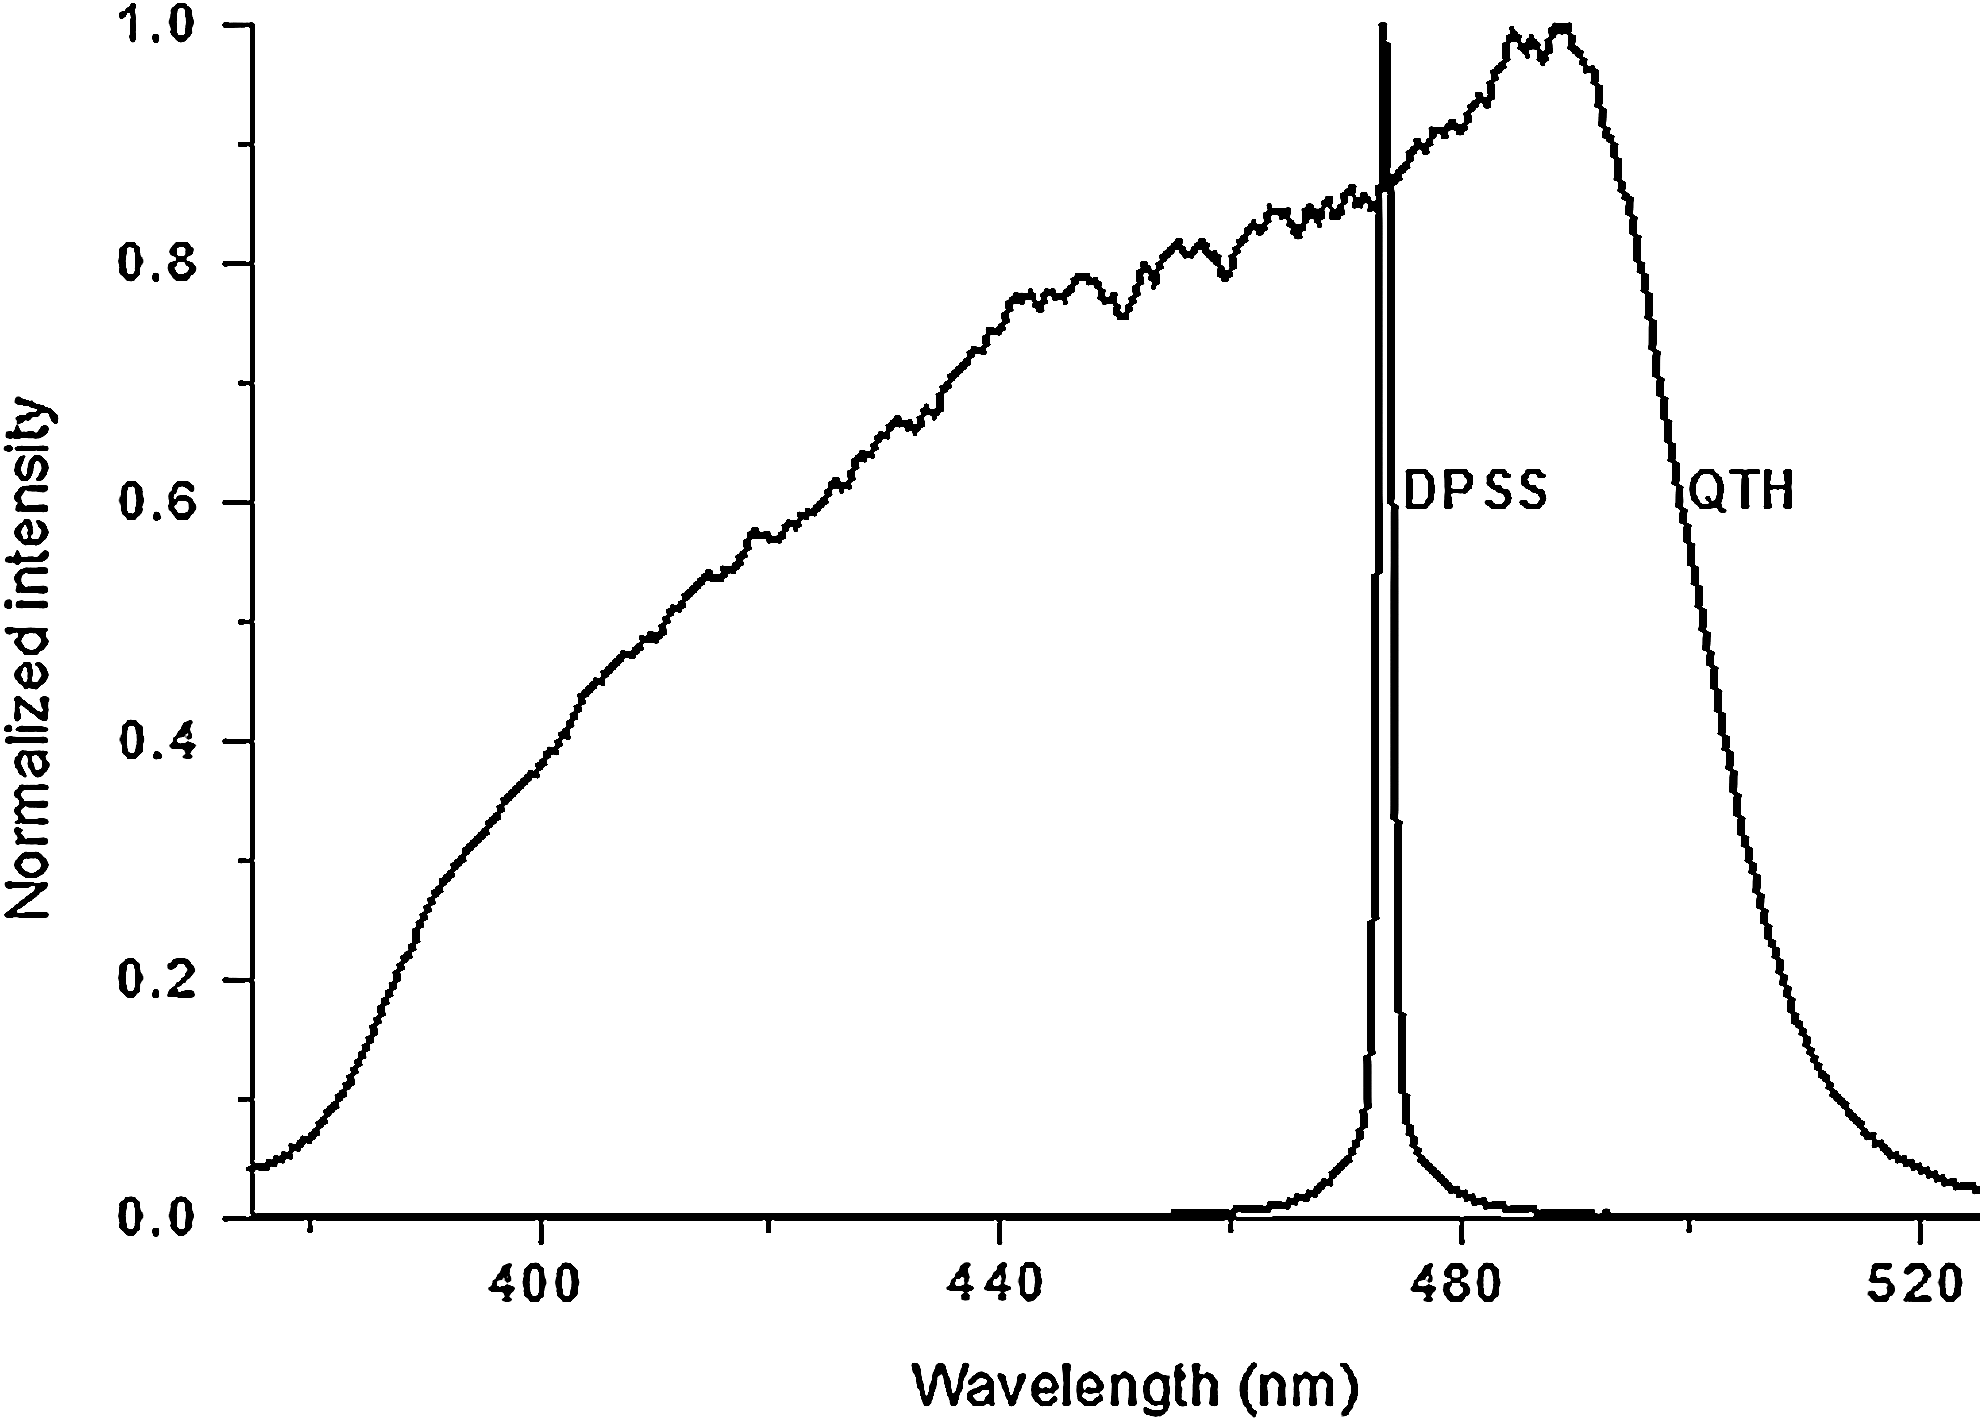
Emission spectra of the used light-curing units.
Microhardness measurement
To evaluate the microhardness of the specimens, a thin glass slide (200 μm thick) was placed on the table. A metal mold (inner space: 4×2×3 mm) was placed over the glass and filled with resin. The top surface of the resin-filled metal mold was covered with another thin glass slide, pressed firmly, and light-cured with two different light intensities and cuing times by contacting the light guide to the top surface of the glass slide. The light-cured specimen was removed from the mold and kept in a 37°C dark chamber for 24 h. The microhardness of the top (z=0 mm) and bottom (z=3 mm) surfaces were measured using a Vickers microhardness tester (MVK-H1, Akashi Co., Tokyo, Japan). Microindentations (n=15 for each test condition) were made on each surface under a 200 gf load and a 10 sec dwell time.
Degree of conversion (DC)
The specimens (n=5 for each condition) prepared for the microhardness measurement were used to evaluate the DC. After the microhardness measurement, each top and bottom surface of the specimen (a thickness of 100–150 μm) were scratched using a scalpel to obtain the powder. The collected powder was dissolved in ethanol for transmission Fourier transform infrared (FTIR) spectroscopy (Nicolet 6700, Thermo Fisher Scientific Inc., Waltham, MA). The spectra were taken from 7800–350 cm−1 after 32 scans. The resolution of the spectrophotometer was 0.09 cm−1. The DC of the cured resins was evaluated using a baseline technique. For the methacrylate-based composite resins (PR, VE), the peak from the aliphatic C=C bonds (at 1636 cm−1) and the reference C-C aromatic ring bonds (at 1608 cm−1) were determined. For the silorane-based composite resin (LS), the stretching vibrations of the epoxy rings C-O-C (883 cm−1) and the reference C–H bond (1257 cm−1) were chosen.
20
A paste of uncured resins was also similarly tested. The DC (%) was calculated using the following formula:
Refractive index
The refractive index of the thin slabs was measured using a commercial Abbe-type refractometer (NAR-1T; ATAGO, Tokyo, Japan). For the measurement, a tiny amount of resin was sandwiched between two thin glass slides ∼50 μm thick, placed below the mold of thickness 1, 2, and 3 mm, and light was irradiated from the top of the mold to the bottom direction for 40 sec. The light-cured thin slabs were aged for 24 h in a 37°C dark chamber. One drop of high refractive index interfacial contact agent, monobromonaphthalene, was added on the specimen and then the milky white refractor (nD=1.6199 where nD is the refractive index at the D line wavelength, the center of the yellow sodium double emission at 589 nm) was placed over it to enhance diffuse scattering of the cured slabs. Diffuse scattering at the front surface is necessary to improve the accuracy of the measurement. Refractive index readings were performed at room temperature (22.5±1.0°C) unless otherwise mentioned. The measurement was performed under the D line (589 nm) wavelength.
Polymerization shrinkage measurement
The polymerization shrinkage of the specimens during and after the light-curing process was measured (n=5 for each product) using a linometer (RB 404, R&B Inc., Daejon, Korea). A resin of cylinder shape (diameter: 4 mm, thickness: 2 mm) was placed over the aluminum disc (the specimen stage of the measurement system) and its top surface was secured using a glass slide. The end of the light guide was placed in contact with the glass slide. Before light curing, the initial position of the aluminum disc was set to zero. The light was irradiated from the LCU for 30 or 40 sec. The amount of disc displacement that occurred because of polymerization shrinkage was measured automatically for 130 sec using an non-contacting type inductive sensor. This shrinkage sensor was placed below the aluminum disc. The resolution and measurement range of shrinkage sensor were 0.1 and 100 μm, respectively.
Statistical analysis
The results of each test were analyzed using two-way ANOVA for energy density and resin product. A post-hoc Tukey test followed the multiple comparison. All tests were analyzed at p<0.05.
Results
The DC (%) of the light-cured specimens with different light intensity and curing time (energy density) conditions is shown in Table 2. LS showed much higher DC both on the top and bottom surfaces than that of the rest of the specimens. Both on the top and bottom surfaces, DC linearly correlated with energy density (R: 0.65–0.99 depending upon LCU, position of surface, and resin product). For the same or similar energy density, QTH and DPSS showed insignificantly different DC (p>0.05) regardless of position of surface and resin product. The DC of the top surface decreased 5.7–16.4%, 14.9–23.1%, and 17.2–45.3% at the bottom surface for LS, PR, and VE, respectively, depending upon LCU.
Statistically significant difference on energy density is shown by superscript numbers1,2,3,4 and on resin product by superscript letters. A,B,CSame letters or numbers are not significantly different (p>0.05).
On p values, the letters α and β denote energy density and resin product, respectively.
LS, Filtek LS; PR, Premise; VE, Venus Diamond; CR, correlation; ED, energy density; DC, degree of conversion; QTH, quartz–tungsten–halogen; DPSS, diode-pumped solid state.
Table 3 shows the microhardness (hv) of the specimens on the top and bottom surfaces. Microhardness linearly correlated (R: 0.7–0.99 depending upon LCU, position of surface, and resin product) with energy density both on the top and bottom surfaces, so as energy density increased, microhardness increased as well. The microhardness of the top surface decreased 19.5–35.0%, 23.6–53.7%, and 46.1–81.7% at the bottom surface for LS, PR, and VE, respectively, depending upon LCU. For the same or similar energy density, except for one exceptional case at the bottom surface, QTH and DPSS showed significantly different (p<0.001) microhardness. The change of microhardness by LCU was not consistent, and depended more on resin product itself.
Statistically significant difference on energy density is shown by superscript numbers1–6 and on resin product by superscript letters. A,B,CSame letters or numbers are not significantly different (p>0.05).
On p values, the letters α and β denote energy density and resin product, respectively.
LS, Filtek LS; PR, Premise; VE, Venus Diamond; CR, correlation; ED, energy density; QTH, quartz–tungsten–halogen; DPSS, diode-pumped solid state.
The refractive index of the specimens with different light intensity and curing time conditions is shown in Table 4. Among the specimens, LS and VE showed the highest and lowest refractive index, respectively, both on the top and bottom surfaces regardless of LCU. Refractive index linearly correlated (R: 0.73–0.98 depending upon LCU, position of surface, and resin product) with energy density, so as energy density increased, the refractive index increased as well.
Statistically significant difference on energy density is shown by superscript numbers1–5 on resin product by superscript letters.A, B, C Same letters or numbers are not significantly different (p>0.05).
On p values, the letters α and β denote energy density and resin product, respectively.
LS, Filtek LS; PR, Premise; VE, Venus Diamond; CR, correlation; ED, energy density; QTH, quartz–tungsten–halogen; DPSS, diode-pumped solid state.
Table 5 shows the polymerization shrinkage of the specimens. LS showed much lower (6.5–9.2 μm) polymerization shrinkage than that of the rest of the specimens (9.3–13.0 μm). A linear correlation (R: 0.88–0.99 depending upon LCU, position of surface, and resin product) was found between the polymerization shrinkage and energy density. For the same or similar energy density, DPSS generated slightly lower polymerization shrinkage than that of QTH.
Statistically significant difference on energy density is shown by superscript numbers1–4 on resin product by superscript letters.A, B, C Same letters or numbers are not significantly different (p>0.05).
On p values, the letters α and β denote energy density and resin product, respectively.
LS, Filtek LS; PR, Premise; VE, Venus Diamond; CR, correlation; ED, energy density; QTH, quartz–tungsten–halogen; DPSS, diode-pumped solid state.
Any correlations existing among DC, microhardness, and refractive index are shown in Table 6. In most cases, DC was linearly correlated with microhardness and refractive index. Also, microhardness was linearly correlated with refractive index.
LS, Filtek LS; PR, Premise; VE, Venus Diamond; DC, degree of conversion; QTH, quartz–tungsten–halogen; DPSS, diode-pumped solid state.
Discussion
The effect of energy density on the polymerization of low-shrinkage composite resins was evaluated in conjunction with two different LCUs.
In physics, energy density is defined as a product of the light intensity of the used LCU and curing time. Light intensity (mW/cm2) is the collective measure of incident photon energies, correlated with the number and wavelength of photons and the area in which the incident light irradiates. The curing time can be understood as the length of the photon supply during the polymerization process. For the fixed energy density, the choice of light intensity and curing time can be different. High light intensity with short curing time can be beneficial in reducing the length of treatment, but it can cause incomplete polymerization, poor physical properties, and high temperature rise caused by the burst supply of photons for a short time during the early stage of photoinitiation. The use of PAC (plasma arc) unit is one typical example of such a case. 21,22 Low light intensity with long curing time can reduce polymerization shrinkage, but it inevitably causes inconvenience to patients because of the increased chair time.
Among the specimens, LS showed the highest DC both on the top and bottom surfaces in all energy densities. The cationic ring opening initiation of the silorane-based LS is insensitive to oxygen. Actually, oxygen inactivates free radicals that are essential for the initiation of the methacrylate-based composite resins, by forming stable peroxides. 23,24 The existing or externally diffused oxygen inhibits further polymerization; therefore, reaching DC>70% is not easy in composite resins. On the bottom surface, some cases showed a higher DC even with lower energy density. In such cases, if the difference of energy densities is not high, longer curing time with lower light intensity could achieve higher DC because the supply of photons needed for the initiation of polymerization can be further sustained. For the two time differences (36/18 or 24/12 J/cm2) of energy density, LS showed the least DC difference on the top surface for QTH (10.3; 6.0%) and DPSS (15.0; 16.6%). Also, LS showed the least DC decrease (5.7–16.4%) compared with that of other specimens (14.9–45.3%) on the bottom surface compared with that of the top surface, regardless of LCU. The oxygen-insensitive nature of LS may be involved in that result.
As in the case of DC, the microhardness of the specimens linearly correlated with energy density. Therefore, to achieve high microhardness, application of high energy density is essential. On the top surface, PR showed a similar microhardness regardless of the chosen energy density and LCU (58.7–65.3 hv for QTH; 59.0–62.7 hv for DPSS). On the other hand, LS and VE by DPSS showed lower microhardness than that by QTH both on the top (14.3–28.2%) and bottom (0.9–52.3%) surfaces. The result may suggest that, depending upon the resin product, monochromatic light may not be more effective in achieving high DC and microhardness than spectrally broad light such as QTH. Among the specimens, LS showed the least microhardness difference between the top and bottom surfaces (19.5–35.0 vs. 23.6–81.7%). The lesser difference would be because of the oxygen-insensitive high DC values.
The refractive index of a medium is defined as a measure of the speed of light in that medium. Generally, the refractive index of a glass increases with its density. Therefore, the change of medium state, such as density, will be reflected to the refractive index of the medium. The refractive index of the tested specimens showed a linear correlation with energy density. As observed in the case of DC and microhardness, the refractive index decreased as the energy density decreased. In the specimens, because low DC and microhardness indicate insufficient polymerization, less polymerization shrinkage and condensation will happen. On the same surface, low refractive index for low energy density seems natural. Lower refractive index on the bottom surface compared with the top surface is because of the lesser polymerization and condensation. In the specimens, a linear correlation was found among DC, microhardness, and refractive index, even though LS showed some exception. As expected, the refractive index reflected the specimen's degree of polymerization in conjunction with energy density as DC and microhardness did; therefore, as specimens polymerize, they subsequently condense, and then the density of the specimen increases. In the case of glass materials, as the material's density increases, the refractive index increases as well. 25 As composite resins are mixtures of many different fillers and monomers, filler type and content and monomer combination and ratio can change the refractive index. Also, as these factors affect the density of specimens and the transmission of incident light (yellow light of wavelength 589 nm) from the refractometer, any specific factor from the tested resin products cannot exclusively affect the refractive index. 26
During the monomers' conversion to polymer network, polymerization shrinkage inevitably occurs because van der Waals spacing between molecules changes to covalent spacing. The molecular distance at the stage of covalent bond is much shorter than that of van der Waals bond. Among the specimens, LS achieved significantly low (p>0.001) polymerization shrinkage regardless of the LCU used. Such low polymerization shrinkage in LS is mainly caused by the oxirane molecules. Oxiranes achieve low polymerization shrinkage and high strength through a cationic ring-opening mechanism even though LS contains much less filler, which is essential for reducing shrinkage. 27,28 Recently, many composite resins are claimed to contain nanofillers. By containing nanofillers, nanocomposite resins have achieved considerably high filler content (>80 wt%) with improved mechanical properties and translucency. 29 –31 PR is one of such composite resins that reflect recent efforts for increasing filler content. However, polymerization shrinkage of PR is not less than that of LS. Actually, any further efforts for reducing shrinkage by controlling filler content seems not practical because the filler content in nanocomposite resins is so high that less margin is available to fill more fillers. In case of LS, its filler content is low compared with many nanocomposite resins such that it has much margin to add fillers. However, it is not clear whether the polymerization shrinkage can additionally be reduced by increasing the filler content in LS.
Conclusions
The effect of energy density on the polymerization of low-shrinkage composite resins was tested. The energy density (light intensity·curing time) linearly correlated with DC, microhardness, refractive index, and polymerization shrinkage regardless of position of surface, LCU, and resin product. Also, DC, microhardness, and refractive index were linearly correlated to each other. Among the tested specimens, LS showed significantly lower polymerization shrinkage than the rest of the resin products in all energy densities. The specimens light cured using the DPSS laser achieved a comparable degree of polymerization to that of the conventional QTH unit if the specimens were prepared under the same or similar light intensity.
Footnotes
Author Disclosure Statement
No competing financial interests exist.