




Abstract
Introduction
C
Recent studies have demonstrated the possibility of using optical techniques, particularly Raman spectroscopy, in the diagnosis of pathologic changes in human tissues. 2 –8 Raman spectroscopy is recognized as a useful tool to analyze the chemical composition of organic and inorganic materials, because of the interaction of optical radiation incident with the vibrational, rotational, and bending modes of the molecules. 9
The Raman (inelastic) scattering depends upon changes in the polarizability of the molecule caused by the incident electric field (laser), showing energy displacement as a function of the molecular bonds. The Raman spectrum comprises energy bands that are directly related to the composition and molecular “fingerprint” of the tissue. 9,10 Raman spectroscopy has the potential to evaluate the pathologic state of the sample by biochemical changes resulting from the neoplastic process, and to be a valuable tool in the assessment of tumor margins during surgical resection of the tumor, 9,10 thus saving withdrawal of margins in extensive tissue areas that histopathologically may be considered normal, and reducing the number of samples to be effectively monitored by frozen tissue histopathology during surgery.
Several studies have presented Raman spectroscopy as a tool for diagnosis of brain tumors and metastases, and correlation of the tissue morphology with the spectroscopic differences. 11 –18 Beljebbar et al. 11 evaluated the potential of Raman to classify induced intracranial C6 glioblastoma tumors in mice ex vivo and in vivo; Koljenović et al. 12 evaluated human glioblastoma vital tissue from necrotic ones by Raman microspectroscopic mapping, and discriminated biopsy fragments using linear discriminant analysis in a method for real-time intraoperative biopsy guidance; Krafft et al. 13 also evaluated the ability of Raman microspectroscopic mapping and cluster analysis to discriminate gliomas and meningiomas from typical normal tissue; Kirsch et al. 14 evaluated the potential of brain surface Raman mapping in detecting experimental a metastatic tumor model (murine melanoma cell), enabling the localization of cortical and subcortical tumor cell aggregates; Beleites et al. 15 evaluated Raman maps of borderline cases using a strategy based on partial class memberships to compare soft logistic regression and linear discriminant analysis to study the borderline of gliomas from bulk samples; Krafft et al. 16 applied the spectral unmixing algorithm vertex component analysis (VCA) to probe cell density and cell nuclei in Raman images of primary brain tumor tissue sections, to correlate spectral and morphologic features. Leslie et al. 17 evaluated pediatric brain tumors (medulloblastoma and glioma) and normal brain samples though Raman spectroscopy. Using support vector machine analysis, the authors could classify spectra of normal tissue, glioma, and medulloblastoma with 96.9%, 96.7%, and 93.9% accuracy, respectively. Zhou et al. 18 employed resonance Raman spectroscopy at 532 nm and statistical methods (principal component analysis [PCA] and support vector machine) to discriminate stage III meningioma and grade IV glioblastoma (malignant tissues), from benign meningioma, acoustic neuroma, and pituitary adenoma (benign tissues), and normal meningeal tissue, which yielded a diagnostic sensitivity of 90.9% and specificity of 100% for identifying cancer from benign and normal brain tissue. In summary, direct analysis of the biochemical constitution of brain tissues using Raman spectroscopy methodology allows a direct, rapid, and nondestructive detection, classification, and progression of the brain diseases.
PCA is a linear orthogonal transformation of a p-dimensional to an m-dimensional space (m<p). The coordinates of the data in the new space are uncorrelated, and the greatest amount of variance within the original data is preserved using only a few variables. 19 PCA is a statistical tool used to obtain the pattern of variability of the spectral characteristic of a given material based on repeating the experiment with different samples of the material under different conditions (for instance, pathologic changes associated with diseases). The PCA calculates the spectral features of higher variance, and ranks them according to their importance in the data set. With repetition of the experiment, it is possible to check which bands are important for identifying the material (no changes or changes within a particular group) and which ones are introduced in the spectrum as a result o random noise (shot noise and cosmic rays) or randomly occurring experimental artifacts. The PCA, associated with a discriminant analysis (such as Euclidean or Mahalanobis distance, neural network analysis, or logistic regression) applied to spectral data, has been used for the diagnosis and differentiation of various types of human diseases, such as classification of normal and diseased laryngopharyngeal tissue using PCA and Mahalanobis distance, 20 human thyroid cell lines using PCA and neural network analysis, 21 human basal cell carcinoma and skin melanoma using PCA and Mahalanobis distance, 22 intestinal and stomach adenocarcinoma using PCA and logistic regression, 23 and human carotid arteries using PCA and Mahalanobis distance. 24
The objective of this work was to use Raman spectroscopy to discriminate fragments of neoplastic brain tissue (glioblastoma, medulloblastoma, and meningioma) from normal tissues (meninges and cerebellum) in vitro, by developing a spectral model to extract most of the spectral features of brain tissues using PCA, and to discriminate tissue (pathologic from normal) using Euclidean distance applied to the PCA scores of higher differentiation among groups verified by ANOVA.
Materials and Methods
Brain tissue collection
The experimental procedure was approved by the Ethics in Research Committee of the Universidade Camilo Castelo Branco (Protocol. 74032/2012). Two fragments of normal cerebellum and meninges were obtained from autopsies in the Autopsy Service of the University of São Paulo (São Paulo, SP, Brazil). Specimens of glioblastoma multiforme, medulloblastoma, and two meningiomas were obtained after a neurosurgical procedure performed at Hospital São José (Ilhéus, BA, Brazil). The tumor grades were determined by histopathologic analysis according to the classification of the World Health Organization. 25 After they were withdrawn, fragments were placed in cryogenic tubes, immediately frozen using liquid nitrogen, and kept refrigerated at −80°C until spectroscopy. At the time of spectral analysis, samples were placed in an aluminum sample holder and moistened with saline solution 0.9% until reaching room temperature. A small fragment (2×2 mm) was randomly cut and was then submitted to Raman spectroscopy. Following this, the fragment was fixed (formalin 10%), labeled, and submitted to histologic evaluation.
Raman spectroscopy
The acquisition of the spectra was performed using a dispersive Raman spectrometer (Dimension P-1, Lambda Solutions, Inc., MA) composed of a diode laser (wavelength of 830 nm, near infrared, output power of 350 mW), a Raman probe (Vector probe, Lambda Solutions, Inc., MA) coupled to the laser and spectrometer, and a compact f/1.8 spectrometer with a Peltier-cooled (-75°C), back thinned, deep depleted 1034X100 CCD, with resolution of ∼2 cm−1 in the spectral range of 400–1800 cm−1. The acquisition and storage of the spectra were done with a notebook microcomputer using the software RamanSoft (Lambda Solutions, Inc., MA), which controls, via USB, the experiment parameters such as temperature and exposure time of the detector, camera electronic gain, number of acquisitions per sample, and, also, the storage of spectra for further processing. The exposure time for obtaining the spectra was 50 sec.
The spectrometer Raman shift calibration was checked at the time of data collection. A spectrum of naphthalene was collected and the Raman shift positions of the main bands were checked against the literature; 26 no corrections were necessary. Despite the lower fluorescence level of brain tissues when illuminated in the near-infrared range, the remaining background fluorescence was removed by fitting and subtracting a 7th order polynomial in raw spectrum using a routine written in Matlab 5.0 (Mathworks Inc., MA). Artifacts from cosmic rays were removed manually.
A total of 172 spectra were obtained and separated into five groups according to the histology of each sample: normal tissues from the cerebellum (45 spectra) and meninges (49 spectra), and tumor glioblastoma multiforme (20 spectra), medulloblastoma (19 spectra), and meningioma (39 spectra). The mean Raman spectrum of each group was calculated using all spectra of each tissue type and plotted using the Microsoft Excel (Office 2003, Microsoft Corp., USA).
Discrimination analysis based on PCA
The PCA technique decomposes the spectra data set (A), which may be composed of correlated variables, in a set of uncorrelated variables, the principal component vectors (PCs) and scores, based on the spectral variance. The PCs represent the directions of the largest variations that occur in all spectra; and a set of scaling coefficients, called scores (SCs), that represent the intensity of each PC in the particular spectrum and can be interpreted as the cosine of the angle between the observed spectrum and the PC vectors. When PCs are multiplied by SCs and then summed, one reconstructs the original spectrum. Therefore, knowing the PCs' vectors, one can establish the importance of each PC in the formation of the spectrum of a particular sample and then use this information (presence or absence of that particular feature in one group) to classify the spectra into predetermined categories, as each principal component is, by definition, a spectrum.
The data set was divided into four groups: one group for normal tissues and three for neoplastic ones, and then subjected to PCA (Statistics Toolbox, Matlab 5.0). After selecting the most relevant scores that showed statistically significant differences among the four groups, a discrimination algorithm was developed based on Euclidean distance applied to these scores, to classify the Raman spectra in one of the groups.
The Euclidean distance is being used as a discriminant analysis to separate the data set into classes, by determining the linear distance from a specific point to the centroid (mean) of the class to which it belongs, compared with the distance from the centroids of the neighbor groups. The Euclidean distance d follows the expression
27
:
where x is the intensity value of a particular sample point (in this case the SC) and μ is the centroid of the group. The choice of which SC has better capacity of discrimination was made by calculating its significance level between groups (ANOVA, p<0.05), whereas the SCs that had the highest differences for all groups were chosen. Then, the Euclidean distance was calculated for the SCs that exhibited higher discrimination power. The Euclidean distance discrimination line was calculated using Matlab. Sensitivity, specificity, and overall accuracy diagnostics were then calculated.
Results
Raman spectra of normal cerebellum (white and gray), glioblastoma, and medulloblastoma
The mean Raman spectra of brain tumors glioblastoma and medulloblastoma and normal cerebellum tissues (white and gray matters) are shown in Fig. 1, and the assignments of the highlighted peaks referenced in the recent literature are presented in Table 1. 28 –33 The Raman peaks are correlated with the biochemical constitution of such tissues (primarily proteins, lipids/phospholipids, and cholesterol). In the spectral range of 500–1000 cm−1, the prominent bands correspond to vibrations of proteins, lipids, and cholesterol; the range of 1160–1600 cm−1 are vibrations that correspond predominantly to proteins, lipids, and nucleic acid, with some contribution of hemoglobin. The contribution of water, although weak in the Raman spectra, appears as a broad band ∼1632 cm−1.
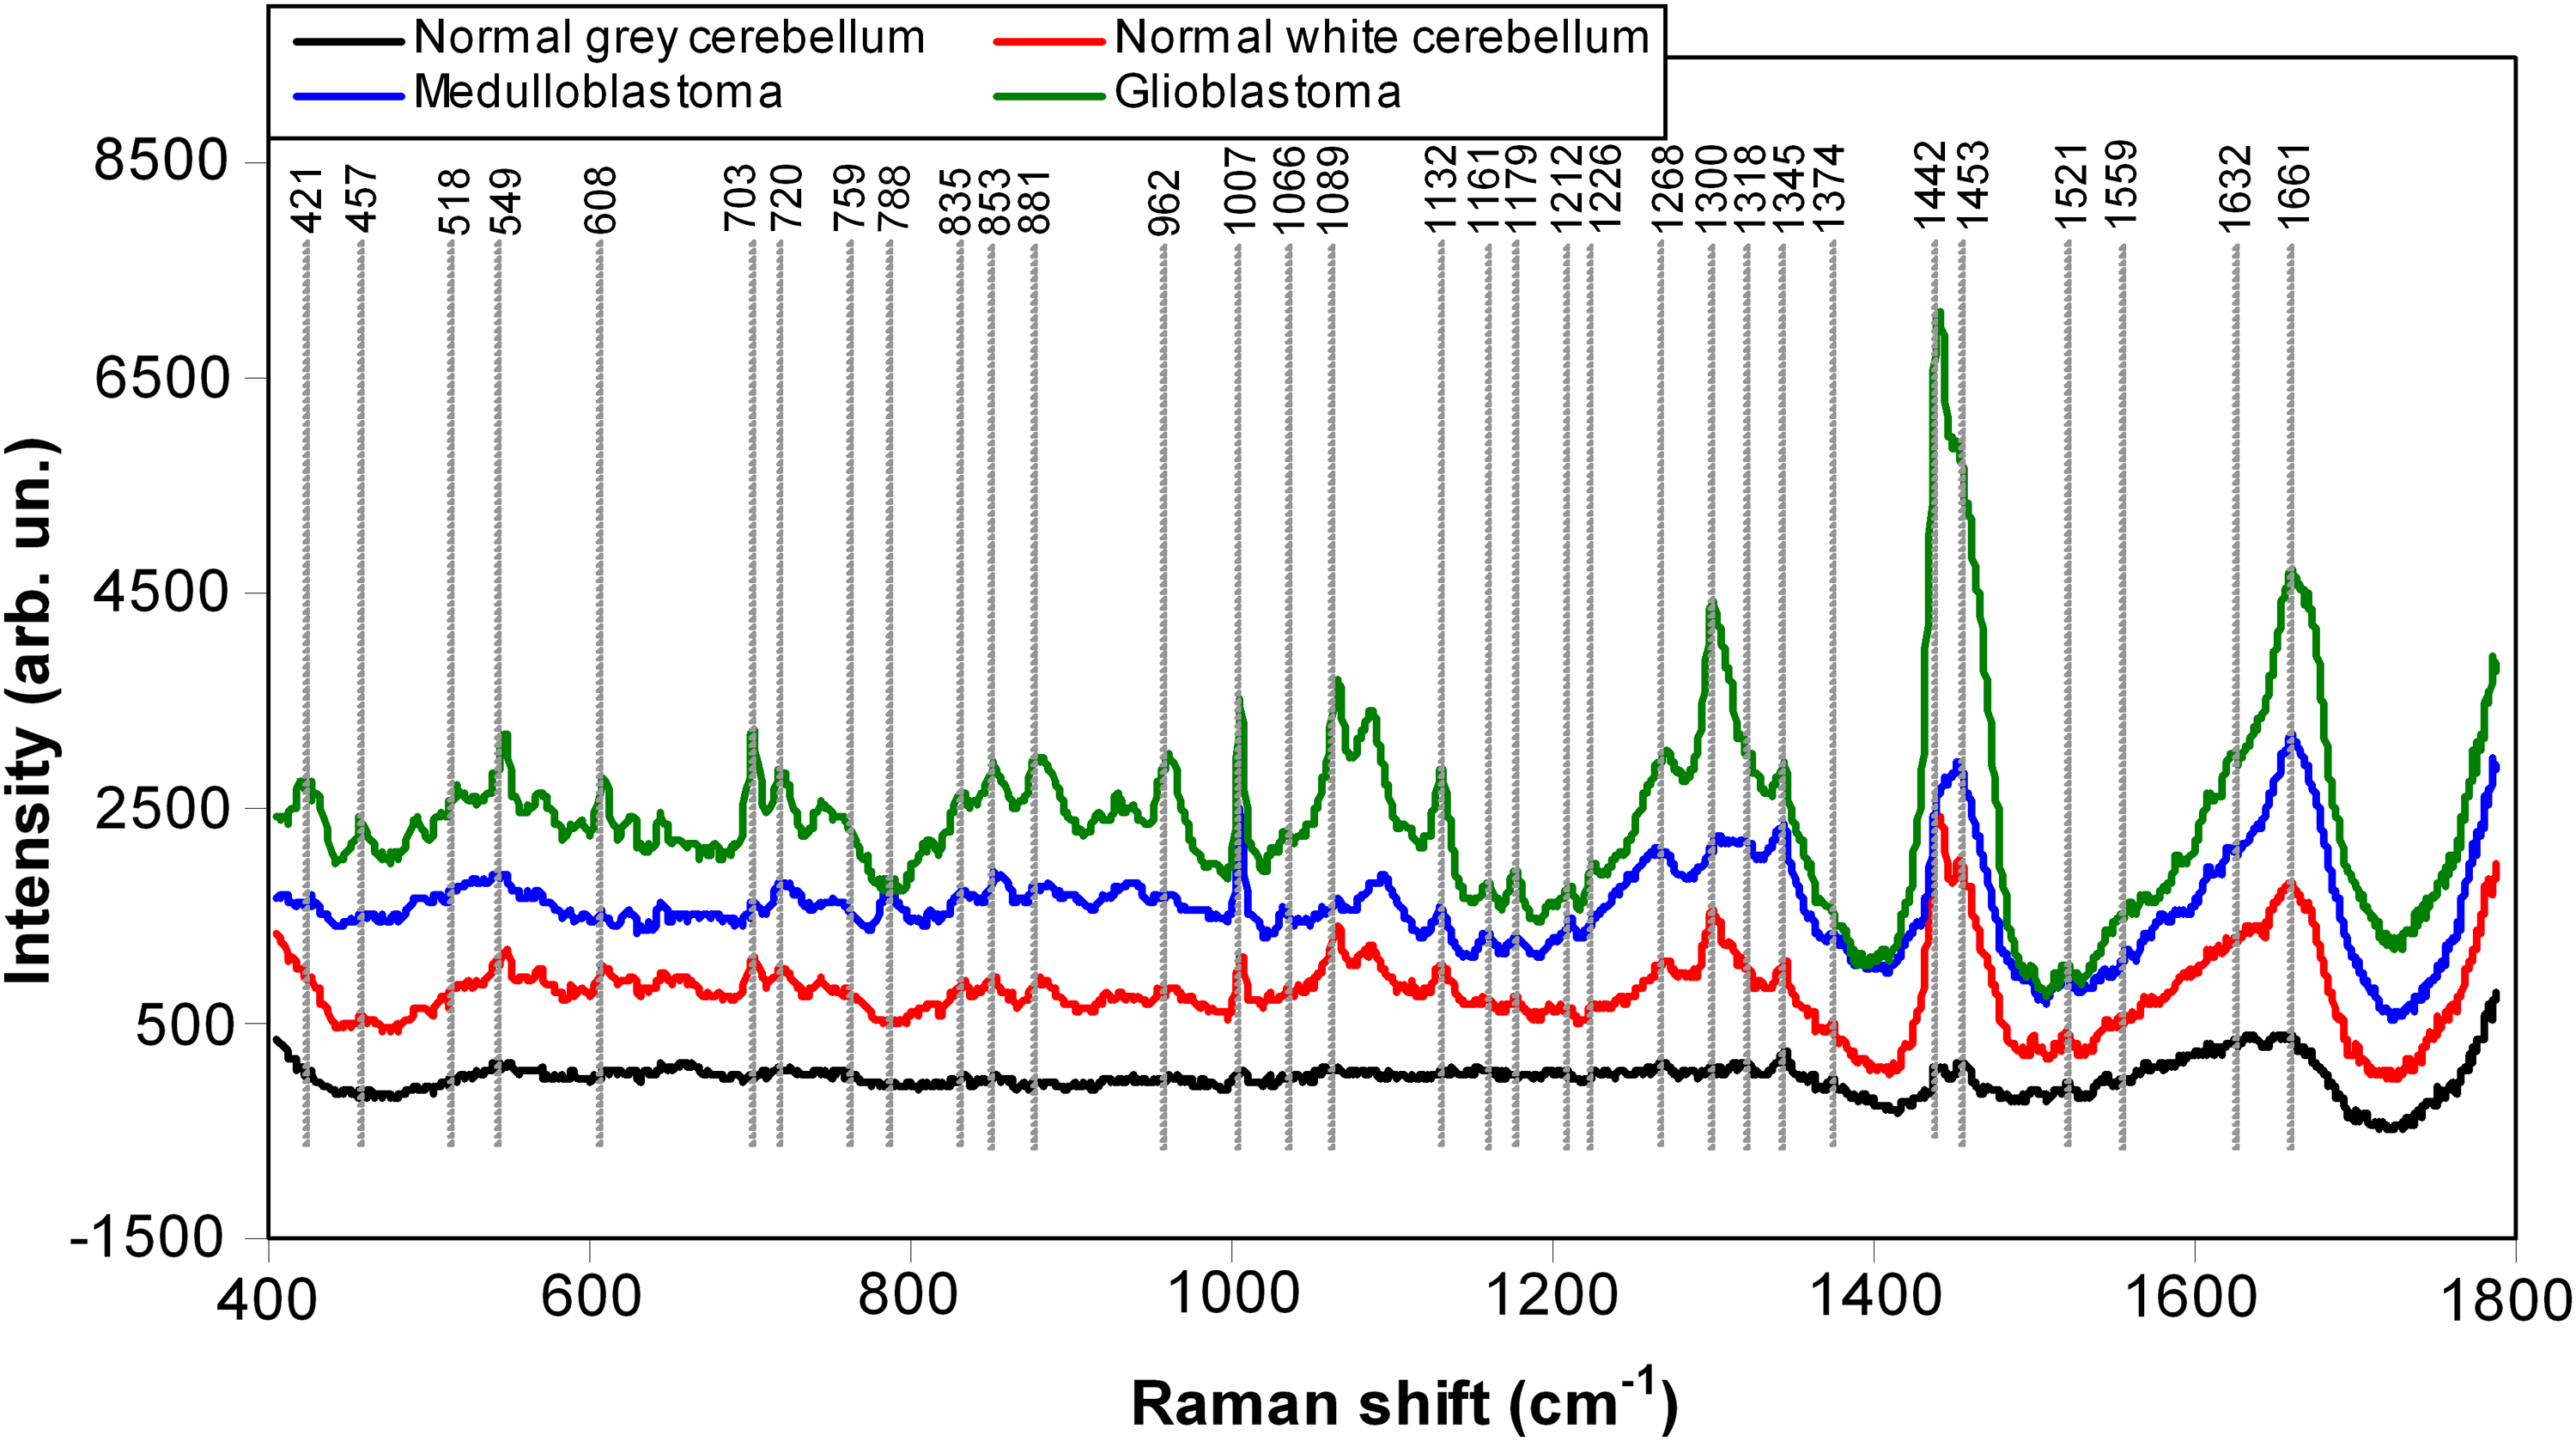
Mean Raman spectra of normal white and gray cerebellum, glioblastoma, and medulloblastoma in vitro. Spectra were offset for better visualization. Wavelength, 830 nm; laser power, 350 mW; resolution, 2 cm−1.
It was observed that the Raman bands of the white cerebellum are more intense than the gray one, with featuring peaks assigned to cholesterol (549, 608, 703, 853, 881, 962, 1132, 1442, and 1453 cm−1), peaks assigned to lipids/phospholipids (720; 1066, 1089, 1132, 1300, 1442, and 1661 cm−1), and peaks attributed to proteins (853, 881, 1007, 1268, 1345, 1453, and 1661 cm−1) (Table 1). The bands at 1345 and 1521 cm−1 (assigned to amide I from proteins and to carotenoids, respectively) have similar intensities in these two tissues. The peak at 1521 cm−1 (assigned to carotenoids) has a similar intensity in both normal cerebellum tissues. Gray cerebellum presented higher fluorescence and, therefore, lower signal-to-noise ratio.
The Raman spectrum of glioblastoma showed bands with higher intensity than medulloblastoma and normal cerebellum across the spectral range, featuring the bands with peaks at 421, 457, 549, 608, 703, 746, 835, 853, 881, 962, 1007, 1066, 1089, 1132, 1179, 1268, 1300, 1345, 1442, and 1453 cm−1, attributed to proteins, lipids/phospholipids, and cholesterol (Table 1). The bands at 1226 and 1560 cm−1, attributed to hemoglobin, present higher intensity in glioblastoma, not being found in medulloblastoma or in normal tissue in the cerebellum. Medulloblastoma, in turn, appeared with bands at 1035 and 788 cm−1, not seen in glioblastoma or in normal tissue, which can be attributed to phospholipids and proteins, respectively.
The majority of peaks appeared with lower intensities than glioblastoma, and several of them appeared with lower intensities than normal white tissue, such as 457, 549, 608, 703, 881, 962, 1007, 1066, 1089, 1132, 1179, 1268, 1300, and 1442 cm−1, with assignments primarily of lipids/phospholipids, cholesterol and proteins. The band 1521 cm−1 (assigned to carotenoids) also has similar intensities in these two neoplasias.
Raman spectra of normal meninges and meningioma
Figure 2 shows the mean Raman spectra of normal meninges and meningioma. The peaks in the meninges spectra correspond to the vibrational bands attributed mainly to proteins, lipids/phospholipids, and cholesterol, as shown in Table 1. The spectrum of meningioma has higher intensity than the normal one; however, several characteristic peaks appear with higher intensity in meninges than in meningioma, such as 549, 608, 703, 759, 1066, 1300, and 1442 cm−1, which can be attributed to cholesterol and lipids/phospholipids. Meningioma have several peaks of higher intensity compared with the normal meninges, such as the peaks at 759, 853, 939, 1007, 1037, 1161, 1268, 1318, 1453, 1632, and 1661 cm−1, which can be attributed to protein, lipids/phospholipids (ethalonamine), and hemoglobin (Table 1). The bands at 788, 1212, and 1560 cm−1 (lipids and hemoglobin) appeared only in the meningioma, compared with normal meninges.
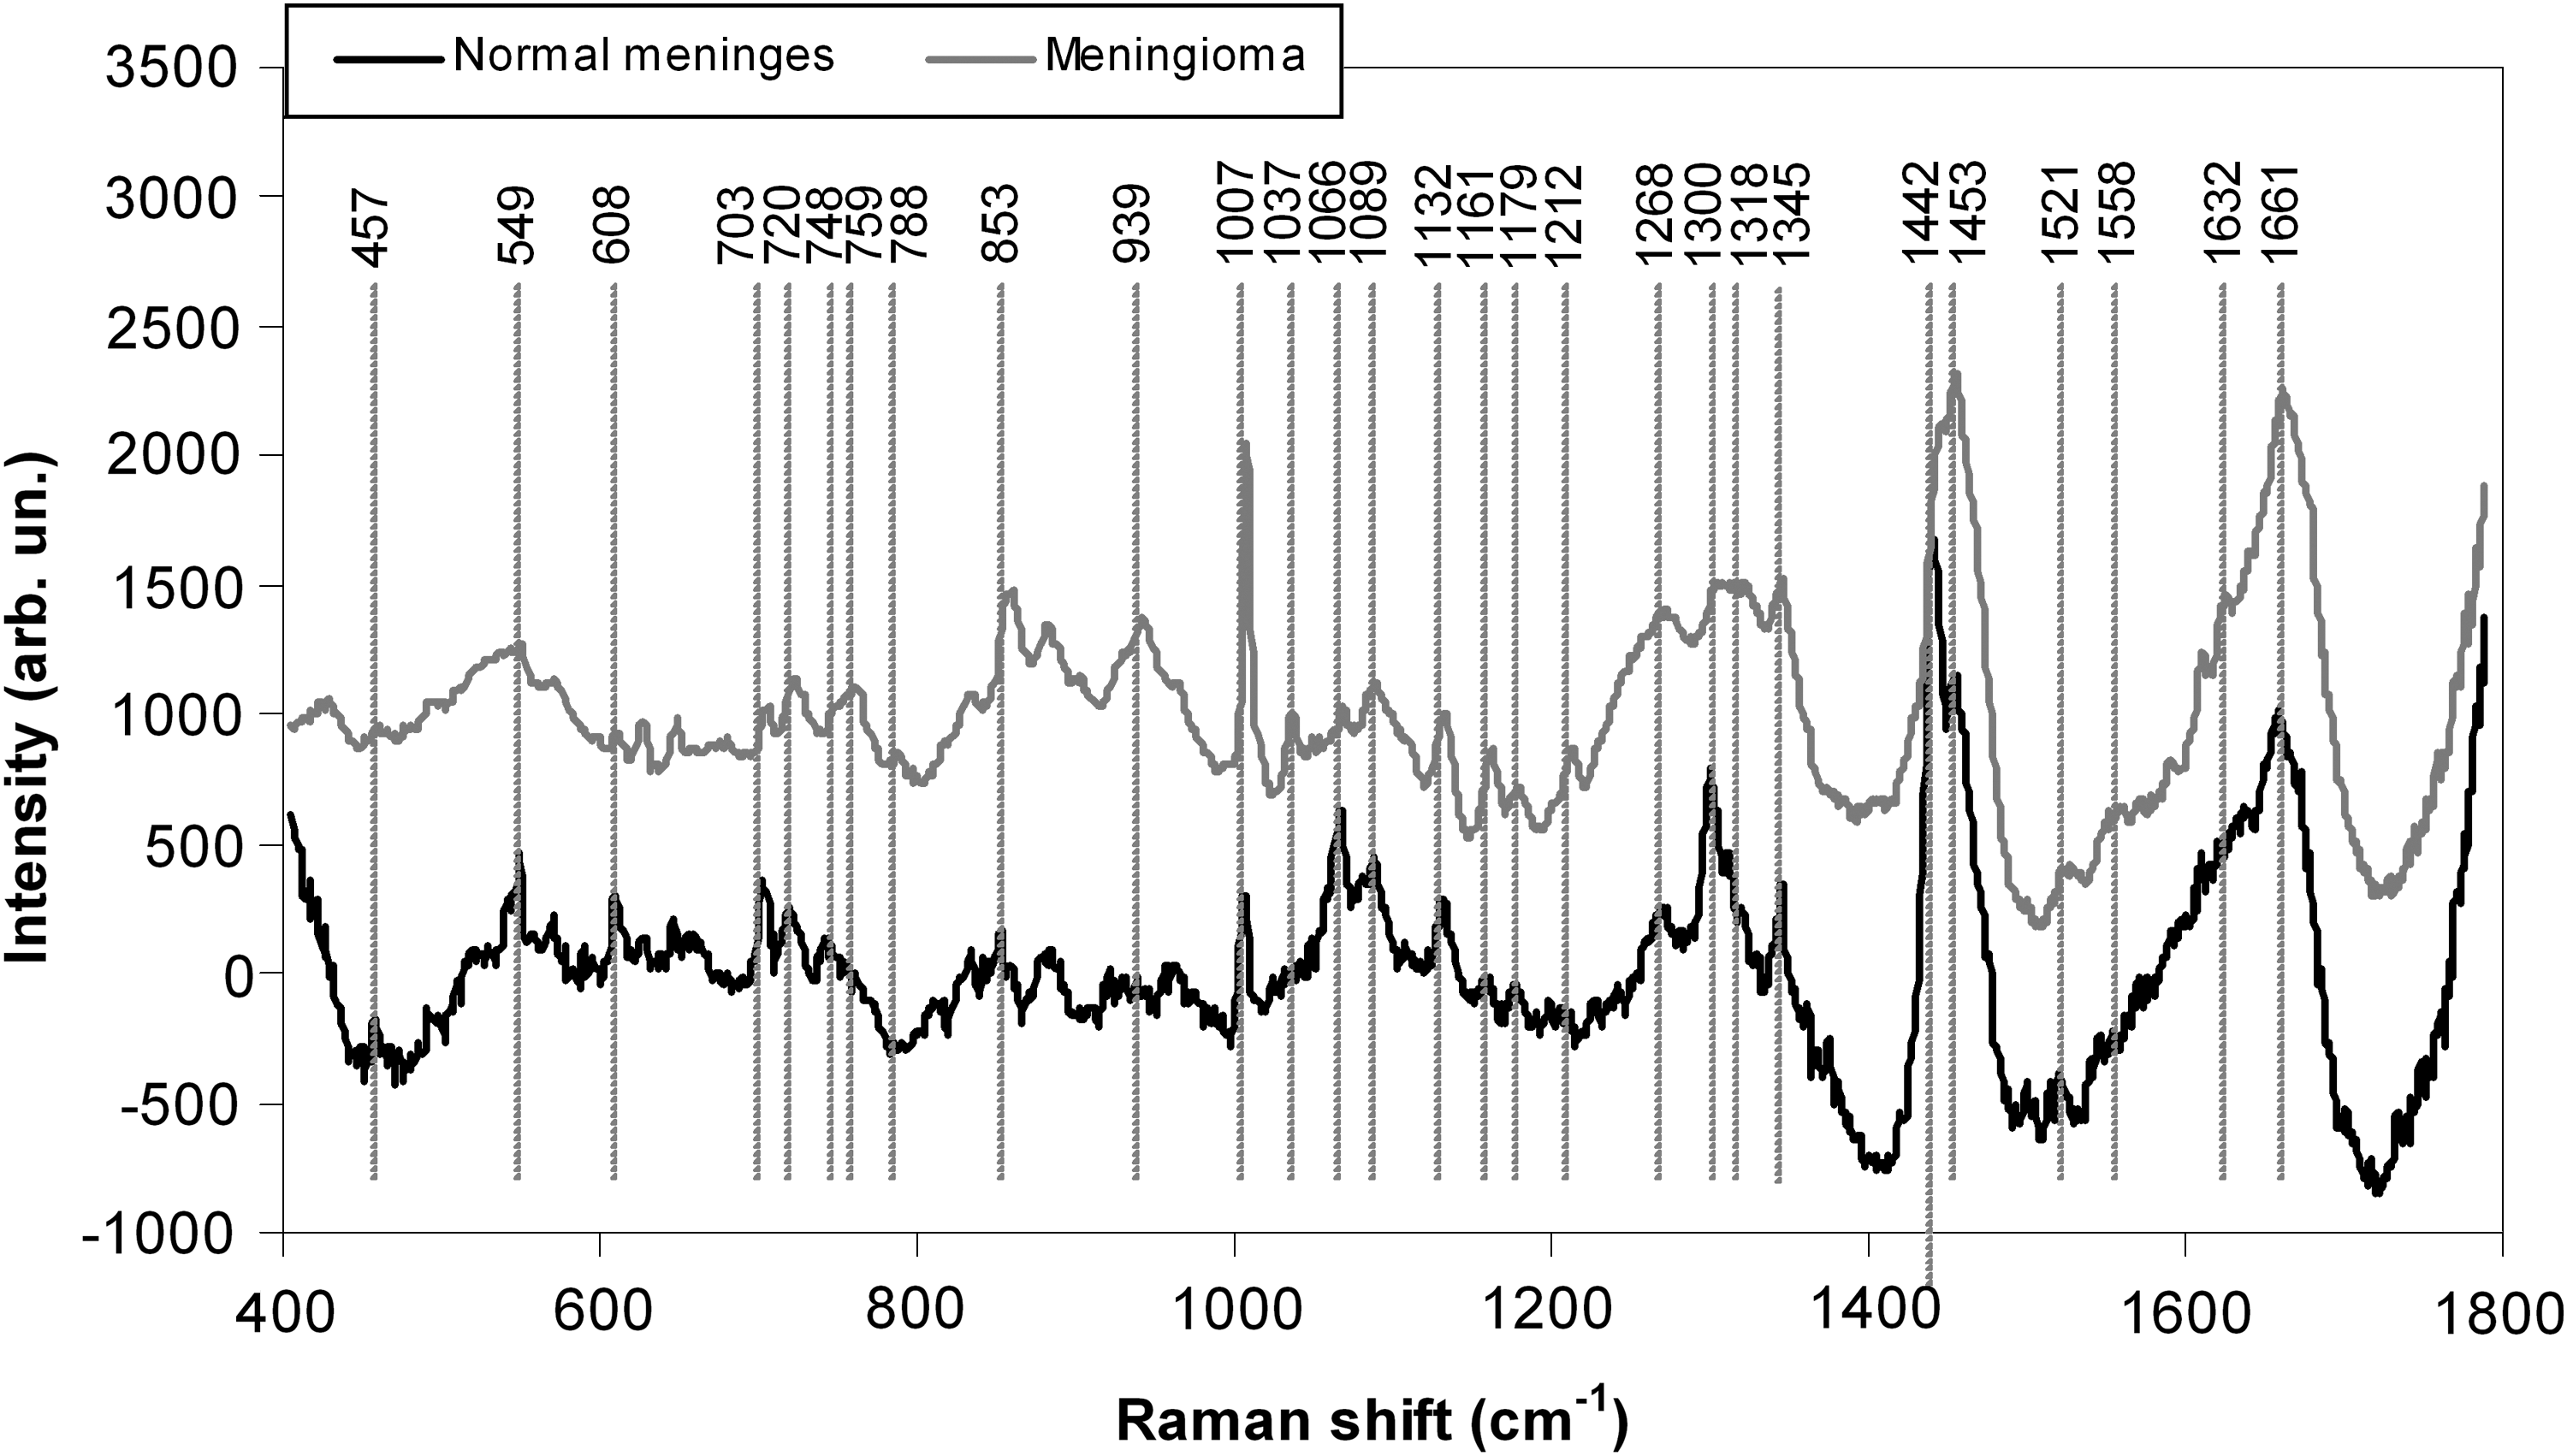
Mean Raman spectra of of normal meninges and meningioma. Spectra were offset for better visualization. Wavelength, 830 nm; laser power, 350 mW; resolution, 2 cm−1.
Discrimination based on PCA
The spectral differences between the different brain tissues provided evidence of biochemical changes associated with the disease, and a possible discrimination of neoplasia from normal tissues, mainly in bands related to protein, lipids/phospholipids, and cholesterol. These differences were exploited by the discrimination model based on PCA applied to all 172 spectra. It was verified that the first four principal components (PC1 the PC4) carry>95% of all of the spectral variation found in the data. In order of verify which PCs could present the highest discrimination power between groups, they were submitted to ANOVA (5% significance) and the pairs of principal components scores (SCs) with higher statistically significant difference were binary plotted.
Figure 3 presents the mean intensity and standard deviation of the first four principal components scores (SC1 to SC4) for each tissue type. Statistical analysis indicated that SC1 was effective in discriminating the gray cerebellum and glioblastoma with relation to remnant groups; SC2 was effective in discriminating glioblastoma from other groups except meningioma, meningioma with relation to normal meninges, and meduloblastoma with relation to glioblastoma and meningioma; SC3 was able to better discriminate normal tissues, such as the gray cerebellum and meninges, from tumor tissues, such as the meduloblastoma and meningioma. SC4 was able to discriminate meduloblastoma and meningioma of other groups, including themselves. As SC1 was not able to discriminate meningioma from normal tissue, and SC4 was not able to discriminate glioblastoma from normal tissue, these SCs were not used, and SC2 and SC3 were used.
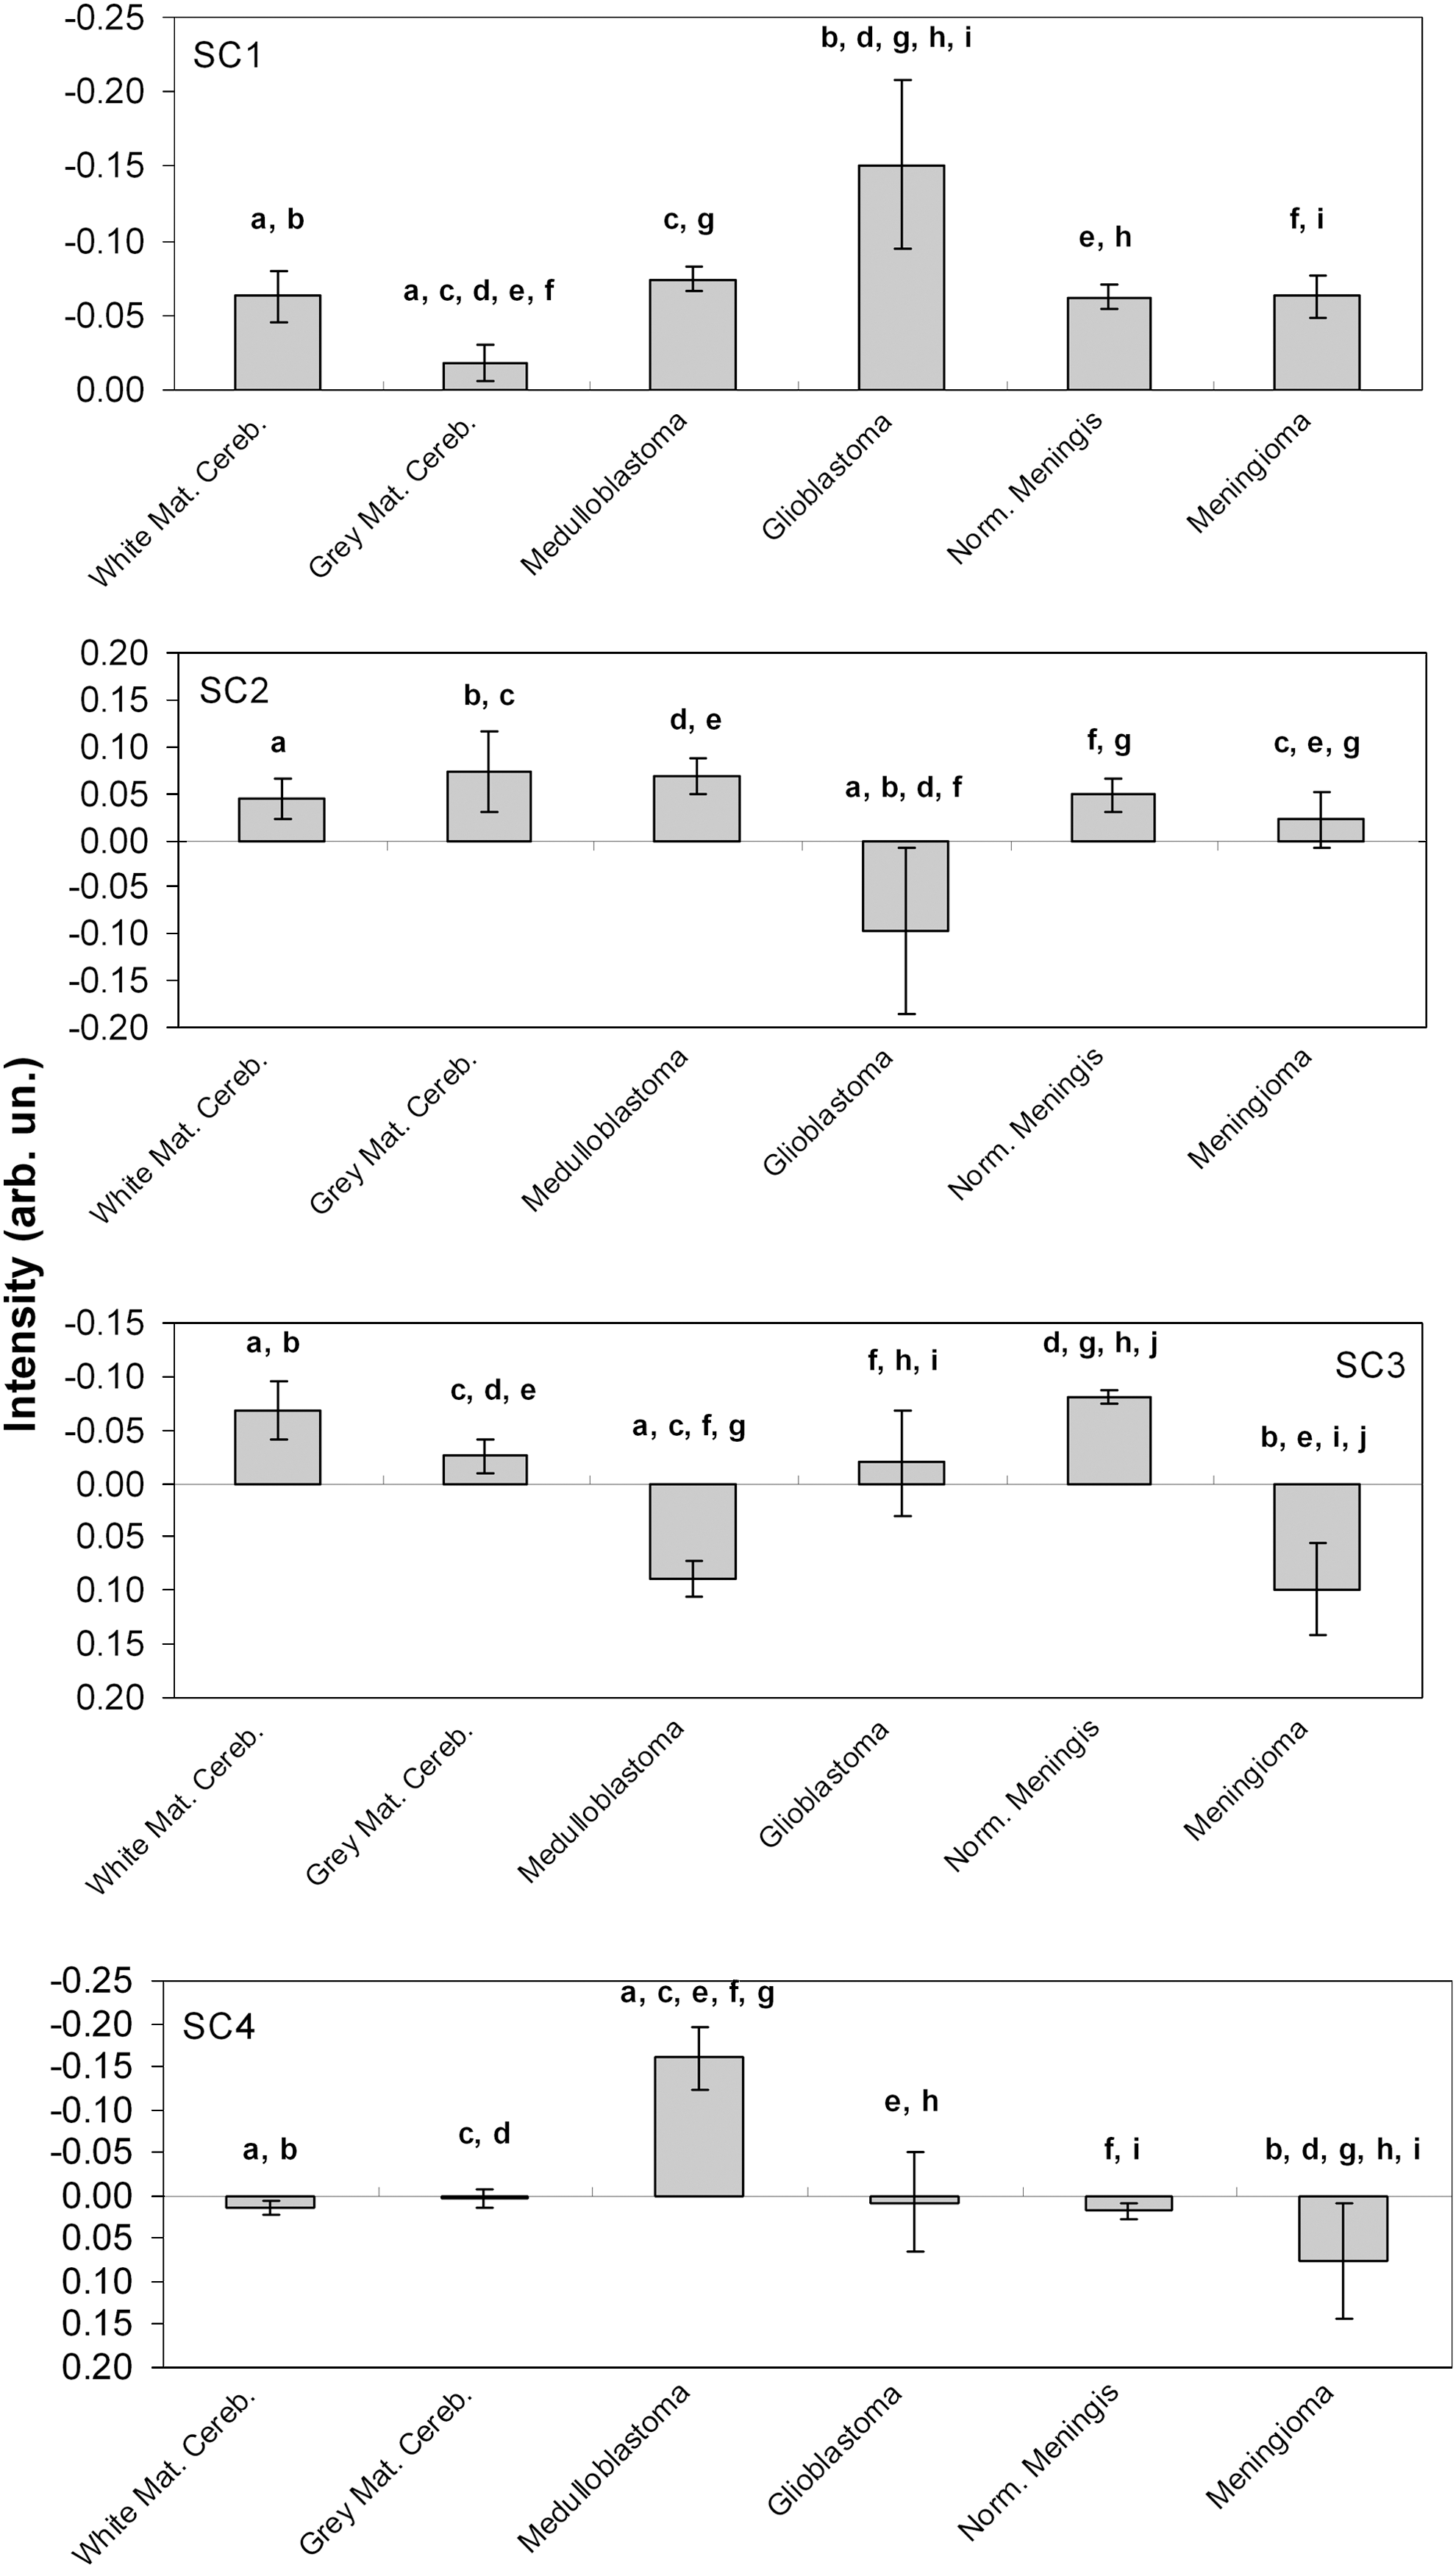
Mean intensity and standard deviation of the first four principal components scores (SCs) for each tissue type. Superscript letters in each principal component (PC) indicate groups with statistically significant differences (p<0.05).
Figure 4 shows the PCs PC2 and PC3. It was pointed out that PC2 was able to discriminate mainly glioblastoma tumors and other normal tissues; PC2 has spectral characteristics of lipids/phospholipids and cholesterol, which are very intense biochemical components in glioblastoma tumors. It was observed that PC3, which discriminates medulloblastoma and meningioma from normal tissues, has positive peaks related to proteins (meningioma and medulobastoma are rich in collagen), whereas the negative peaks are related to lipids/phospholipids and, mainly, cholesterol, which are present in these normal tissues (especially the meninges and white cerebellum).

Principal components spectral vectors PC2 and PC3.
Figure 5 shows the binary plot of the scores SC2 and SC3 for all tissue types and the calculated Euclidean distance for group discrimination. Classification showed that, for normal tissues (independently of being cerebellum or meningis), 94 out of 94 spectra presented correct grouping; for medulloblastoma, 17 out of 19 spectra presented correct grouping; for glioblastoma, 16 of 20 spectra presented correct grouping; for meningioma, 35 of 39 spectra presented correct grouping. These results are summarized in Table 2. The Euclidean distance was adequate for the differentiation of the brain tumors from normal tissues. We tested other discriminating functions presented in Matlab's Statistics toolbox: linear, quadratic, and Mahalanobis. Linear and quadratic functions showed similar overall correct classification as did Euclidean, whereas Mahalanobis showed worse results.

Plot of the intensities of the principal components scores SC2 and SC3 for the brain tissue groups. The diagnostic line based on the Euclidean distance discriminates the normal brain tissue from glioblastoma, medulloblastoma, and meningioma.
Sensitivity and specificity for the diagnosis of each tumor compared with other types of tumor, and normal tissue.
Sensitivity and specificity for the diagnosis of all tumors compared with all normal tissue.
The classification results showed high sensitivity and specificity, 97.4% and 100%, respectively, for the diagnosis of brain tumor compared with normal tissue. With relation to tumor medulloblastoma, meningioma, and glioblastoma, sensitivity varied between 80% and 89.7% and specificity ranging between 97% and 99%.
Discussion
Brain tissue is constituted mainly of lipids and proteins, and>80% is water. 34 Brain lipids consist mainly of three categories: cholesterol, sphingolipids (sphingomyelin, cerebrosides, sulphatides, gangliosides) and glycerophospholipid (phosphatidylcholine, phosphatidylethanolamine, phosphatidylinositol). 35 Raman spectra of normal white and gray cerebellum presented differences between them, demonstrating different biochemical composition. The white part had most of the peaks related to lipids compared with the gray part: peaks assigned to cholesterol, lipids/phospholipids, and proteins, corroborating the recent literature. 29 Raman spectroscopy was able to detect differences in the amounts of these lipids in the white and gray cerebellum.
The distribution of phospholipids in subcellular membranes isolated from human brain depends upon factors such as age, sex, and diet. 36 The concentration of lipids in the white part of the brain in individuals 55 years of age is 64.6% compared with 39.6% of the gray part. 37 The concentration of sphingomyelin in the white part is higher in relation to the gray part (∼63.2% and 25.5%, respectively), and the phosphatidylcholine concentration is ∼45.2% in the white and 31.4% in the gray part of the brain. 38 The normal brain tissue possesses cholesterol concentrations estimated at 27.5% in the white and 22% in the gray part of the cerebellum. 39
With respect to the spectral differences of the medulloblastoma compared with the glioblastoma, the latter showed intense peaks across the spectral range related to lipids/phospholipids (881, 1066, 1132, 1300, and 1442 cm−1) and particularly cholesterol (549, 703, 881, 962, 1132, and 1442 cm−1), whereas medulloblastoma showed higher intensities of the peaks related to protein (1035 cm−1) and phospholipids (788 cm−1). Biochemical composition of medulloblastoma include cholesterol (22%), lipids (2.2%), and phospholipids (2.4%), phosphatidylcholine (55%) and phosphatidylethanolamine (29%) being the most relevant ones, 39 indicating that Raman bands correlated with known tissue biochemistry. The composition of glioblastoma tissues is mainly cholesterol (23%), phospholipids (2.1%), with phosphatidylcholine (44%), phosphatidylethanolamine (29%), and sphingomyelin (20%) being the most important ones. 39
Although the most intense protein bands (1318, 1453, and 1661 cm−1) overlap with the lipids, it is possible to verify higher amount of proteins in glioblastoma and medulloblastoma tumors by analysis of other important peaks. The peak at 1161 cm−1 (collagen) has higher intensity in these tumors compared with in normal tissue (Fig. 1). The band at 1007 cm−1 (phenylalanine ring) shows an intense peak in the tumors relative to normal tissues. Also, the strong band at the 1440–1460 cm−1 region has the shoulder at 1453 cm−1, indicating high protein content. These results demonstrated that the spectral differences in the amount of proteins and lipids/phospholipids in tumors and the normal cerebellum are relevant, and that these tissues could be discriminated using Raman technique.
The Raman spectrum of meningioma showed several bands with higher intensity compared with normal meninges, especially the protein peaks (853, 939, 1007, 1032, 1161, 1179, 1268, and 1318 cm−1), hemoglobin peak (1212 and 1558 cm−1) and lipid/phospholipid peaks (759, 788, and 1268 cm−1). The normal meninges showed the most intense bands related to cholesterol and saturated fatty acids (457, 549, 608, 703, 1066, 1300, and 1442 cm−1). In meningiomas, bands at 939, 1007, and 1161 cm−1, indicated the presence of collagen in higher amounts compared with normal meninges. The presence of collagen is consistent with the literature, as meningiomas originate from the meninges, which contain a significant amount of collagen. 13 Collagen (types I, III, and IV) is the most abundant structure in the extracellular matrix of human meninges. In addition to collagen, meningothelial cells synthesize fibronectin, laminin, and tenascin. 40 Montagnani et al. 41 found that intracranial meninges are rich in collagen type I and IV compared with spinal meninges, which are rich in collagen type III 39 . The expression of different proteins in meningiomas of varying grades was found to be altered, indicating a possible change in their content depending upon tumor grading. 39
Bands assigned to hemoglobin were observed in all neoplastic tissues. It was found that these hemoglobin peaks (1212, 1226, and 1559 cm−1) are more intense in tumors, suggesting greater vascularization, although hemoglobin bands have not been considered relevant for tumor versus normal classification. 13 The presence of water, with a (weak) band in the region of 1632 cm−1, may be considered an important feature for brain tissue differentiation. The normal gray cerebellum is ∼82% water and the white is ∼72% water, whereas glioblastoma and medulloblastoma are ∼87% water. 39 Therefore, water could be an important component in the discrimination of tumor tissue from normal tissue. The band at 1521 cm−1 (carotenoids) was found in all normal and tumor samples, being associated with the lipids in brain tissue. 13
Multivariate techniques such as PCA have been used extensively for identification of spectral differences associated with morphologic changes arising from human diseases, considering that in most cases the changes are subtle and difficult to interpret, and are related to molecular components that are often superimposed. PCA extracts relevant information from the original data, basically the spectral differences between the groups; being able to identify the spectral bands is significant for the diagnosis, as the principal components are related to the biochemical constituents. 8,22,43
The PCA/Euclidean distance was able to discriminate between the spectra of normal and tumor tissue, despite the small number of samples. The ANOVA applied to the scores of PCs showed that SC2 and SC3 were able to successfully discriminate neoplastic lesions from normal tissues (higher lipid content for glioblastoma, higher protein content for medulloblastoma and meningioma). The false-positive diagnosis presented in this study (2 spectra of medulloblastoma, 4 of glioblastoma, and 4 of meningioma in a total of 172 spectra) were small compared with the correct results, which could be attributed to the sampling method used (random cut) and tissue variability. The diagnosis using the PCA/Euclidean distance applied to Raman spectra showed sensitivity, specificity, and accuracy of 97.4%, 100%, and 94.2%, respectively, considering the normal and all neoplastic tissue groups. Studies with Raman and PCA in other tissues in vitro also achieved high sensitivity; for example, the diagnosis of oral carcinoma had 100% sensitivity 40 and discrimination of colon tissue obtained 95% sensitivity. 44
The gold standard technique used for the differentiation of tumors relative to normal tissue in diagnostic procedures during resection surgery, excisional biopsy followed by histopathologic evaluation, requires time, as seriate samples need to be evaluated in order to evaluate the tumor margins, which can bring delay and costs associated with the tumor resection surgery procedure. The search for optical techniques in order to obtain spectral information that could be correlated to the histopathology quickly and cost effectively during surgical procedures is challenging. Among these techniques, Raman spectroscopy could assist the identification of tissue composition, correlating the molecular alterations with pathology in different specialties, 7 –10 allowing diagnosis in vivo in real time. 9 Raman technique may be relevant in determining surgical margins in open skull surgeries, seeing that healthy tissues are not removed in sensitive parts of the human brain, and performing a rapid histopathology after biopsy, reducing the time for diagnosis. A disadvantage is the need for longer exposure time to obtain Raman images of larger areas.
The results obtained in this study showed that Raman spectroscopy can identify changes in the concentration of biochemicals presented in neoplastic and normal tissues and, associated with a discriminant analysis technique such as PCA/Euclidean distance, can become a powerful and reliable tool for a biochemical diagnosis of brain lesions.
Conclusions
This study showed that Raman spectroscopy is an effective technique for detecting biochemical changes in glioblastoma, medulloblastoma and meningioma brain tumors, and comparing them with normal brain tissues from the cerebellum and meninges, indicating different concentrations of lipids/phospholipids, cholesterol, proteins, and hemoglobin in neoplastic tissues of the cerebellum and meninges. The diagnosis using PCA/Euclidean distance, using the spectral differences contained in the principal component scores SC2 and SC3, showed a sensitivity and specificity of 97.4% and 100%, respectively, for discriminating tumors from normal tissues.
Footnotes
Acknowledgment
Dr. thanks FAPESP (São Paulo Research Foundation) for partial financial support (Proc. no. 2009/01788-5).
Author Disclosure Statement
No competing financial interests exist.