
Abstract
Introduction
T
Most traditional photoactivation procedures employ conventional quartz tungsten halogen (QTH) lamps in the light curing unit (LCU). 6 However, much of the energy emitted by these lamps is in the infrared spectrum, and is absorbed by the composite, resulting in increased molecular vibration and heat generation. 7 Light sources using halogen lamps require filters to reduce the transmission of infrared energy to the tooth. 8 The efficiency of these filters varies according to the manufacturer, and energy not absorbed by the filter can produce heat in the tooth. 9 Light-emitting diodes (LEDs) have been used in place of halogen sources to reduce the heat generated during photoactivation. 7 The use of LEDs is increasingly popular among clinicians. 10 LEDs consume little power and do not require filters to produce blue light. 10,11 However, investigators are still studying the technology of LEDs for the photopolymerization of dental composites. 10,12
Photoelastic analysis may be used to analyze contraction stresses generated during dental composite polymerization. 13 The internal stresses of the photoelastic material modify the polarization of transmitted light, producing optical effects that indicate the location and the magnitude of the stresses. The stresses generated in inlays, onlays, crowns, posts, abutments, and implants have previously been analyzed using photoelastic analysis. 13,14 Shrinkage stress development during setting is an important factor that may affect the longevity of resin composite restorations. These materials are bonded to tooth cavity walls, which restrict bulk contraction and transfers setting stresses to the tooth–restoration interface. 15 Polymerization shrinkage is affected by the degree of conversion (DC) (the fraction of C=C bonds converted into C–C bonds). 15 Increased DC leads to greater polymerization strains, 15,16 as more covalent bonds and more highly cross-linked networks are formed. 15 Although DC is an important factor, it does not provide a complete characterization of the network structure, as polymers with similar DC might exhibit different cross-link densities (CLD) because of differences in chain linearity. 17,18 CLD may be indirectly assessed by measuring the softening of polymers during exposure to ethanol. 6,17
The purpose of this study was to compare the contraction stress, DC, and CLD of the silorane-based restorative material, the Venus Diamond nanohybrid composite, and a conventional nanoparticle composite following photopolymerization using QTH or LED LCUs. The hypotheses tested were: (1) the silorane-based and the low-shrinkage nanohybrid composite restorative materials develop lower contraction stress after photopolymerization than does the conventional nanoparticle dimethacrylate-based material, and (2) the silorane-based and the low-shrinkage nanohybrid materials develop DCs and CLDs similar to those of the conventional restorative material.
Materials and Methods
Adhesives and resin composites
The adhesives used in the contraction stress tests were Scotchbond multipurpose adhesive (3M/ESPE, batch #N133527) and Filtek P-90 system adhesive (3M/ESPE, batch #N139734). The restorative materials were all shade A2, and included the conventional nanoparticle-filled composite Filtek Z350 XT (3M/ESPE), the silorane-based Filtek P90 (3M/ESPE), and the low-shrinkage nanohybrid composite Venus Diamond (Heraeus Kulzer). The composite specifications based on manufacturer data are listed in Table 1.
LCUs
The LCUs consisted of a conventional QTH LCU (Vip Junior, Bisco Inc, Schaumburg, IL) and an LED LCU (Radii Cal, SDI, Bayswater, Victoria, Australia).
The output power (mW) of the LCUs was measured using a power meter (Ophir Optronics Inc, Danvers, MA). The diameter of the tips was measured using a digital caliper (Mitutoyo, Kanagawa, Japan) in order to calculate the total irradiance (QTH: 700 mW/cm2 for 40 sec exposure; LED: 1400 mW/cm2 for 20 sec exposure). The energy density was calculated based on the total irradiance and exposure time and standardized at 28 J/cm2. The output spectra of the LCUs (Fig. 1) were obtained using a spectrometer (USB 2000, Ocean Optics, Dunedin, FL). The total irradiance of each LCU was also obtained through numerical integration of the output spectrum using the Origin 6.1 software (OriginLab Corp, Northampton, MA).
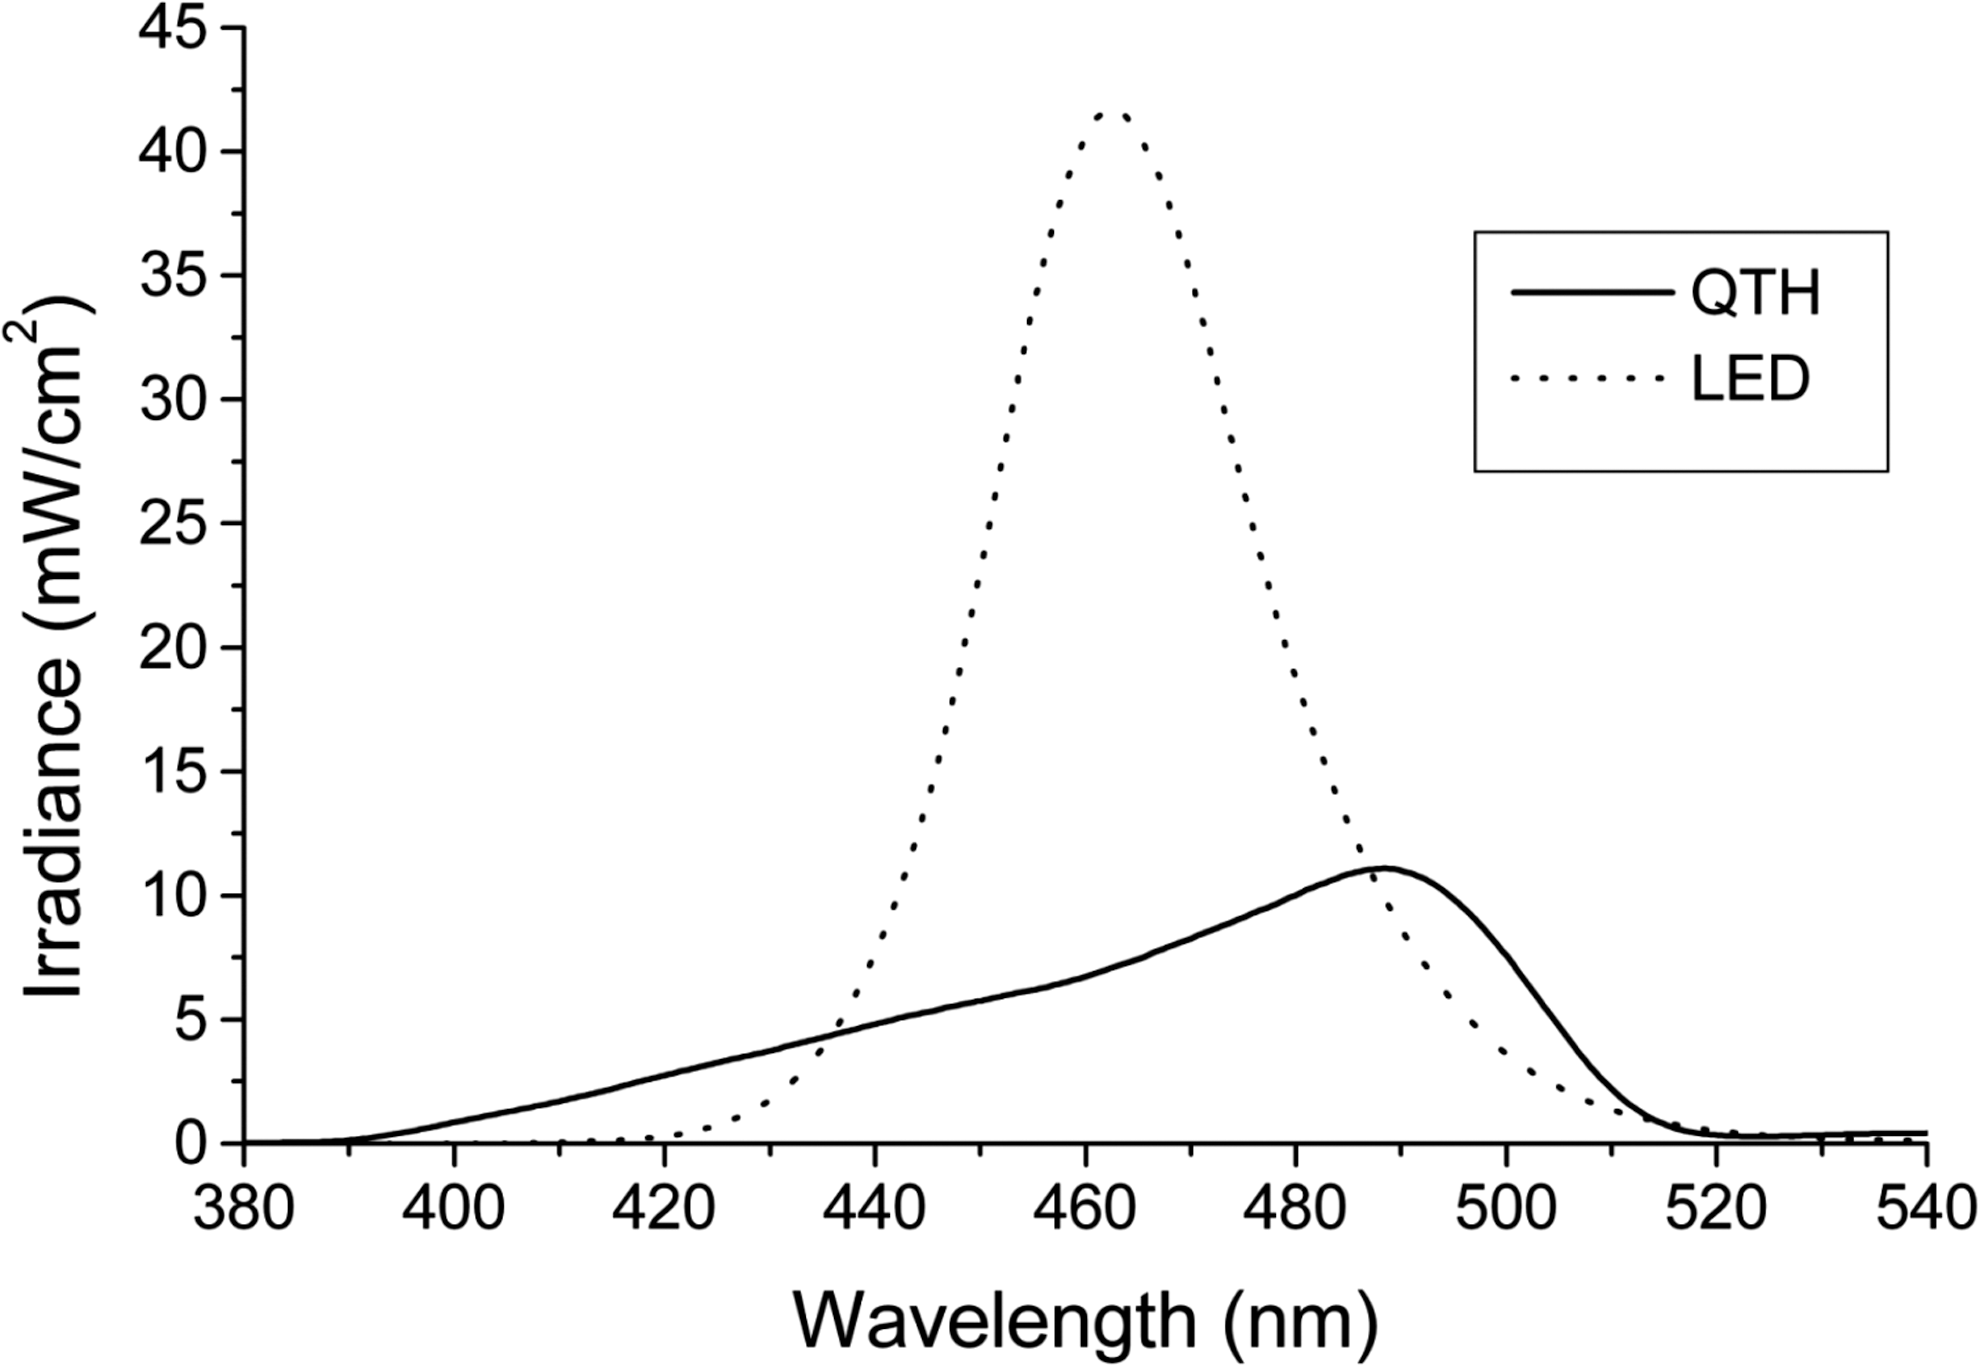
Wavelength distributions of light curing units.
Contraction stress test
A series of 60 rings (5 mm diameter×2 mm high) were fabricated from photoelastic resin (GIII flexible, Polipox, Sao Paulo, Brazil). Following polymerization, the interior surfaces were abrasive blasted using 50 μm alumina particles in order to obtain higher micromechanical retention. 13 The rings were divided into six groups (n=10) according to material and LCU: Group 1, Filtek Z350 XT+QTH; Group 2, Filtek P90+QTH; Group 3, Venus Diamond+QTH; Group 4, Filtek Z350 XT+LED; Group 5, Filtek P90+LED; and Group 6, Venus Diamond+LED.
For both samples of the Filtek Z350 XT and Venus Diamond composites, Scotchbond multipurpose adhesive was applied and photoactivated, followed by insertion and photoactivation of the restorative materials. For the Filtek P90 samples, the Filtek P-90 system adhesive was used in place of Scotchbond adhesive.
The specimens were analyzed and the contraction stress (MPa) was measured using a polariscope (Photostress LF/Z-2, Raleigh, NC).
DC test
Brass rings 8.0 mm in internal diameter, 12.27 mm in external diameter, and 2.0 mm high were filled with a single layer of the composites. A transparent polyester strip was placed on the tops and bottoms of the samples to obtain a flat surface. The photoactivation procedure was performed according to the type of LCU and composite. For each group, 10 specimens were prepared. Following photoactivation, the specimens were stored dry at 37°C for 24 h. The top and bottom surfaces were manually flattened using 200, 400, and 600 grit SiC abrasive (Carborundum; Saint-Gobain Abrasives, Recife, PE, Brazil) while cooling with distilled water. After sanding, the sample and matrix were washed with distilled water, dried, and stored in closed lightproof containers at 37°C for 24 h. Thus, the samples were divided into 12 groups (n=10) according to LCU, composite, and surface: Group 1, QTH+Filtek Z350 XT+Top; Group 2, QTH+Filtek Z350 XT+Bottom; Group 3, QTH+Filtek P90+Top; Group 4, QTH+Filtek P90+Bottom; Group 5, QTH+Venus Diamond+Top; Group 6, QTH+Venus Diamond+Bottom; Group 7, LED+Filtek Z350 XT+Top; Group 8, LED+Filtek Z350 XT+Bottom; Group 9, LED+Filtek P90+Top; Group 10, LED+Filtek P90+Bottom; Group 11, LED+Venus Diamond+Top; Group 12, LED+Venus Diamond+Bottom.
Fourier transform infrared (FTIR) (Spectrum 100 Optical; Perkin Elmer Analytical Sciences, MA) spectra were obtained of the top and bottom sample surfaces in order to determine the DC. The spectra were obtained using an attenuated total reflectance (ATR) attachment containing a zinc selenide horizontal crystal (Pike Technologies, Madison, WI). The Spectrum v6.3.1 software package (Perkin Elmer Analytical Sciences) was used for spectral visualization and plotting. The spectra were the averages of 16 scans between 300 and 4000 cm−1 at a resolution of 4 cm−1. The DC in the cured materials was determined using the three frequency technique. For Filtek P90 containing silorane monomers, the C-O-C stretching vibrations of the epoxy rings (884 cm−1) were chosen as the analytical absorption band and the Si–CH3 stretching vibrations (695 cm−1) were used as the reference absorption band. In this case, the fraction of remaining epoxy rings was calculated from the normalized peak height ratios of the cured versus the uncured material.
15
For Filtek Z350 XT and Venus Diamond, the C=C stretching vibrations (1638 cm−1) were used as the analytical absorption band and the aromatic C-C stretching vibrations (1608 cm−1 for Filtek Z350 XT and 1716 cm−1 for Venus Diamond) were selected as the reference absorption band. The DC was calculated from the peak height ratio of the analytical and the reference absorption bands normalized to the corresponding ratio in the uncured material by the following equation:
where R=peak described previously.
Knoop hardness and CLD test
Standardized cylindrical specimens were prepared by placing the composites in a circular elastomeric mold (2 mm thick×4 mm diameter). The bottom and top surfaces were covered with a transparent polyester strip, and photoactivated using an LCU. The curing tip was positioned close to the mold/composite assembly. The photoactivation procedures were selected based on the LCU and composite type. A total of 10 specimens of each group were prepared. Thus, the samples were divided into 12 groups (n=10) according to LCU, composite, and surface as mentioned for the DC test.
Following photoactivation, the specimens were stored dry at 37°C for 24 h. The top and bottom surfaces were flattened using 200, 400, and 600 grit SiC abrasive paper. Indentations for Knoop hardness (KHN1) measurements were performed sequentially in a hardness testing machine (HMV 2; Shimadzu, Tokyo, Japan). Five readings were obtained on the top and bottom surfaces under a load of 50 gf for 15 sec. KHN1 for each surface was recorded as the mean of the five indentations.
The specimens were soaked in absolute ethanol for 24 h at room temperature to soften the material, 18 and the hardness was again determined (KHN2). The CLD was estimated from the degree of softening caused by ethanol immersion. The decrease in hardness was calculated for both surfaces of each specimen. 6 The data were subjected to the Kolmogorov–Smirnov test for normality, two way analysis of variance (ANOVA) (composite vs. LCU), and Tukey's test at 5% significance levels.
Statistical analysis
Statistical analysis was performed with the SAS System for Windows 9.0 (SAS Institute Inc., Cary, NC).
The contraction stress measurements were subjected to the Kolmogorov–Smirnov test for normality, followed by two way ANOVA (composite vs. LCU) and Tukey's test at 5% significance levels.
In order to compare the degree of monomer conversion between the top and bottom surfaces, the data were subjected to the Kolmogorov–Smirnov test for normality and Student's t test at 5% significance with respect to the type of LCU used.
Statistical analysis was performed by Kolmogorov–Smirnov test, which revealed a non-normal distribution for the DC data of composite/LCU interactions. Thus, the DC data of composite/LCU interactions were investigated by subjecting them to the Kruskal–Wallis one way ANOVA on ranks followed by pairwise multiple comparisons using Tukey's test at a 5% significance level.
When comparing the top and bottom surfaces KHN, the data were subjected to the Kolmogorov–Smirnov test for normality and Student's t test at a 5% significance level with respect to the type of LCU used.
The data of percentage decrease in hardness (PD) were subjected to the Kolmogorov–Smirnov test for normality, two way ANOVA (composite vs. LCU), and Tukey's test at 5% significance levels.
Results
There was no statistically significant difference for the factor LCU and composite/LCU interaction (p>0.05). However, for the factor composite (Table 2, p<0.05), the composite Venus Diamond showed lower contraction stress values than the Filtek Z350 XT and Filtek P90 composites, and the Filtek Z350 XT and Filtek P90 composites did not differ statistically.
Mean values followed by different lowercase letters in the column differed statistically by Tukey's test at 5% level for different light curing units. Standard deviations are given in parentheses.
The results in Table 3 (p<0.05) demonstrate a higher DC at the top surface independent of curing unit or composite type.
Mean values followed by different uppercase letters in rows differed statistically by Student's t test at 5% level for different light curing units. Standard deviations are given in parentheses.
QTH, quartz tungsten halogen; LED, light-emitting diode.
The conversion in Venus Diamond was lower than in Filtek P90 at both surfaces using either LCU. Filtek Z350 XT composite did not differ significantly from the other composites at either surface using either curing unit (Table 4, p<0.05).
Median values followed by different uppercase letters in rows and lowercase letters in columns differed statistically by Tukey's test at 5% level of significance.
QTH, quartz tungsten halogen; LED, light-emitting diode.
For each composite and LCU, the KHN of the top surface was higher than that of the bottom surface (Table 5, p<0.05).
Mean values followed by different uppercase letters in rows differed statistically by Student's t test at 5% level for different light curing units. Standard deviations are given in parentheses.
QTH, quartz tungsten halogen; LED, light-emitting diode.
There were no significant differences in the LCU factor and composite/LCU interaction (p>0.05). However, for the composite factor independent of the LCU, the PD of Venus Diamond was lower than that of Filtek Z350 XT or Filtek P90 at both surfaces (Table 6, p<0.05). The PD of Filtek Z350 XT and Filtek P90 did not differ significantly at either surface.
Mean values followed by different lowercase letters in columns differed statistically by Tukey's test at 5% level for different surfaces. Standard deviations are given in parentheses.
KHN, Knoop hardness number.
The emission spectra of the LCUs are depicted in Figure 1. The QTH emission was concentrated in the 390–520 nm range, with an emission peak at 490 nm. The LED unit exhibited a narrower curve concentrated in the 420–520 nm range with a peak at 462 nm.
Discussion
Resin composites exhibit viscoelastic behavior and are transformed during polymerization from a viscous plastic to a rigid elastic structure. 15,19 Adhesive bonding of composites to teeth results in contraction stresses, the magnitude of which is dependent upon several factors. The contraction stresses in polymeric materials used in dentistry are typically measured using a tensiometer. 13 These measurements may be used to determine the maximum stress on the specimen under specific conditions, but the stress near the external margins of the cavity will be different from the stress near the pulpal wall. 13 Contraction stress may also be modeled using finite element analysis and elasticity theory. 20 However, analysis of the stresses generated in complex restoration configurations is difficult. 13 The round, uniform nature of the specimens in this study resulted in a regular stress distribution and permitted the use of photoelastic stress analysis.
In contrast to free radical polymerization of methacrylates, the ring-opening polymerization of silorane-based composite resin occurs via cleavage and opening of ring structures, counteracting the inevitable loss of volume caused by bond formation. 5 Previous reports have described lower shrinkage, 4,15 lower contraction stress, 4 and reduced cuspal deflection 5,21 when using silorane-based materials. In the present study, the contraction stress in the Filtek P90 system was similar to that in the nanoparticle-filled Filtek Z350 XT system, and the low-shrinkage nanohybrid Venus Diamond system exhibited lower contraction than the other two systems (Table 1). The development of contraction stress in dental composites depends upon material composition, including the type of monomer, the type and amount of filler, filler/matrix interactions, polymerization parameters such as the degree and rate of polymerization, placement, and curing technique. 5,22 According to Hooke's law, the stress should be determined by the product of the volumetric shrinkage and the elastic modulus of the material (in a totally elastic situation). However, the setting of dental composites is not purely elastic, and increased elastic modulus has been related to higher stress. 5,22 Previous studies 4,5 have reported that although the elastic modulus of silorane-based composite resins is higher than that of methacrylate-based resins, they generate similar contraction stresses. Venus Diamond is characterized by the presence of a novel monomer (TCD-DI-HEA) (Bis-[acryloyloxymethyl]tricyclo[5.2.1.02,6]decane) that according to the manufacturer combines low shrinkage with low viscosity and may account for the lower stress values recorded with this material. 5 This assertion is in agreement with the results of this present study, in which Venus Diamond had the lowest contraction stress.
Adequate polymerization is a crucial factor in obtaining optimal physical and mechanical performance from dental resin composites. 23 The appearance of the composite is influenced by factors such as filler and polymeric matrix refractive index, monomer type, and filler type and content. 24 During the photoactivation process, light passing through the resin composite is absorbed by the resin and scattered by the filler material. 6.25 The light intensity is attenuated and the curing effectiveness is reduced as the depth increases. 26 The polymerization depth depends upon the light irradiance and exposure time as well as factors such as material composition, 27 resin composite shade, 28 and translucency. 29 An advantage of testing composites using the Knoop hardness test is the correlation between the KHN and the DC. 30 In the present study, the top surface of the three composites displayed greater conversion and KHN with either LCU (Tables 3 and 5).
The polymerization of siloranes occurs via a cationic ring opening reaction, whereas methacrylate-based composite resins polymerize via a radical addition reaction to their double bonds. 4 During photopolymerization of dimethacrylate resins, the rapid development of a highly cross-linked network drastically restricts the mobility of reacting species, resulting in phenomena such as auto-acceleration, reaction-diffusion-controlled termination, and incomplete conversion. 31,32 The DC of methacrylate-based composite resins is determined from the conversion of aliphatic C=C double bonds. However, silorane-based monomers do not contain C-C double bonds, and the degree of polymerization is calculated based on the conversion of epoxides to C-O-C- chain units. 33,34 In the present study, the DC of the Filtek P90 system was the same as the DC of the nanoparticle-filled Filtek Z350 XT (Table 4) for both surfaces and LCUs, in contrast to a previous study. 34 However, that study performed FTIR analysis using the region between 730 and 950 cm−1 with oxirane ring peaks at 882 cm−1, whereas the present study used the region described by Papadogiannis et al. 15 with two peaks (884 cm−1 for epoxy stretching vibrations and 695 cm−1 for Si–CH3 vibrations). The DC of the Venus Diamond composite was lower than that of the Filtek P90 composite, but was not significantly different from that of the Filtek Z350 XT. This finding is clinically relevant, because DC is related to contraction stress. In this case, the Venus Diamond composite exhibited similar DC with less tension caused by contraction.
Cross-linked dimethacrylate networks swell when exposed to solvents. This occurs because the attractive forces between the solvent molecules and the chain are greater than the forces between the polymer chains. 35 Therefore, the solvent penetrates into the resin matrix and expands the openings among chains. 18 Solvent penetration ability is related to the solubility parameter, which describes the ability of a molecule to penetrate and dissolve another substance. 18,35 The differences in the solubility parameter between the polymer and the solvent will determine the extent of solvent uptake, 30 with smaller differences in the solubility parameters of the solvent and the polymer resulting in greater solvent uptake. 18,35 The CLD exerts a major effect on the polymer properties, as highly cross-linked materials generally possess increased fracture strength and wear resistance. 35 Polymers with a high CLD may be advantageous not only because of their enhanced mechanical properties, but also by being less susceptible to softening by food substances and to enzymatic attack. 17 In the current study, the PD of Venus Diamond composite was lower than the other composites (Table 6). As solvent uptake and swelling are directly related to CLD, a polymer with fewer cross-links is more sensitive to the plasticizing action of solvents. 35 However, a cross-linking agent may be incorporated into the formulation of this composite to minimize this drawback, and addition of this agent did not affect desirable properties such as low contraction stress and high DC.
In this study, the curing performance of the introduced LED LCU was similar 36 to or better 37 than that of the QTH LCU. In contrast, others have reported better performance from QTH LCUs. 38,39 The conventional QTH LCU (Vip Junior, Bisco Inc.) used in this study emitted an energy density of 28 J/cm2, yielding an irradiance of 700 mW/cm2 during a 40 sec exposure (energy density (J/cm2)=irradiance−mW/cm2×exposure time−sec/ 1000). Under similar conditions, the LED LCU (Radii Cal, SDI) emitted an energy density of 28 J/cm2 (1400 mW/cm2 over 20 sec). Figure 1 contains plots of the LCU wavelength distributions. The reduced curing time using the LED unit is clinically relevant in terms of the reduced time required to prepare restorations, which is beneficial for both the patient and the practitioner.
Based on the results of this study, hypothesis 1 must be rejected, as the Filtek P90 system resulted in contraction stresses similar to those of Filtek Z350 XT. Hypothesis 2 must also be rejected, as Venus Diamond experienced smaller decreases in hardness (and therefore in cross-link density) than Filtek Z350 XT or Filtek P90.
Conclusions
Based on the results analyzed and discussed, two things may be concluded. The low-shrinkage Venus Diamond composite was shown be an option to reduce stress at the restoration/tooth interface when compared with Filtek Z350 XT and Filtek P90 composites, and there was no difference in DC between Venus Diamond and Filtek Z350 XT composite, but Venus Diamond resulted in lower contraction stress, resulting in lower stress at the substrate interface. However, no benefit was obtained from the contraction stress reduction if the cross-link density was also decreased.
Footnotes
Author Disclosure Statement
No competing financial interests exist.