
Abstract
Introduction
E
The flash electroretinogram (ERG) is an objective method to evaluate the cellular function of retina in vivo. The photopic negative response (PhNR), which is believed to mainly represent the function of RGCs, was greatly reduced in the monkey glaucoma model. 9,10 As for the function of outer retina distal to the RGCs, some studies reported that the major components (a-wave, b-wave) of photopic ERG were not affected. 10,11 These ERGs were recorded by DTL electrode from high IOP monkeys at ∼2 years post laser treatment. However, dysfunction of the a-wave and b-wave in scotopic ERG has been found in advanced glaucoma patients. 12 –15 In the present study, we investigated full-field cone ERG responses and the retinal thickness in monkeys with long-term ocular hypertension induced by laser, in order to test the hypothesis that long-term high IOP caused dysfunction of cone responses.
Materials and Methods
Animals
Subjects were five male cynomolgus monkeys (Macaca fasicularis), 13 years of age, body weight 5.7–7.5 kg. All five monkeys were first moved to the monkey room in The Capital Medical University (CMU) at 4 years of age and maintained in a 12 h dark and 12 h light (100 lux) environment. Six years prior to this study, high IOP was induced in the right eye (OD) of each monkey by laser. To achieve a sustained elevated IOP, additional laser coagulation was applied occasionally if IOP was <30 mm Hg during this period. We were unable to obtain cynomolgus monkeys the same age and species to serve as normal controls. Therefore, eight normal rhesus monkeys, 4–6 years of age, body weight 6.3–7.2 kg, were also tested. All eight monkeys were maintained in the same animal room in CMU. Four monkeys were tested under the same OCT protocols, and four monkeys were examined under the same ERG protocols. All procedures in this study were approved by the Animal Care and Use Committee at CMU and were performed in accordance with the Association for Research in Vision and Ophthalmology (ARVO) Statement for the Use of Animals in Ophthalmic and Vision Research.
Primate glaucomatous model
High IOP was induced in the right eye by argon laser, using procedures that have been reported previously. 16 –21 In brief, the monkey was anesthetized and restrained in a customized chair. A Novus Spectra (Lumenis, Inc., USA) laser was used. Sixty to 150 burns were applied to the mid-portion of the trabecular meshwork at 270° at the initial coagulation, with spot size of 50 μm, power of 1–1.5 W, and exposure time of 0.5 sec. Two weeks after the first coagulation, laser coagulation was reapplied to the remaining 90° trabecular meshwork if IOP was <30 mm Hg. According to previous reports, 16 –18, 22 , high IOP in the lasered eye can be maintained for many years after repeated administration of laser coagulation. Therefore, we designated the lasered right eye as the glaucomatous eye and the untreated left eye (OS) as the fellow eye.
IOP measurement
Before ERG examination, monkeys were anesthetized with intramuscular injection of 10% ketamine (4 mL/kg) and SUMIANXIN-II (0.1 ml/kg) whose main ingredients include xylazine, haloperidol, and dihydroetorphine hydrochloride. IOP was measured using a Tonovet tonometer (Icare Finland Oy, Espoo, Finland). Three measured values were averaged.
Fundus photographs and OCT
Ocular fundus images (Fig. 1a and b) were obtained using a nonmydriatic retinal camera (Canon CR-DGi, Tokyo Japan). To obtain a clear image, a plano-power contact lens was placed on the cornea. The OCT images were obtained using Heidelberg Spectralis HRA-OCT (Heidelberg Engineering, Inc., Heidelberg, Germany). The scan rate was 40,000 A-scans per second with an axial resolution of 7 μm. The Heidelberg Eye Explorer software (Version 1.6.4.0) was used to calculate the cup-to-disc (C/D) ratio from the infrared fundus images. As high intensity light would affect the ERG, ocular photography and OCT images were performed on a different day than that on which the ERG was recorded.
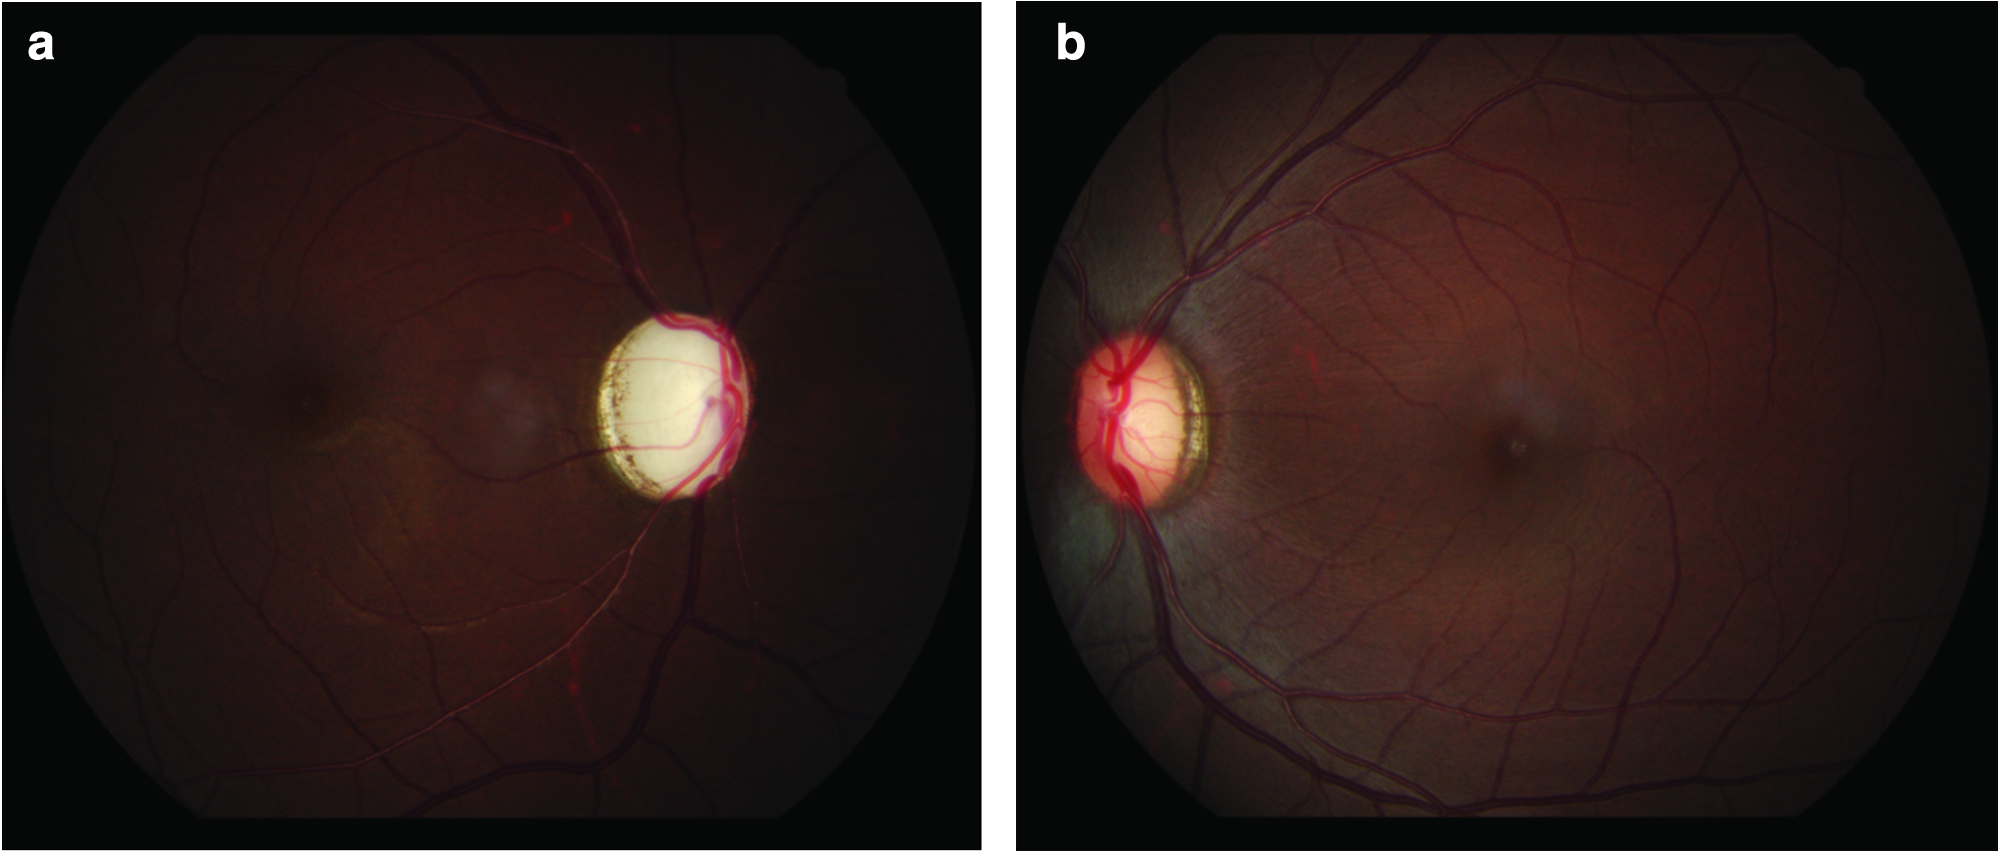
Representative fundus photos and retinal nerve fiber layer (RNFL) images taken from a glaucomatous monkey.
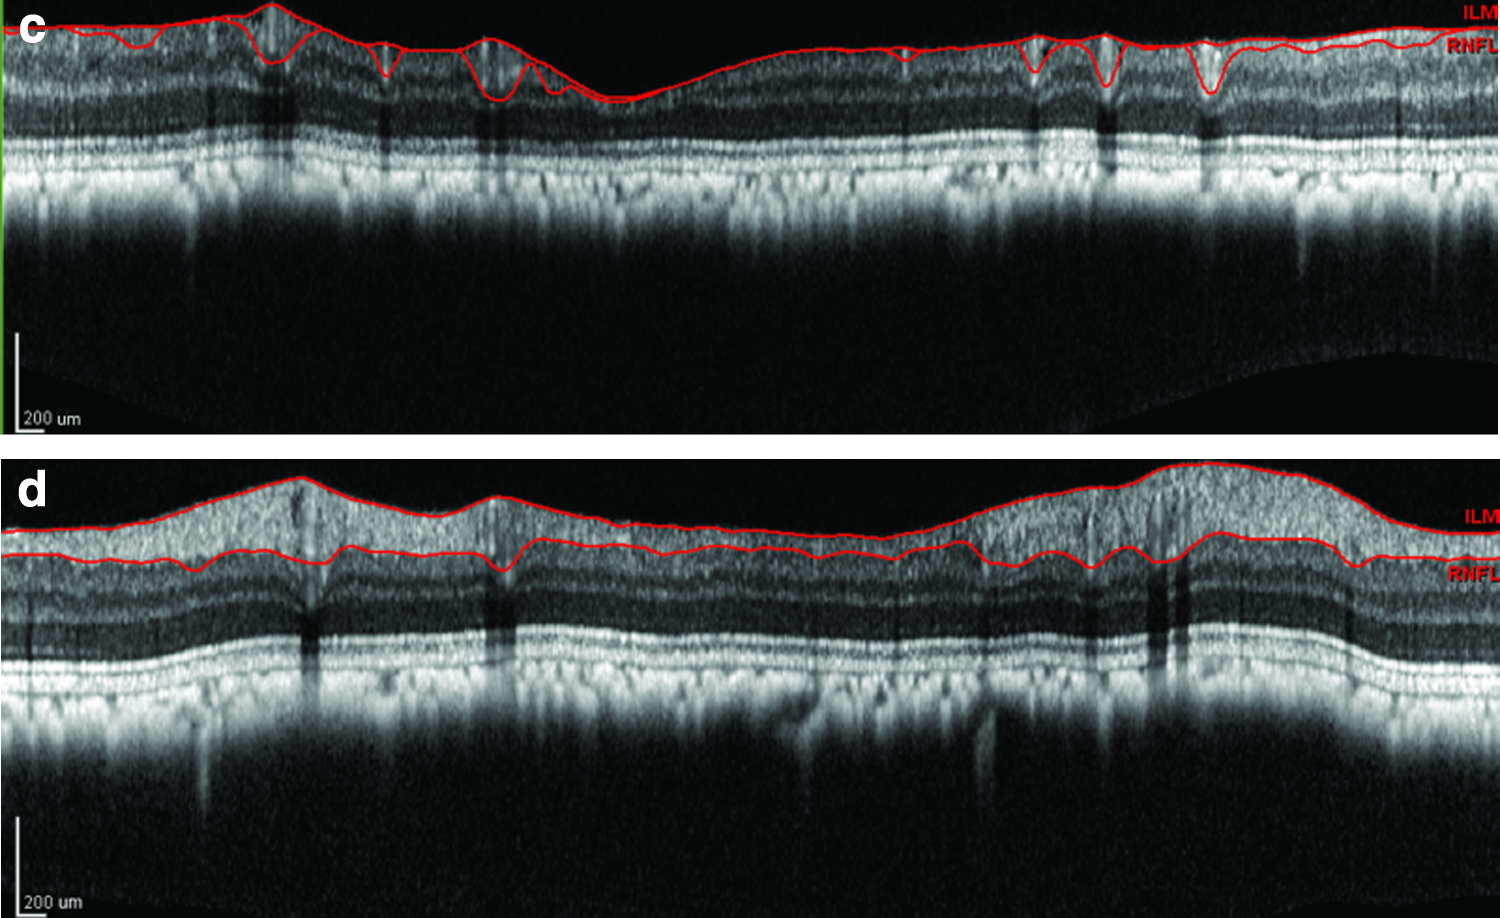
For the measurement of peripapillary RNFL, glaucoma protocol of an RNFL scan was performed by circular scans with a scanning angle of 12 degrees (Fig. 1c and d). Each circle consisted of 512 A-scans along a 3.4 mm diameter circular ring around the optic disk. The Heidelberg Eye Explorer software automatically calculates the average RNFL thickness of the 360 degrees global (G).
For the measurement of retinal thickness, a volumetric scan of the retina protocol was used. The rectangle area in Fig. 2a consists of 97 horizontal B-scan images. The middle image is centered on the fovea to set the section images through the fovea (Fig. 2b). The Bruch's membrane (BM) line was manually adjusted by changing the line position to the appropriate location. Segment of the OCT image was manually used according to articles by others. 23 –26 Central macular thickness (CMT) was the vertical distance from the fovea centralis to the BM. The whole thickness of the retina at 0.5, 1, and 1.5 mm from the fovea in the temporal and nasal retina was measured respectively when the vertical marker line was placed at 0.5, 1, and 1.5 mm from the fovea of the temporal or nasal retina (Fig. 2c). The ganglion cell complex (GCC) was measured from the internal limiting membrane (ILM) to the border of inner plexiform layer (IPL) including the RNFL, ganglion cell layer, and IPL. The outer retinal layer (ORL) was measured from the border of the outer plexiform layer (OPL) to the BM. The thickness of the inner nuclear layer and the OPL (INL+OPL) is the difference of the thickness of the whole retina minus the thickness of the GCC and ORL (Fig. 3).
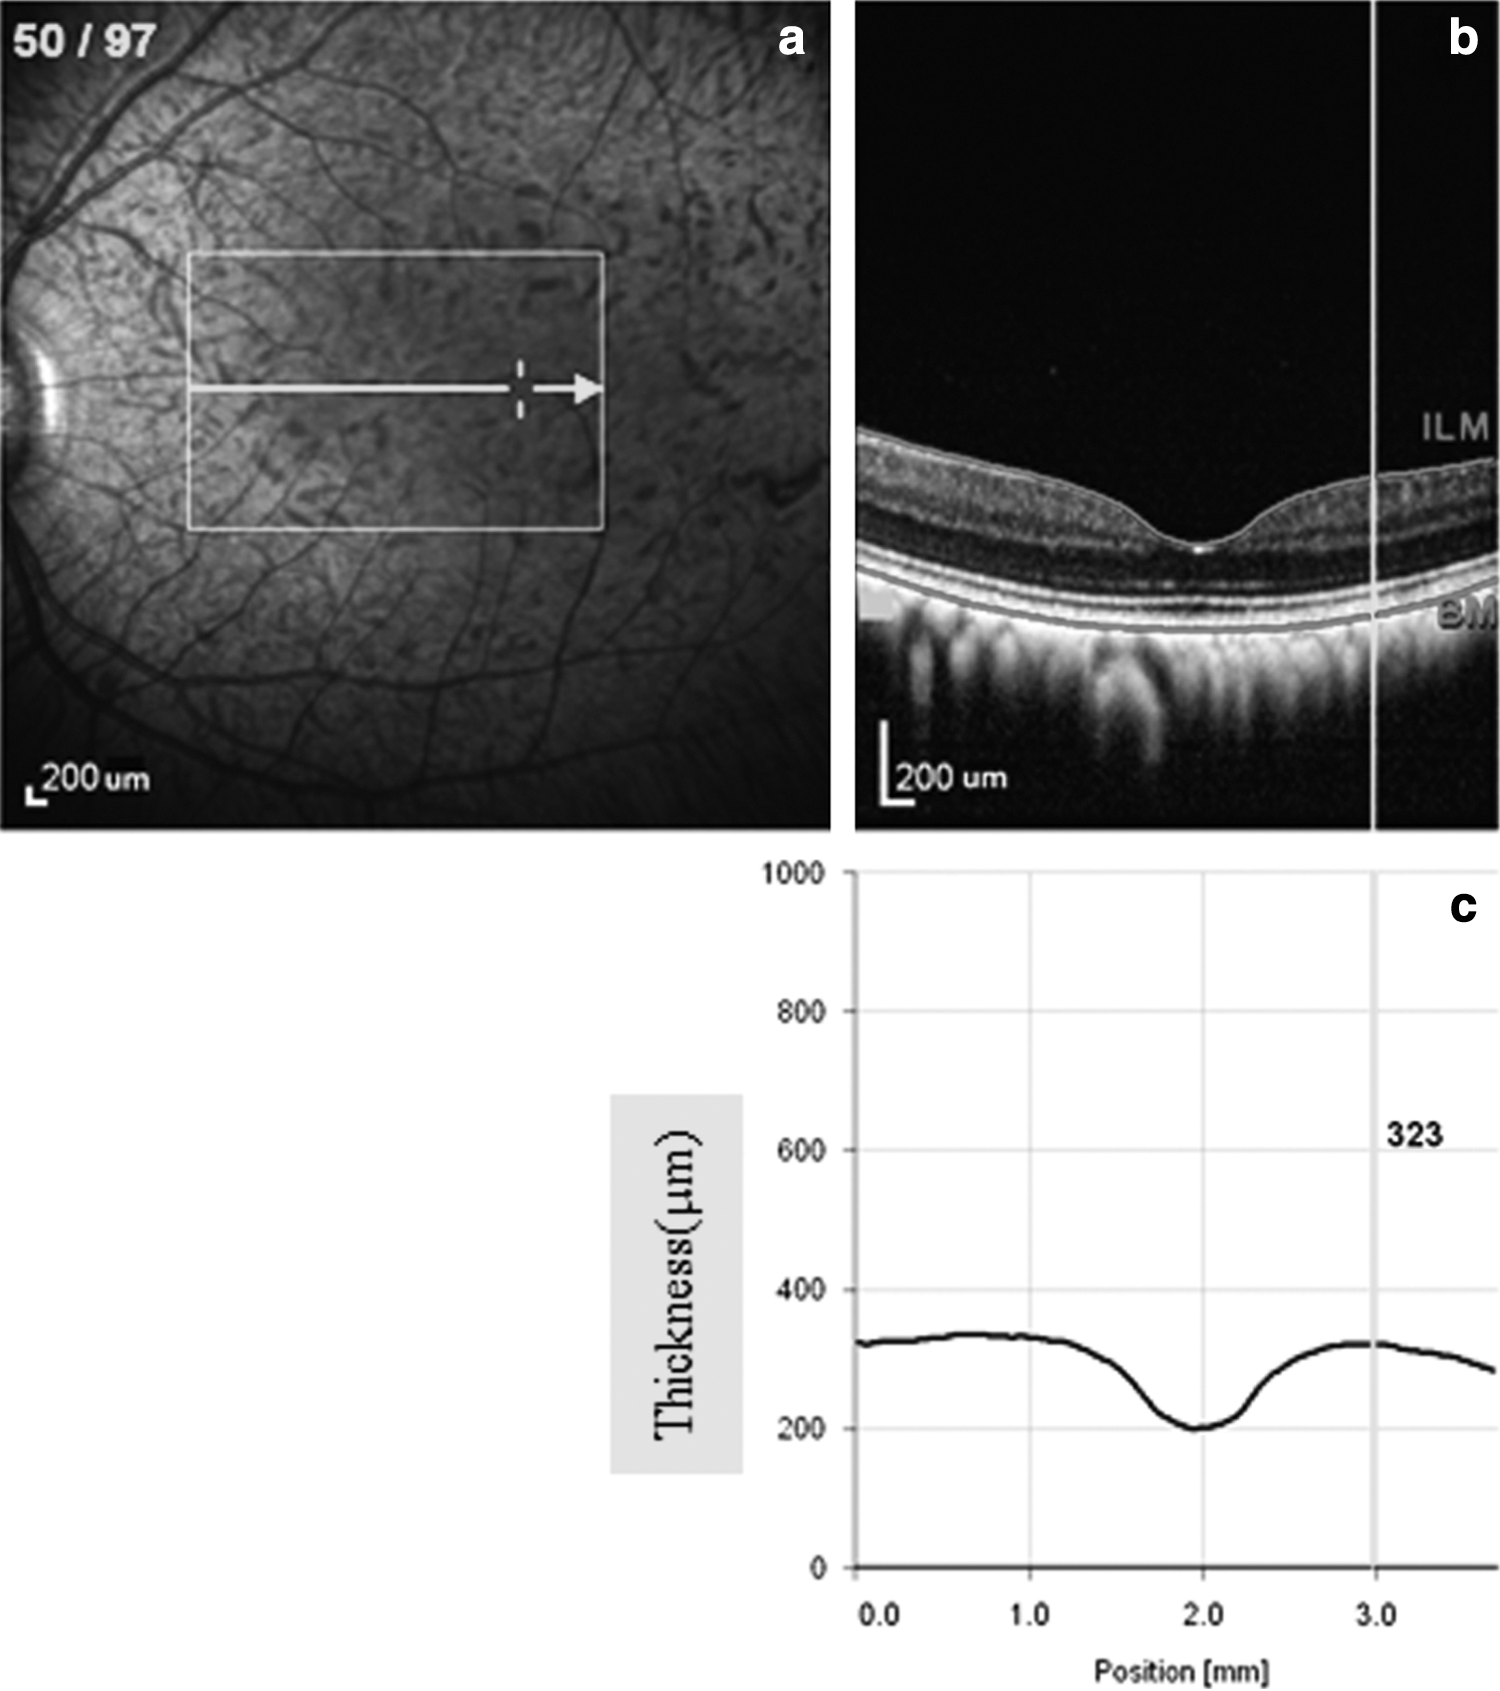
Sample measurement strategy for the whole thickness of the retina.
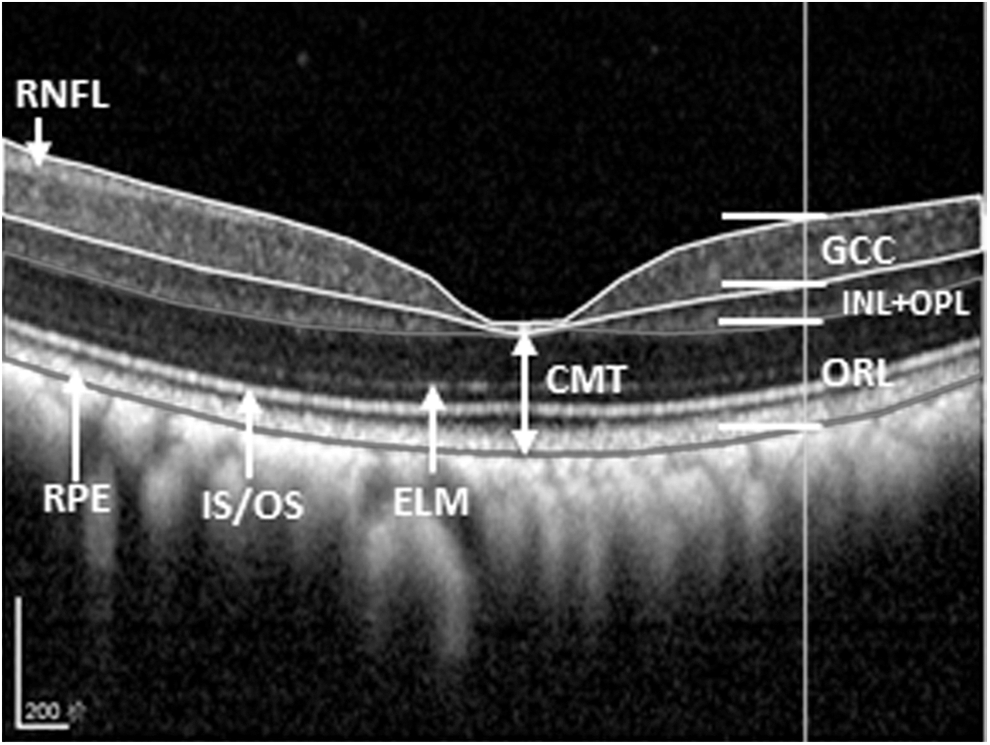
Sample measurement strategy for segment of retinal thickness. Double arrow indicates the central macular thickness (CMT). RPE, retinal pigment epithelium; IS/OS, inner segment/outer segment (of photoreceptor); ELM, external limiting membrane, RNFL, retinal nerve fiber layer; GCC, ganglion cell complex; INL/OPL, inner nuclear layer/outer plexiform layer, ORL, outer retinal layer.
Electroretinography
After administration of anesthesia, the corneas of both eyes were anesthetized with a drop of 0.5% proparacaine hydrochloride. The pupils of both eyes were dilated with a combination of 2.5% phenylephrine hydrochloride and 1% cyclopentolate hydrochloride. A Burian-Allen bipolar electrode (Hansen Laboratories, Coralville, IA) was placed on the cornea of each eye. A needle ground electrode was placed in the left forearm. ERG responses were recorded and analyzed using the Espion Visual Electrophysiology System from Diagnosis, LLC (Littleton, MA). The ERG protocol was based on the standards recommended by International Society for Clinical Electrophysiology of Vision. 27
Full-field stimulation was produced with a Ganzfeld stimulator centered above the two eyes, and ERG signals from both eyes were recorded simultaneously. According to the protocols that have been reported previously, 10,28 –30 , the stimulus conditions of red on blue background were programmed and automatically run as follows. The stimuli of steps 1, 2, and 3 were red flashes of short duration (4 ms) with stimulus intensities of 1, 5, and 7 cd·s·m2, respectively. All flashes were superimposed on a blue background with luminance of 30 cd·m2 which was adequate to suppress rod responses. Twenty sweeps with an inter-sweep delay of 20 sec were averaged. Sweep time was 250 ms. Sample frequency was 1000 Hz. The low- and high-frequency cutoffs used for ERG recordings were set at 0.15 and 1000 Hz, respectively. Baseline removal and auto-zeroing were automatically performed with software provided by the Espion manufacturer.
For the measurement of PhNR, the implicit time (IT) of the PhNR was measured from the start of stimulation to the trough of the PhNR. However, it may be difficult to determine the IT because the trough is relatively broad, especially in eyes with disease. The simplest and least biased method for measuring PhNR is to choose a fixed IT based on one's own data. 31 –34 . Therefore, we used a fixed IT (65 ms) to measure the PhNR amplitude as reported previously in humans, 29 and in monkeys, 9 by others. The fixed IT (65 ms) was determined based on our recording results from the normal rhesus monkeys.
We used the method reported in our previous study
35,36
and in other studies,
37
–39
to measure ERGs. For each ERG, the a-wave amplitude was measured from baseline to the a-wave trough; the b-wave amplitude was measured from the a-wave trough to the b-wave peak. The a-wave and b-wave IT were measured from the onset of the flash to the peak of the respective wave. In order to isolate the pure cone response, cone photoresponse parameters were derived from the leading edges of a-waves obtained from the flashes by 1 and 7 cd·s·m2. The cone photoresponse parameters (Scone and Rcone) were calculated by fit of the Cideciyan and Jacobson model to the a-waves using least-squares minimization.
40,41
The equation is
where i is the flash intensity; Rcone, the maximum response amplitude; Scone, the sensitivity; and t, the time after stimulus onset. τ is the time constant, ɛ=t-δ; the time in seconds delayed by an incremental amount, δ, because of finite flash duration and system-specific time delays; and τcm, the capacitive time constant of the cone photoreceptor membrane in seconds; * represents convolution operation.
Statistical analysis
SPSS (version 17.0, Chicago, IL) was used for all the statistical analyses. Data were expressed as mean±SE. Paired t test was used to calculate the difference between the glaucomatous eye and the fellow eye (including IOP, C/D ratio, each retinal thickness, and each ERG parameters). One way ANOVA with Tukey adjustment was used to test the differences among the glaucomatous eye, the fellow eye, and a normal monkey eye, respectively. Statistical significance was set at p<0.05.
Results
Following the last laser coagulation 6 years ago, the mean IOP was 36±4 mm Hg in lasered eyes and 20±0.4 mm Hg in fellow eyes. Prior to ERG recording in this study, mean IOP in the lasered eyes (29±3.7 mm Hg) was still significantly higher than in the fellow eyes (13±2.5 mm Hg) (t=0.0062, p<0.05). Enlarged C/D ratio was noted in the lasered eye of every animal. Figure 1a and b shows fundus photos from one glaucomatous monkey. The mean C/D ratio in the lasered eyes (0.96±0.09) was significantly larger than in the fellow eyes (0.44±0.16) (t=0.002, p<0.05).
The overall global RNFL thickness values (G) were significant thinner in lasered eyes (48.40±12.18 mm) than in the fellow eyes (92.40±2.50 mm). There were no statistically significant differences in mean CMT between the lasered eyes (214.8±8.13) and fellow eyes (226.8±19.47) (p=0.49>0.05), and/or the normal monkeys' eyes (201.5±2.10) (p=0.25>0.05). Mean GCC at 0.5, 1, and 1.5 mm from the fovea in temporal and nasal retina were significantly thinner in lasered eyes than in fellow eyes (each p<0.05). No significant differences were found at INL+OPL layer and ORL at 0.5, 1, and 1.5 mm from the fovea in temporal and nasal retina between the two eyes (each p>0.05) (Fig. 4).
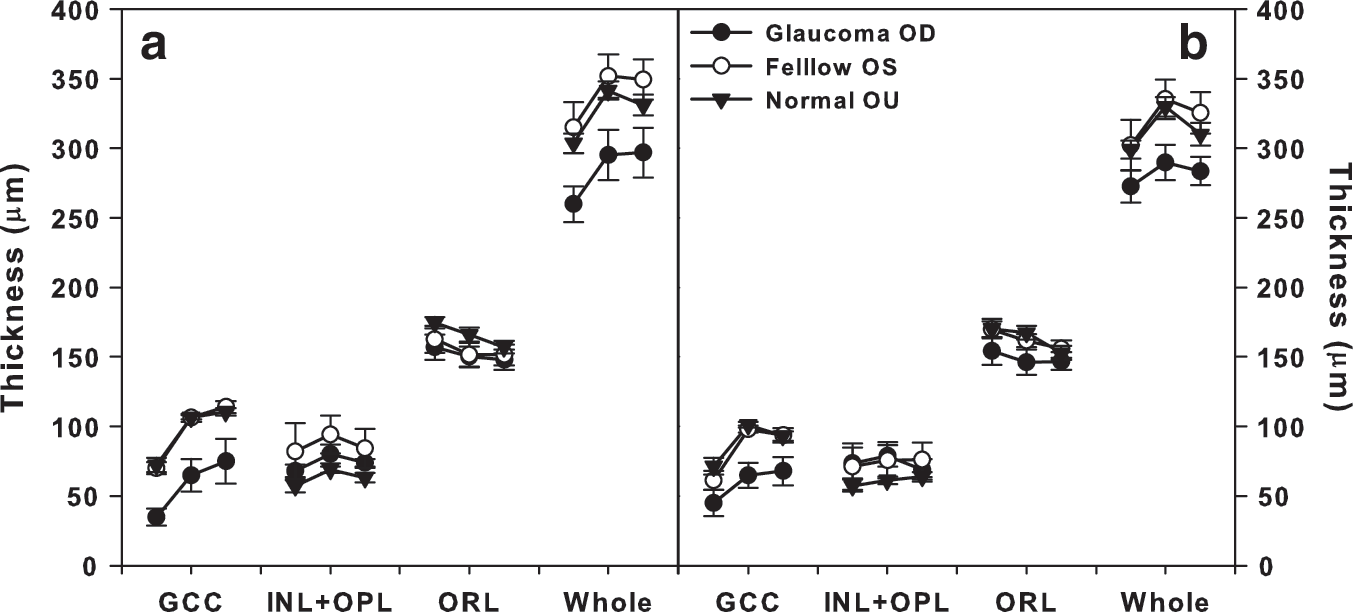
Measurement results of retinal thickness (mean±SE) for the five glaucomatous monkeys. Each retinal thickness measured at 0.5, 1 and 1.5 mm from the fovea in
Photopic responses from two eyes of a glaucomatous monkey and the right eye of a normal monkey are shown in Fig. 5. Mean amplitude of PhNR was significantly lower in lasered eyes than in fellow eyes (p=0.038<0.05). Cone photoresponse parameters derived from the leading edges of a-waves are shown in Fig. 6a–d. The mean value of the cone photoresponse parameters (Rcone and Scone) in both eyes of the five glaucomatous monkeys and four normal monkeys (n=8 eyes) are shown in Table 1. The mean value of Rcone was significantly lower in lasered eyes, and the mean Scone did not differ significantly between the lasered eye and the fellow eye.
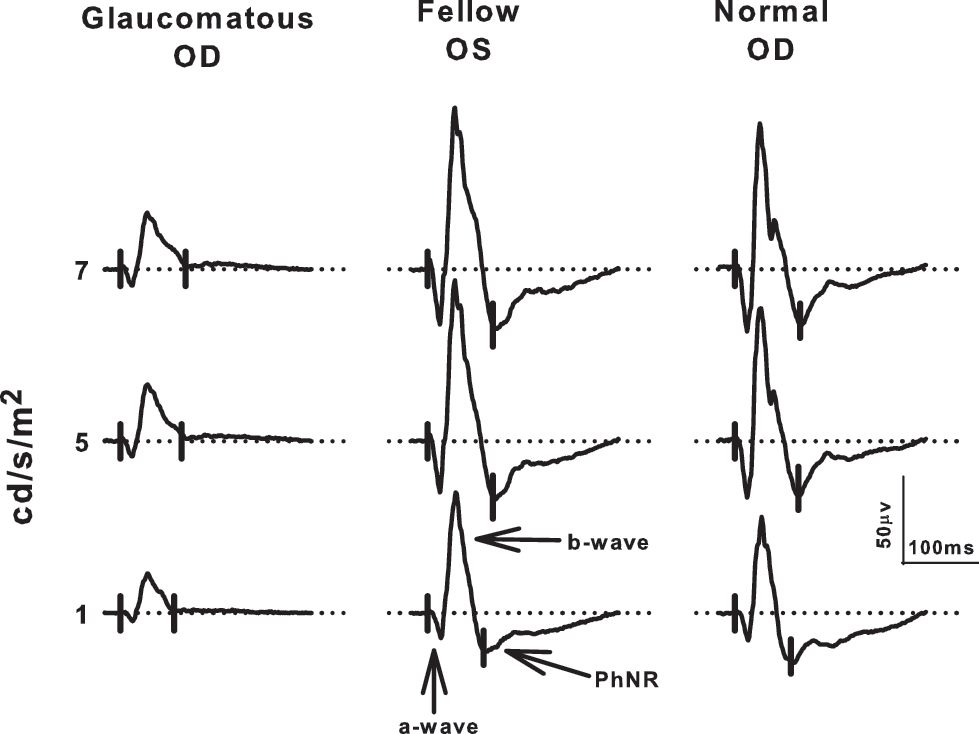
Electroretinogram (ERG) responses in glaucomatous monkeys and normal monkeys. Sample ERG records from both eyes of a glaucomatous monkey and the right eye of a normal monkey by three stimulus intensities. The dotted horizontal line is baseline.

Analysis of the cone sensitivity (Scone) and cone amplitude (Rcone).
Scone, cone sensitivity; Rcone, cone amplitude; OD, right eye; OS, left eye.
There were no statistically significant differences in the mean IT of the a-wave and b-wave between the lasered and fellow eyes (p>0.05).
In the normal monkeys, the optic disc of both eyes looked pink, and C/D ratio was ∼0.3. As expected, there were no statistically significant differences in mean amplitude between the two eyes in the a-wave, b-wave, and PhNR, nor were there any differences in IT.
Discussion
In monkeys with laser-induced ocular hypertension, long-term high IOP resulted in enlarged C/D ratio, thinner RNFL, and GCC. However, there were no statistical differences in the CMT and thickness of ORL. The maximum cone response amplitude (Rcone) was significantly decreased in the lasered eye compared with the fellow eye, whereas no significant difference was found in cone sensitivity parameter (Scone) between the two eyes. Therefore, our results suggest that the function of cone photoreceptors is affected by long-term high IOP.
The reduced Rcone in the glaucomatous monkey may be the result of a decrease in the number of cone photoreceptors, short cone outer segments, and inefficient phototransduction processes. In this experiment, dysfunction of cone photoreceptor appeared to be the result of inefficient transduction processes in cone outer segments rather than significant decreases in the number of cones, or cone outer segment length. The amplitude parameter, Rcone, depends upon the number of channels in the cone outer segment membrane available for closure by light. The sensitivity parameter, Scone, depends upon the movement of transduction cascade proteins within the disk membrane of the cone outer segment. 35,40,42,43 . Therefore, reduced Rcone appeared to be caused by an impaired closure of channels in the cone outer segment in this study. The lack of an effect on cone sensitivity (Scone) suggested that the gain of the processes involved in the activation of phototransduction was not altered. Nork et al. demonstrated that photoreceptor swelling was found, but that there was no loss in the number in the monkey glaucoma model. 7 In this experiment, we did note that mean CMT of normal monkeys' eyes was slightly thinner than that of the lasered eyes, although this difference was not statistically significant (p=0.08>0.05). Therefore, photoreceptor swelling cannot be excluded as a possible explanation of the reduced Rcone in the glaucomatous monkey.
In the primate glaucoma model, multiple laser sessions are usually required to achieve a sustained, elevated IOP. Variability of IOP is a characteristic of the model. 16,44 –50 Therefore, damage of the neuroretina may be a variable dependent on the extent and duration of the elevated IOP. Elevated IOP will decrease ocular blood flow in the optic nerve head, retina, and choroid. The retina tends to maintain a constant blood flow by an intrinsic autoregulatory response, and cause the elevated IOP recover to normal. In fact, the retina had ischemia and reperfusion injury alternatively. It is hard to accurately evaluate the functional and structural change in the outer retina layer, especially soon after the laser treatment, because fluctuating IOP might cause threshold damage in the outer retinal layer. Therefore, it is quite possible that there are different results regarding the outer retinal layer involvement obtained by both structural and functional methods.
Conclusions
Six years after laser-induced high IOP in five monkeys, enlarged C/D ratio was observed. Peripapillary RNFL and GCC became thinner but there was no change in CMT or the thickness of ORL. Rcone was reduced, whereas there was no change in Scone between the two eyes. Therefore, our results suggest that the cone pathway is altered by long-term high IOP induced by laser in monkeys.
Footnotes
Acknowledgments
This study was supported by National Nature Science Foundation of China (NSFC) 81271005 and 81271034. The authors thank Liming Zhu (Department of Experimental Animals, CMU) for monkey anesthesia.
Author Disclosure Statement
No competing financial interests exist.