
Abstract
Introduction
T
PDT has advantages over other forms of therapy, such as good cosmetic results (the healing process is characterized by little or no scarring) and minimal side effects, because it is a well-localized therapy modality. 3 However, it also has some disadvantages such as short light tissue penetration. Also, the lack of information about dosimetry and the mechanisms involved in its action affects the improvement of the therapeutic response to PDT treatments. 3,6,7 The possible synergy between induced photochemical reactions and an increase of temperature in the target area caused by the nonradiative de-excitation of absorbed light is not yet understood. Hence, further experimental work is needed to elucidate the dynamics of PDT and its drawbacks employing novel or modified PS, light sources, and the detailed analysis of the mechanisms of PDT. 3,7
Nevertheless, PDT has been approved in several countries for treatment of some illnesses. 6 Currently, the study of PDT has widened its application range to other skin and tumor diseases such as inflammatory and infectious diseases. 8 –10
Currently, a number of groups are working on new photosensitizers for PDT applications. The first family that was discovered is based on hematoporphyrin (Hp) and its derivatives. Commonly, a 630 nm light source is used for its application in PDT. 11 More recently, the chemical compound, called hypercin (HYP) is being investigated as a promising PS because of its photoactive properties with a high singlet oxygen quantum yield and low genotoxicity. 3,12,13 HYP has several absorption peaks in the range of 260–600 nm; however, for PDT, it can be efficiently excited in a wavelength range of 590–610 nm. 1,3,14
The wavelength of light used for PDT is directly related to the absorption spectrum of the employed PS. The major requirement for any light source employed in PDT is that an adequate illumination of the target tissue can be achieved with it, that is, the light source needs to have the appropriate wavelength for PS activation at a sufficient light intensity; therefore, the needed total optical energy fluence can be delivered to the tissue to be treated efficiently, and also needs to have optimal tissue penetration, which, because of absorption and scattering effects does not exceed more than a few millimeters. 7,15 These requirements were fulfilled by using dye lasers. 16 However, nowadays there are a wide range of light-emitting diodes (LEDs) and diode lasers (DL) that can be used as light sources for PDT. The advantages of LEDs are that they are less expensive and less hazardous than lasers, are thermally nondestructive and readily available, and can be obtained in a wide range of emission wavelengths. 16 –18
In addition to PDT, there are other therapeutic techniques, such as low-level laser therapy, based on the photochemical interaction with a significant influence on cellular functions. Several studies have been performed to examine the influence of dose fractionation 19 and modulation frequency 20 on the effectiveness of photobiomodulation. Nevertheless, there are no commercial systems available to perform automated simultaneous light exposure experiments of cultured cells to different light doses. Few reports on automated cultured cell photoirradiation systems have been published. 21
On the other hand, considering the irradiance and the irradiation times used for cancer treatment, a significant temperature increase can be detected in the irradiated volume. It has been suggested that there could be a synergistic effect on tumor destruction between PDT and the resulting hyperthermia through its application, 12 and hence the study of these effects is important so that one can distinguish between changes caused by phototherapy and changes caused by temperature variations as well as their combined effects. In this work, an irradiance and temperature controlled in vitro system for conducting investigations in PDT and phototherapy is presented. Although several groups have reported on PDT for in vitro experimentation, 18,22,23 none of these systems allows for individual control of the light energy fluence, dose fractionation, and temperature, as is the case for the system presented here.
Finally, actual cell survival data from TPSA23 prostate cancer cells treated with HYP-PDT were obtained using the reported photoirradiation system.
Materials and Methods
An LED array-based illumination system to perform in vitro tests employing 96 well standard microwell plates has been developed. The system consists of three separate modules: (1) the control/power module, (2) the irradiation module, and (3) the temperature measurement module. A block diagram of the system is shown in Fig. 1.
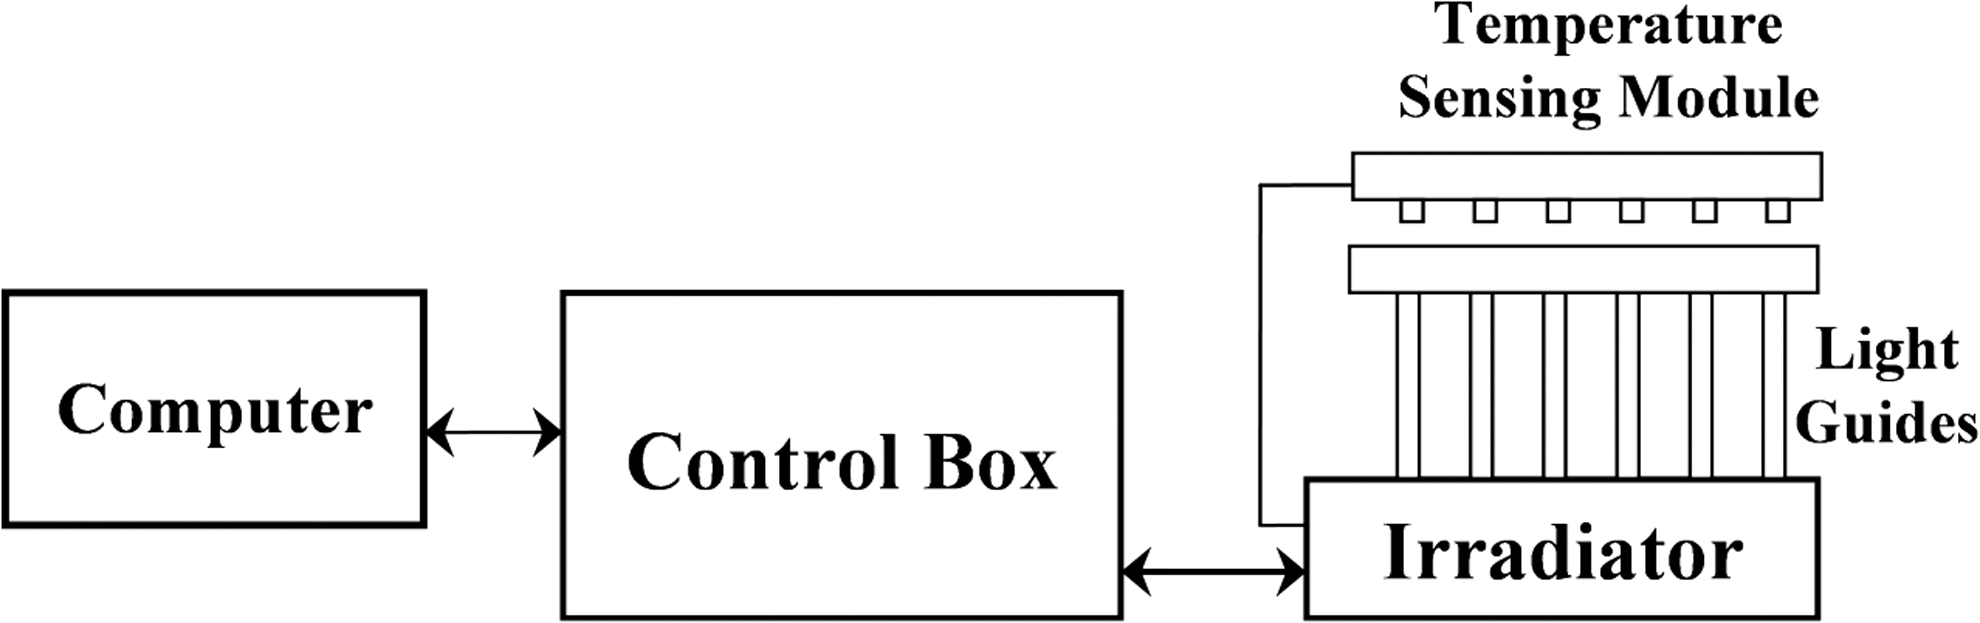
Block diagram of the developed system.
The irradiation system includes a 24 LED array for the irradiation of the microwell plates. In order to achieve the desired light energy fluence, special software was developed in C#. The software can control the irradiance and the on time of each LED for the application of certain light energy fluences in J/cm2. In addition, the system performs real-time temperature measurements of each irradiated well, allowing control of the increase in temperature of any given irradiation well. The system can work in two different temperature modes, which are as follows.
Mode I. In this mode, an upper threshold for the maximum temperature is set. The system will prevent the rise of the temperature in any well above the preset threshold temperature by controlling the current through the LED. The irradiation time is accordingly modified in order to maintain the necessary light energy fluence. The system automatically detects the room temperature and takes it as the lower threshold for the temperature.
Mode II. In this mode, the system will guarantee that a certain minimum temperature is achieved in any well during the photoirradiation. When the desired temperature is reached, the system limits the LED current so that the temperature is kept constant. In case the desired temperature value is not achieved, the system continues the irradiation process normally until the preset light energy fluence is delivered.
The irradiation module consists of two parts: the LED's compartment and the light guides coupled to it. The LED compartment is an acrylic box having a length, width, and height of 19 cm ×12 cm × 9.6 cm, and contains the 24 LED array. The LEDs have been mounted on an aluminum plate using a special thermal tape (BER246-ND) for thermal bonding. The aluminum plate has been coupled to a rectangular-shaped heatsink (N13070-35B). Three 5 cm diameter fans (VN2-012P) have been used to establish air flow for cooling to keep the LED array at a proper operating temperature of ∼25°C, according to the LED data sheet.
Light guides were developed to allow for irradiation of 24 wells. Each of the 24 clear acrylic rods, which have a 6 mm diameter and a 10 cm length, was covered by Teflon film to prevent mechanical damage to the light guide. The light guides were then coupled to a receptacle that allowed one to place a standard the microwell plate on top of it. The length of the light guides was chosen such that a temperature increase in the irradiation wells caused by heat convection from the LEDs' plate would be minimal. To limit the irradiation from neighboring wells, the 24 light guides were placed such as to irradiate every other well in any direction of a standard 96 microwell plate (CL3595). For the LED to light guide coupling a black acrylic base of 4 mm thickness and 13 cm × 9 cm was used. Two LED arrays of different wavelengths were built: a 591 nm (LXM2-PL0-0000) and a 630 nm (LG-05W4C3-503FB).
The control/power module contains all the elements for communication of the system with an external computer as well as the power supply stage for the LEDs. Figure 2 shows a block diagram of the elements of the control/power module.
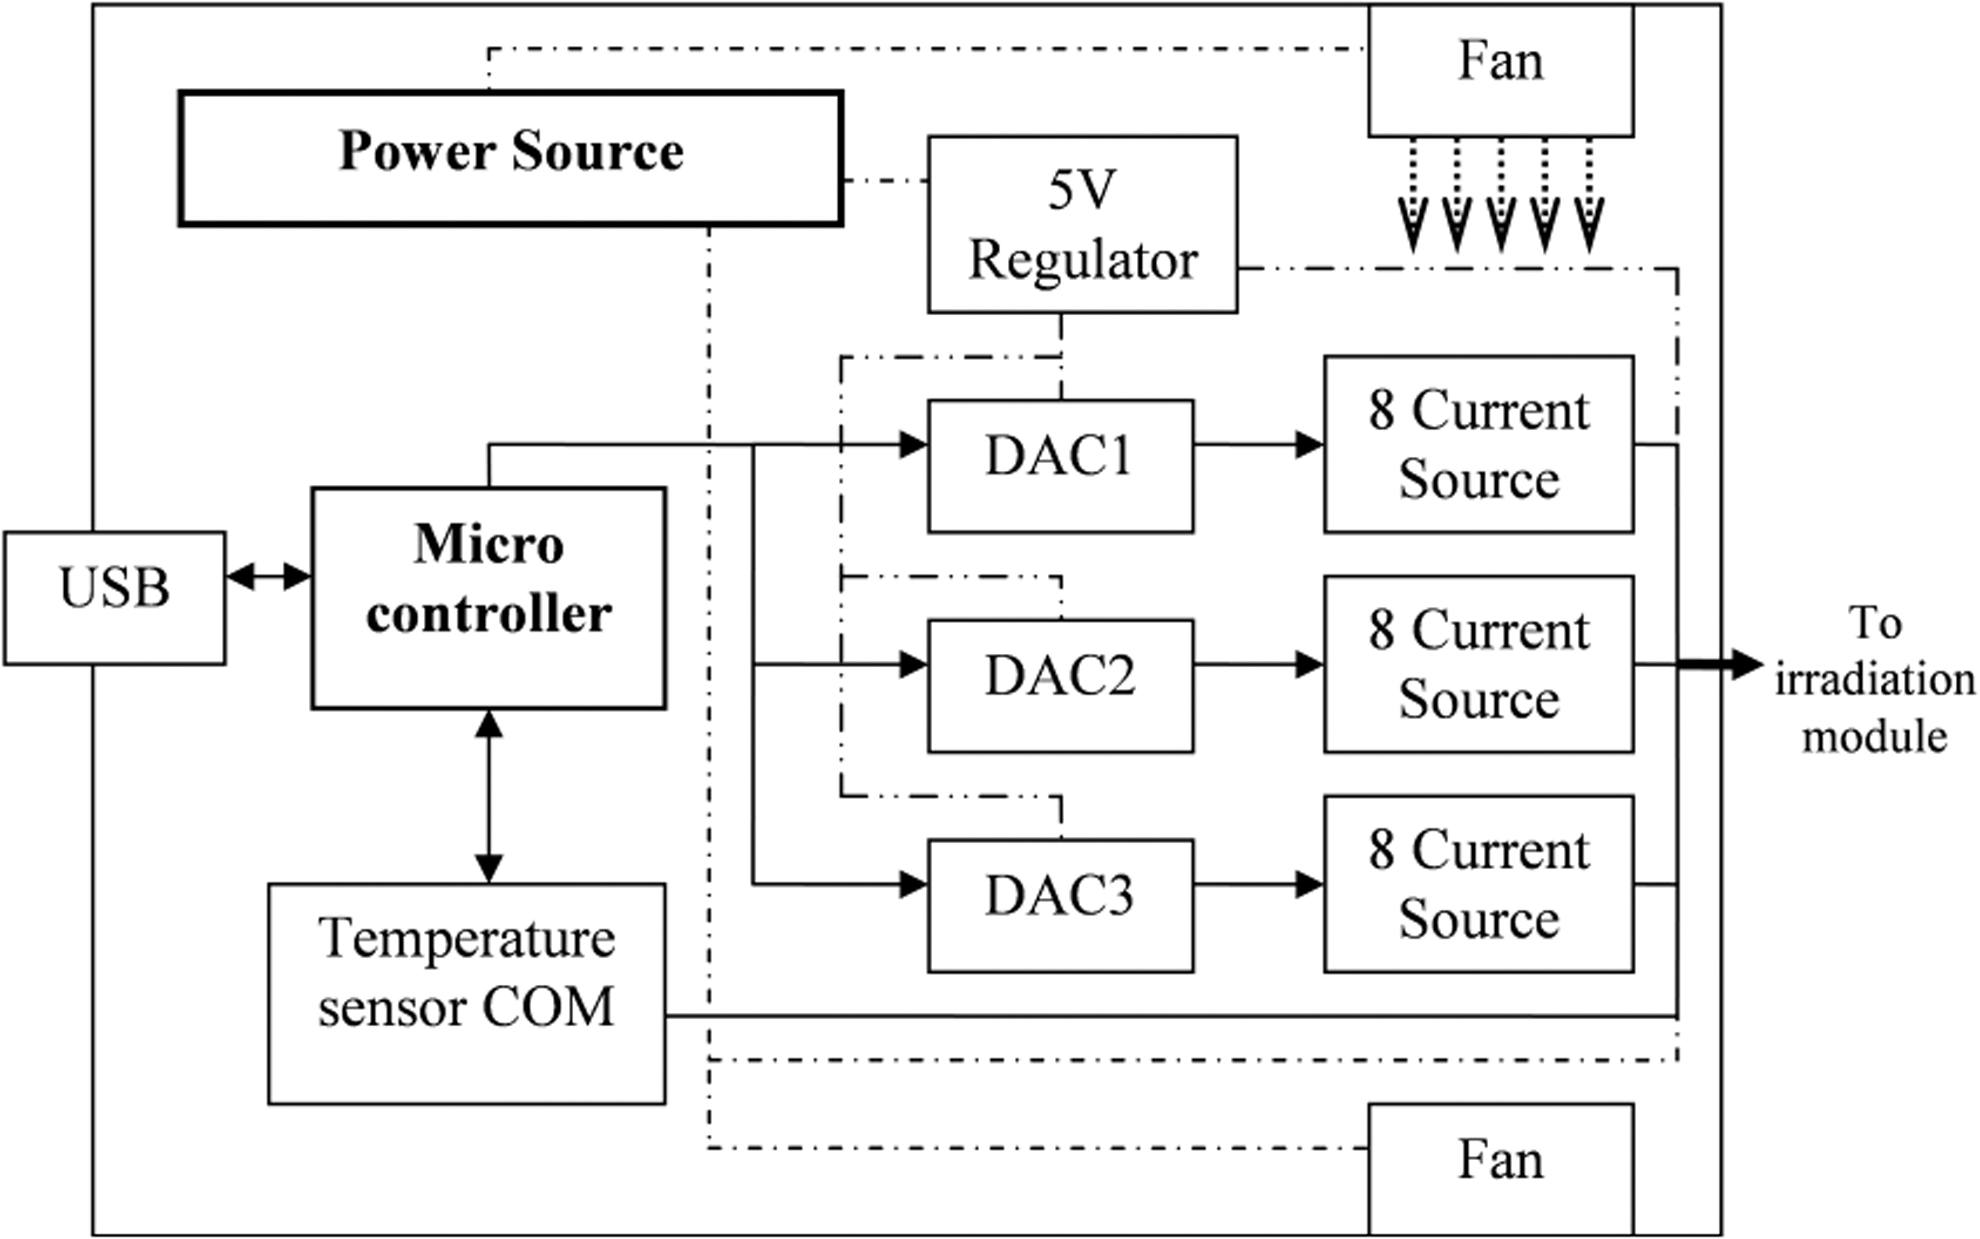
Control/power box block diagram.
Voltage control was implemented using a 12 bit digital-analog converter (LTC2637CMS-HZ12) that was capable of generating eight independent analog outputs. Each digital-to-analog (DAC) output was connected to a current control circuit, shown in Fig. 3. It consists of an operational amplifier (LT1014CN) controlling the gate of a MOSFET transistor (IRF830), used to establish a correspondence between the voltage drop across a precision resistor RSENSE (ALSR0310R00FE12) and the voltage at the noninverting input of the operational amplifier. Thus, the LED current is controlled by a linear relationship shown in Equation 1.
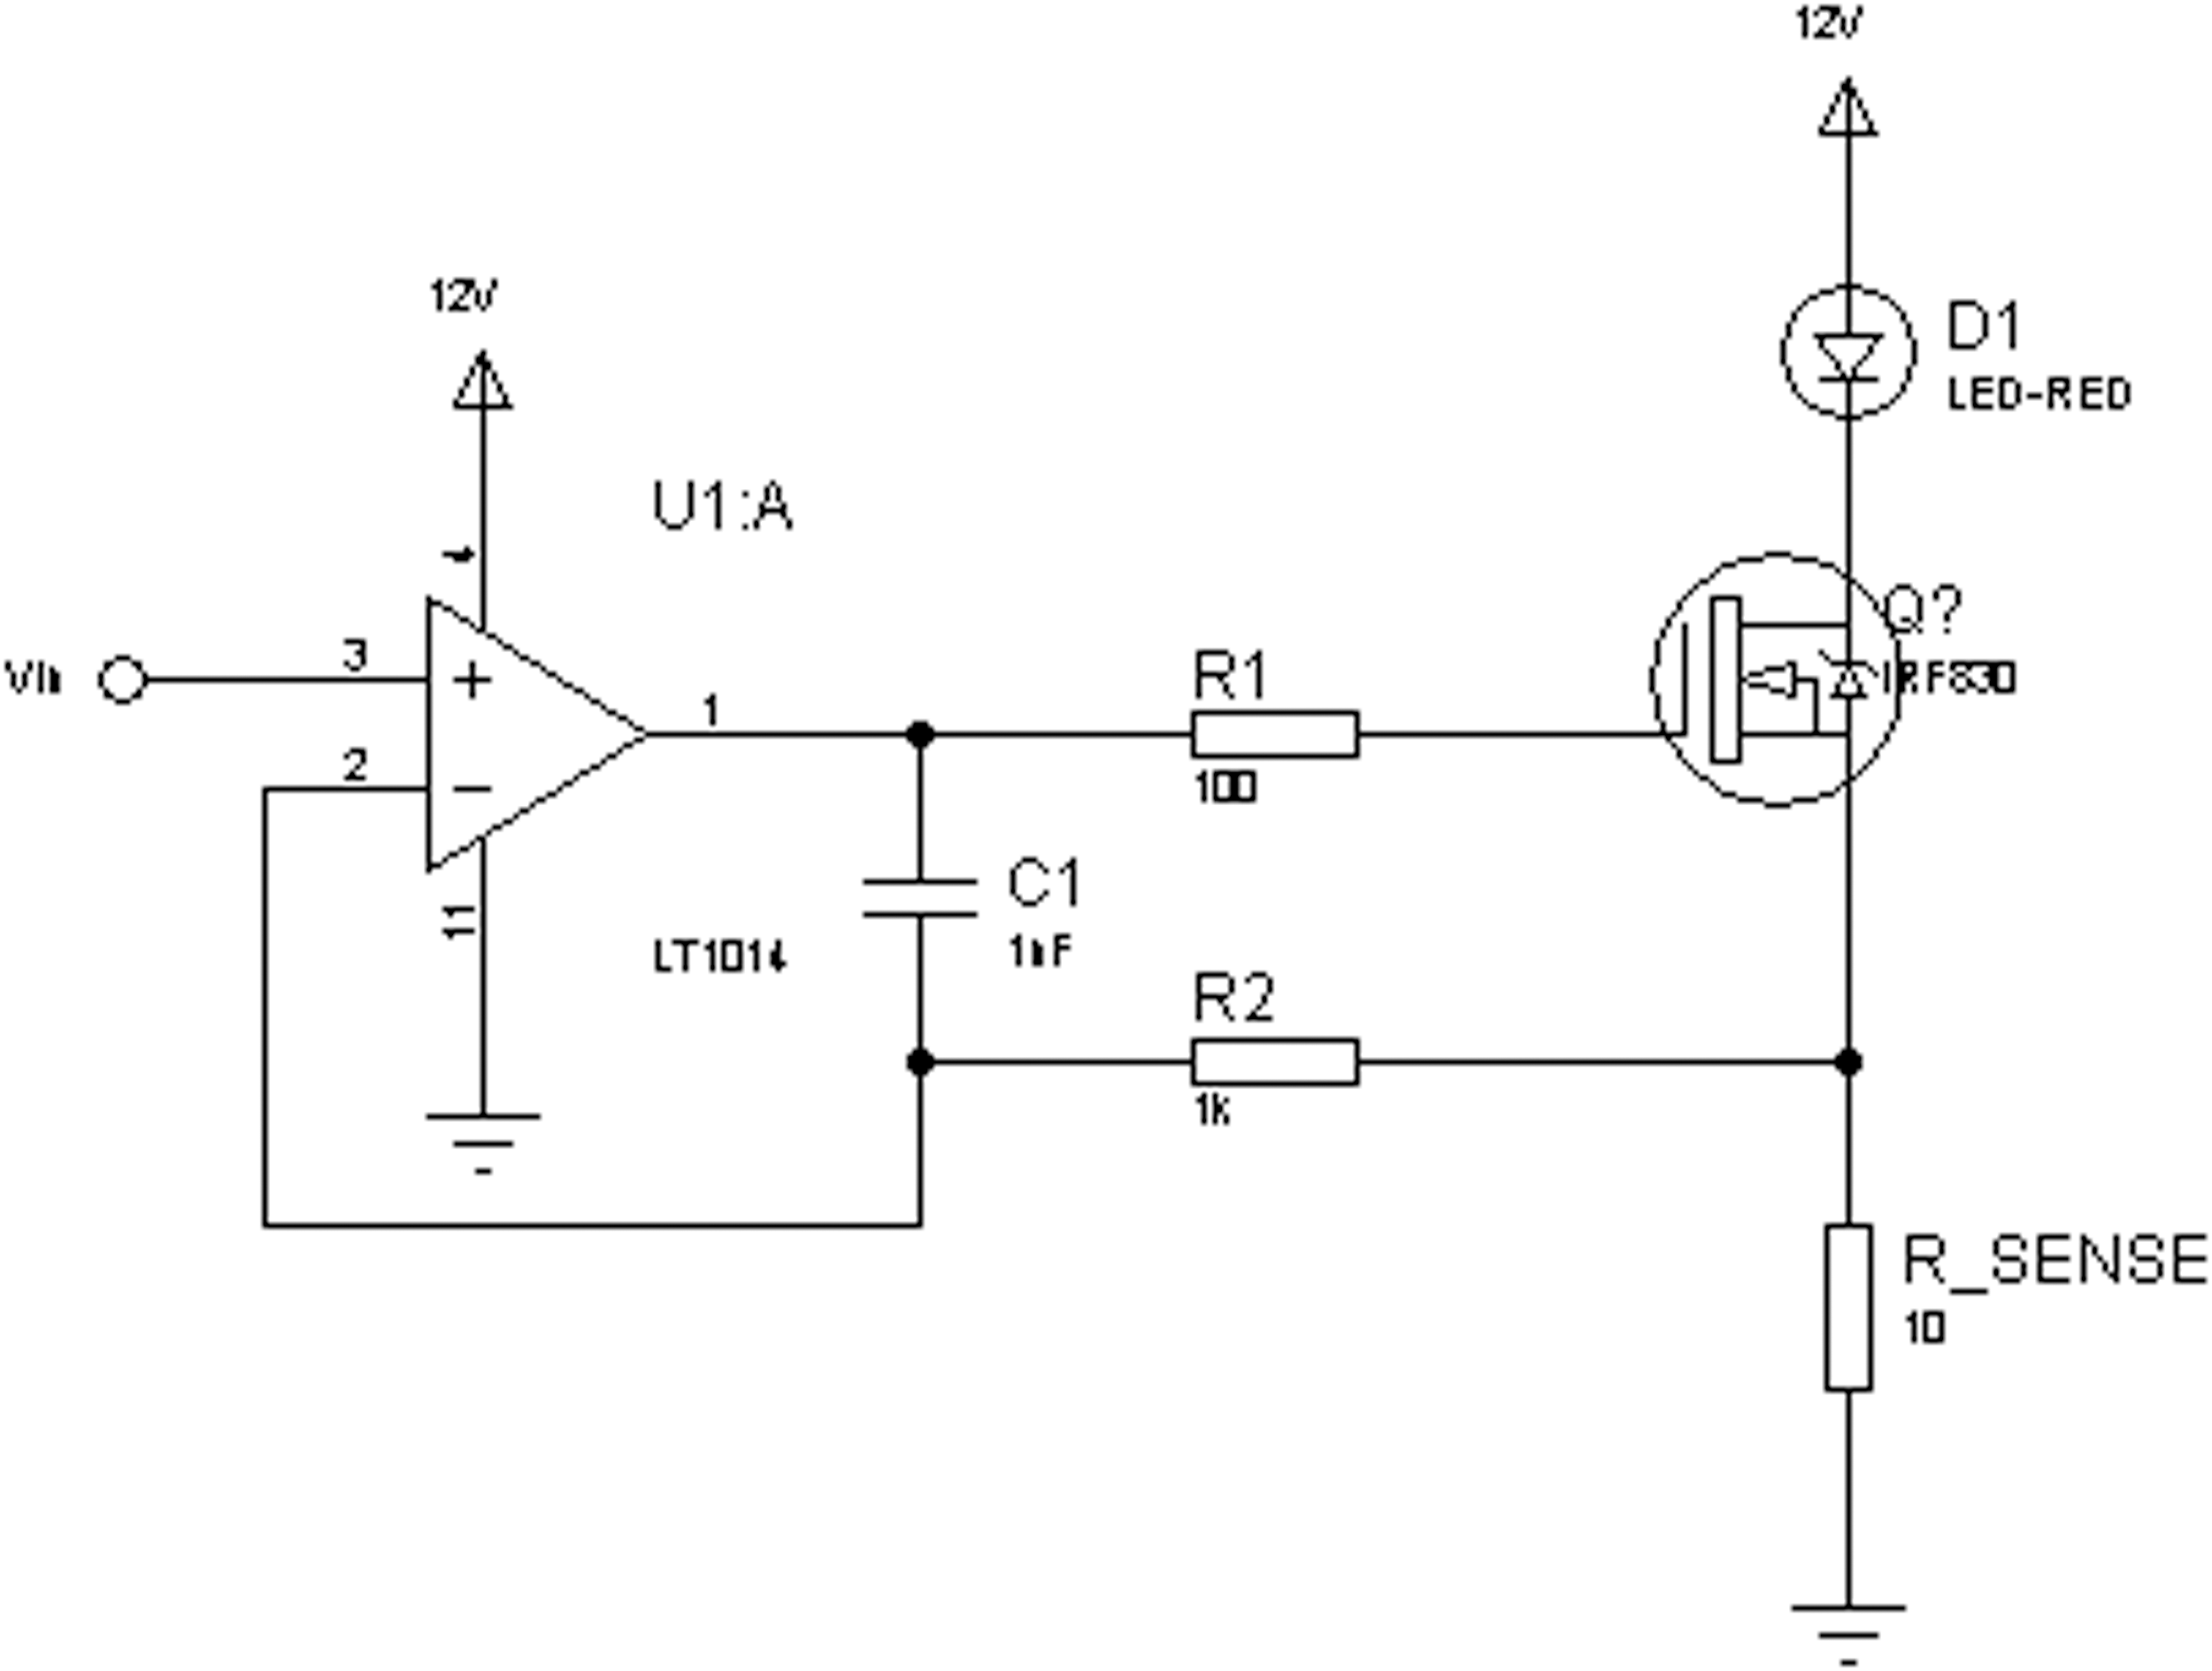
Current control circuit used for light-emitting diode (LED) control.
In order to keep the transistors at the proper operating temperature, they were placed in contact with a 24 cm × 4 cm × 0.3 cm aluminum heat dissipative plate. An Arduino board was used to control the DAC value modifying the LED current, to acquire the temperature data, and to provide the connection with the computer. Each current source can provide 400 mA. The entire system is powered by a 12 VDC at a 12.5 A power source (HF150W-SMF-12). The total dimensions of the control module are 14 cm × 14.2 cm × 26.2 cm.
The temperature sensing module consists of 24 infrared temperature sensors (MLX9264) that are placed over the microwell plate for noncontact temperature measurement; sensors were welded on to a printed circuit board. They can operate within a temperature range of −40°C to +125°C with a resolution of 0.02°C.
The spectral emission of the LED array was recorded with using a spectrometer (USB4000). Meanwhile, a thermopile (PM100USB) was used to measure the optical power output directly from the LEDs and through the coupled light guides.
In order to measure the spatial irradiance coming from neighboring wells, experiments were performed using a custommade spatial irradiance sensor. In order to measure the parasite contribution to the light fluence rate, the sensor was placed within a microwell and the surrounding neighbors were turned on, increasing their current by 50 mA up to 400 mA. The well in which the sensor was placed was turned off for the measurement. Also, the contribution to the light fluence rate in any well from the nonsurrounding wells and all LEDs from the array were also tested. Figure 4 shows the distribution and the numeration of the microwell plate. For measurements, well 6C was selected because it allows all possible neighbor wells to be turned on. The first wells turned on were the closest eight surrounding neighbors (wells 4A, 4C, 4E, 6A, 6E, 8A, 8C, and 8E), followed by wells 2A, 2C, 2E, 2G, 4G, 6G, 8G, 10A, 10C, 10E, and 10G (altogether 11 neighbors) to test the influence of the more distant wells. Lastly, the most distant neighbor wells 12A, 12C, 12E, and 12G were turned on to measure the contribution from these. Finally, the whole LED matrix was turned on, except for the measurement well. The experiments were repeated with empty wells that were filled with a solution of methylene blue at 1%.

Distribution and numeration of the irradiated wells.
Cell survival was quantified by flow cytometry for TPSA23 prostate cancer cells plated on 96 well plates and treated using the individually controlled light guides of the in vitro PDT system. Prior to treatment, cells were incubated for 16 h with either cell culture media alone, or media containing 1μg/mL HYP. Approximately 3 × 10⁵ cells were plated in each well, which were then subsequently treated to varying light doses between 0 and 25 J/cm2 using the amber 597 nm wavelength LEDs, at an irradiance of 30 mW/cm2. Quantification of live/dead cells was performed on flow cytometry after staining the cells using a 4',6-diamidino-2-phenylindole (DAPI) live/dead marker.
Results
For the red LEDs, the maximum optical power output through the light guide was 55.0 ± 3.2 mW. Figure 5 shows that power output varies linearly with the current for the red LED (line with star symbols). Given that each microwell has an area of 0.283 cm2, this leads to a maximum direct irradiance of 194.5 mW/cm2. As can be seen from Fig. 6, the mean value of the peak of the emission spectrum wavelength of whole red LED array (thin line) is 630.9 ± 1.5 nm with a full width at half maximum (FWHM) of 15.2 ± 0.6 nm. Measurements were performed at a temperature of 27.6 ± 3.6°C.
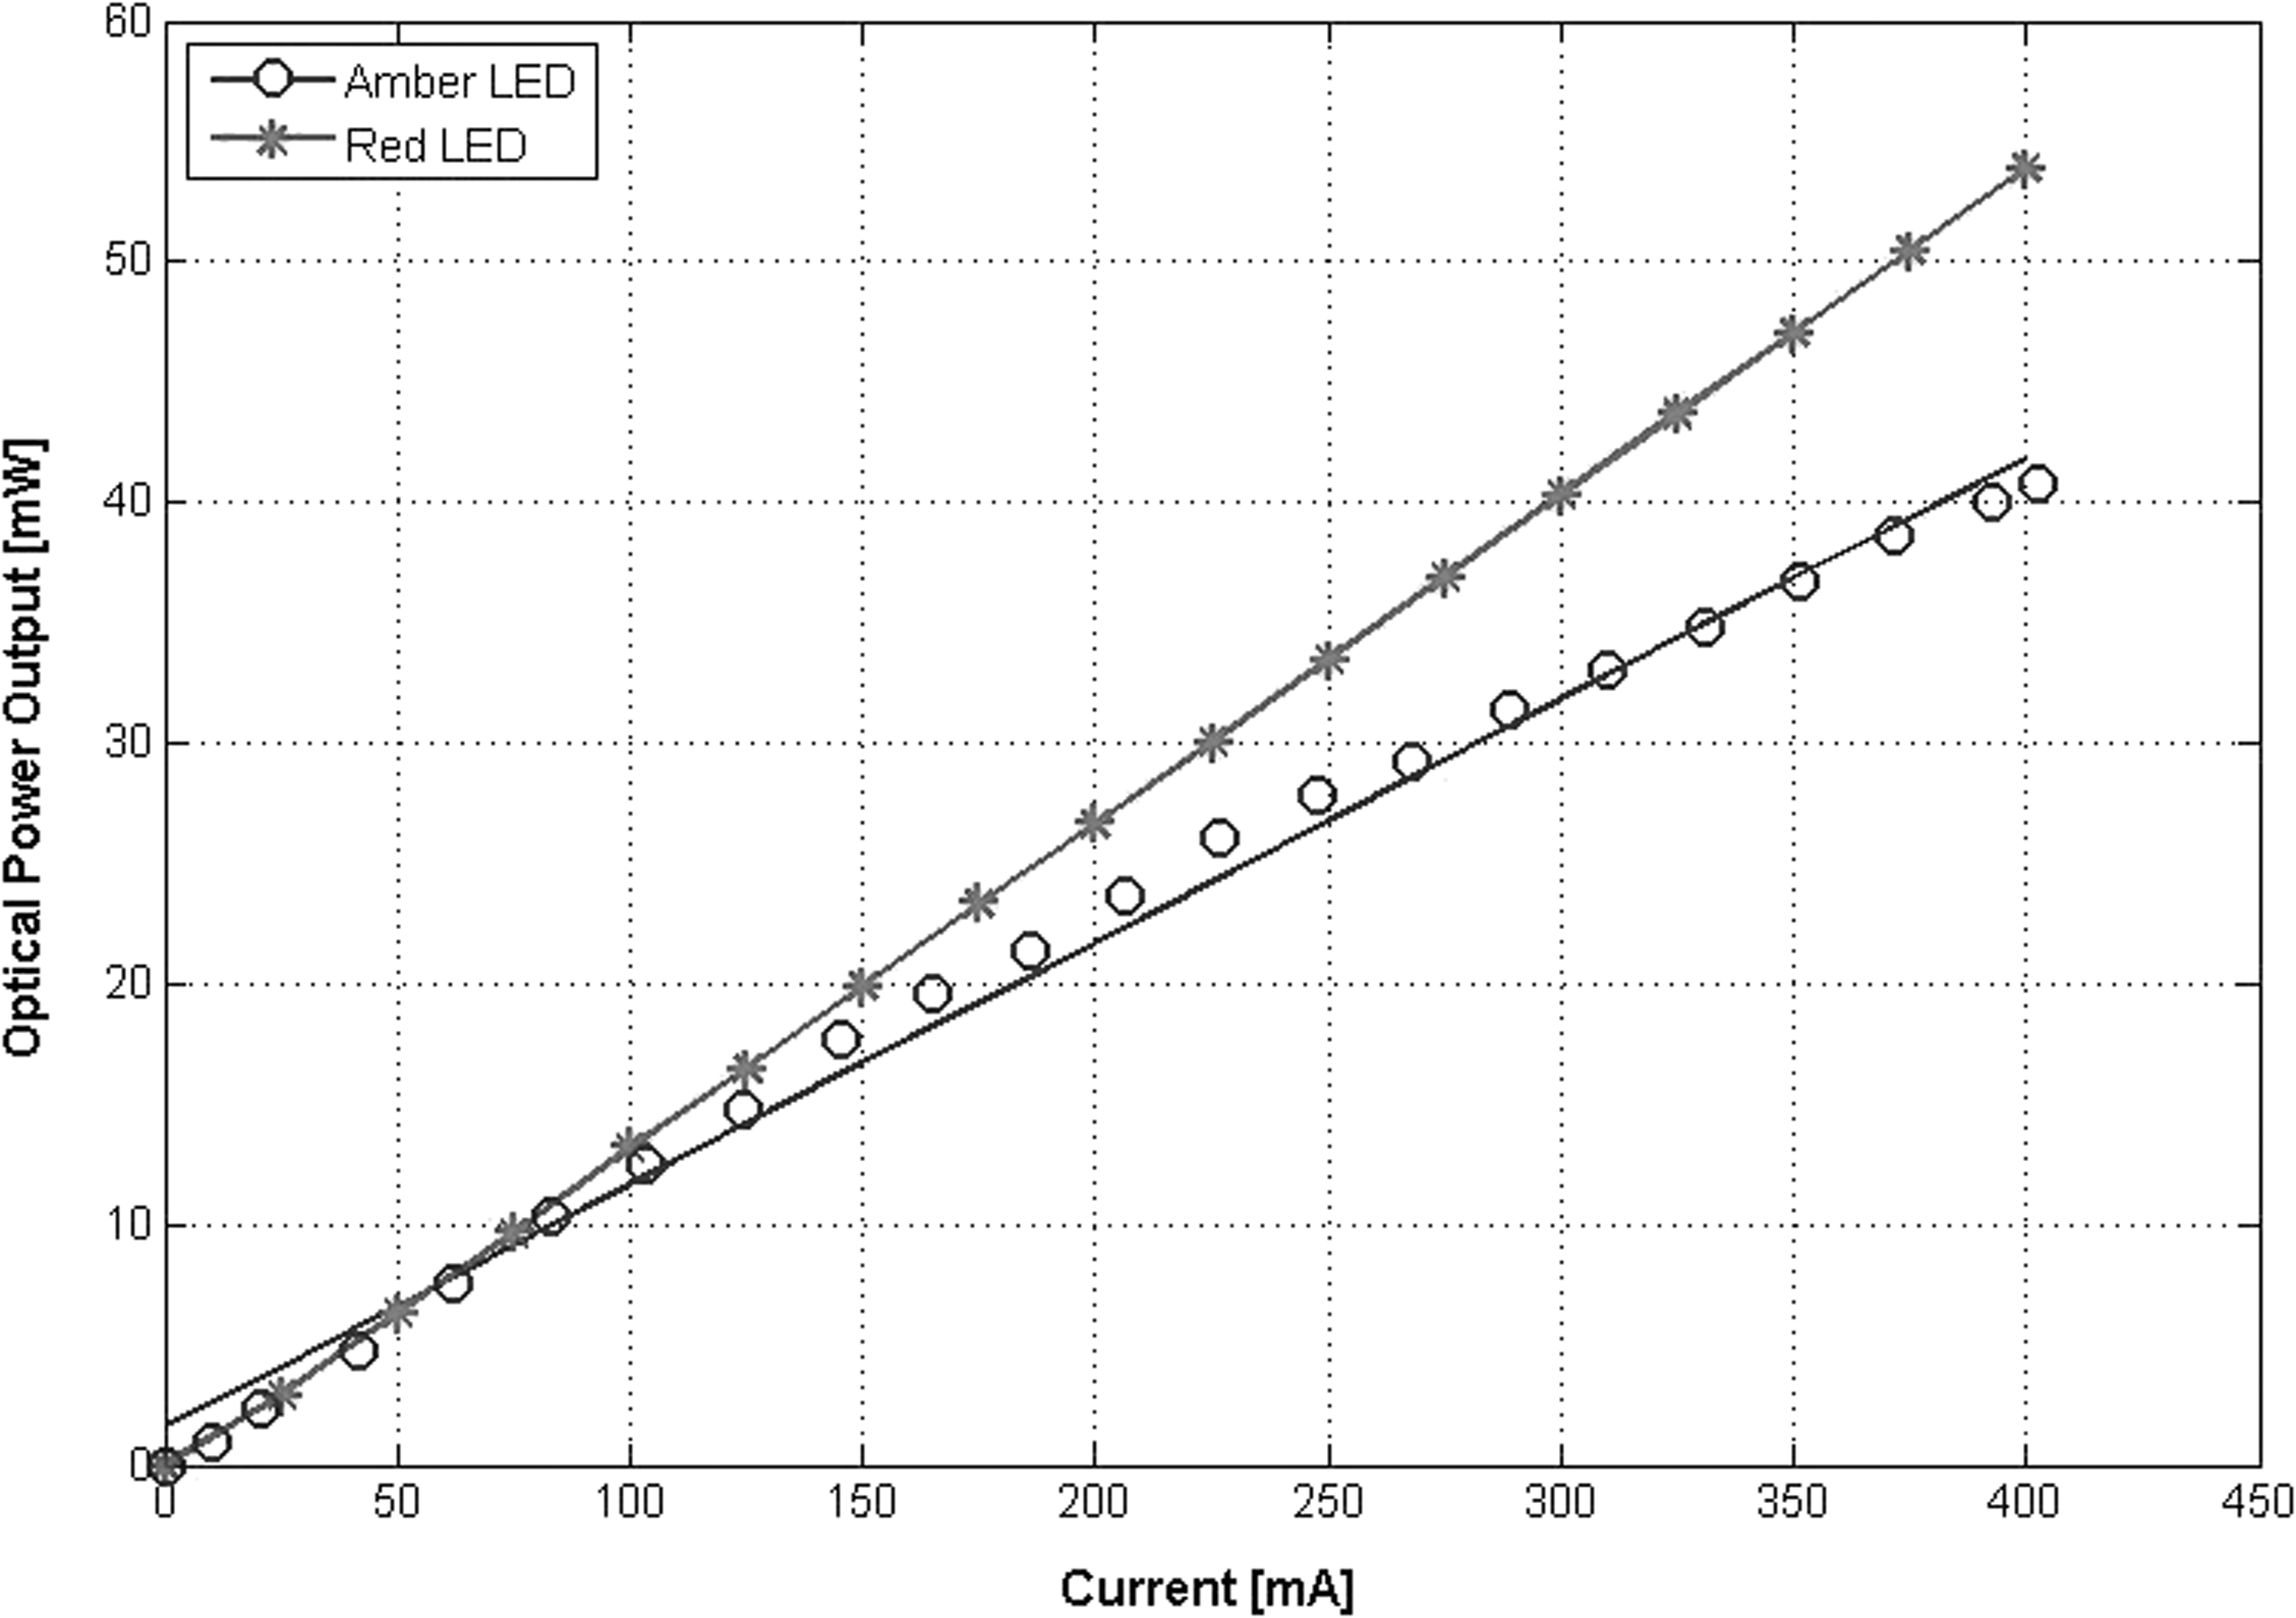
Optical power output of red and amber light-emitting diodes (LEDs) with light guides.
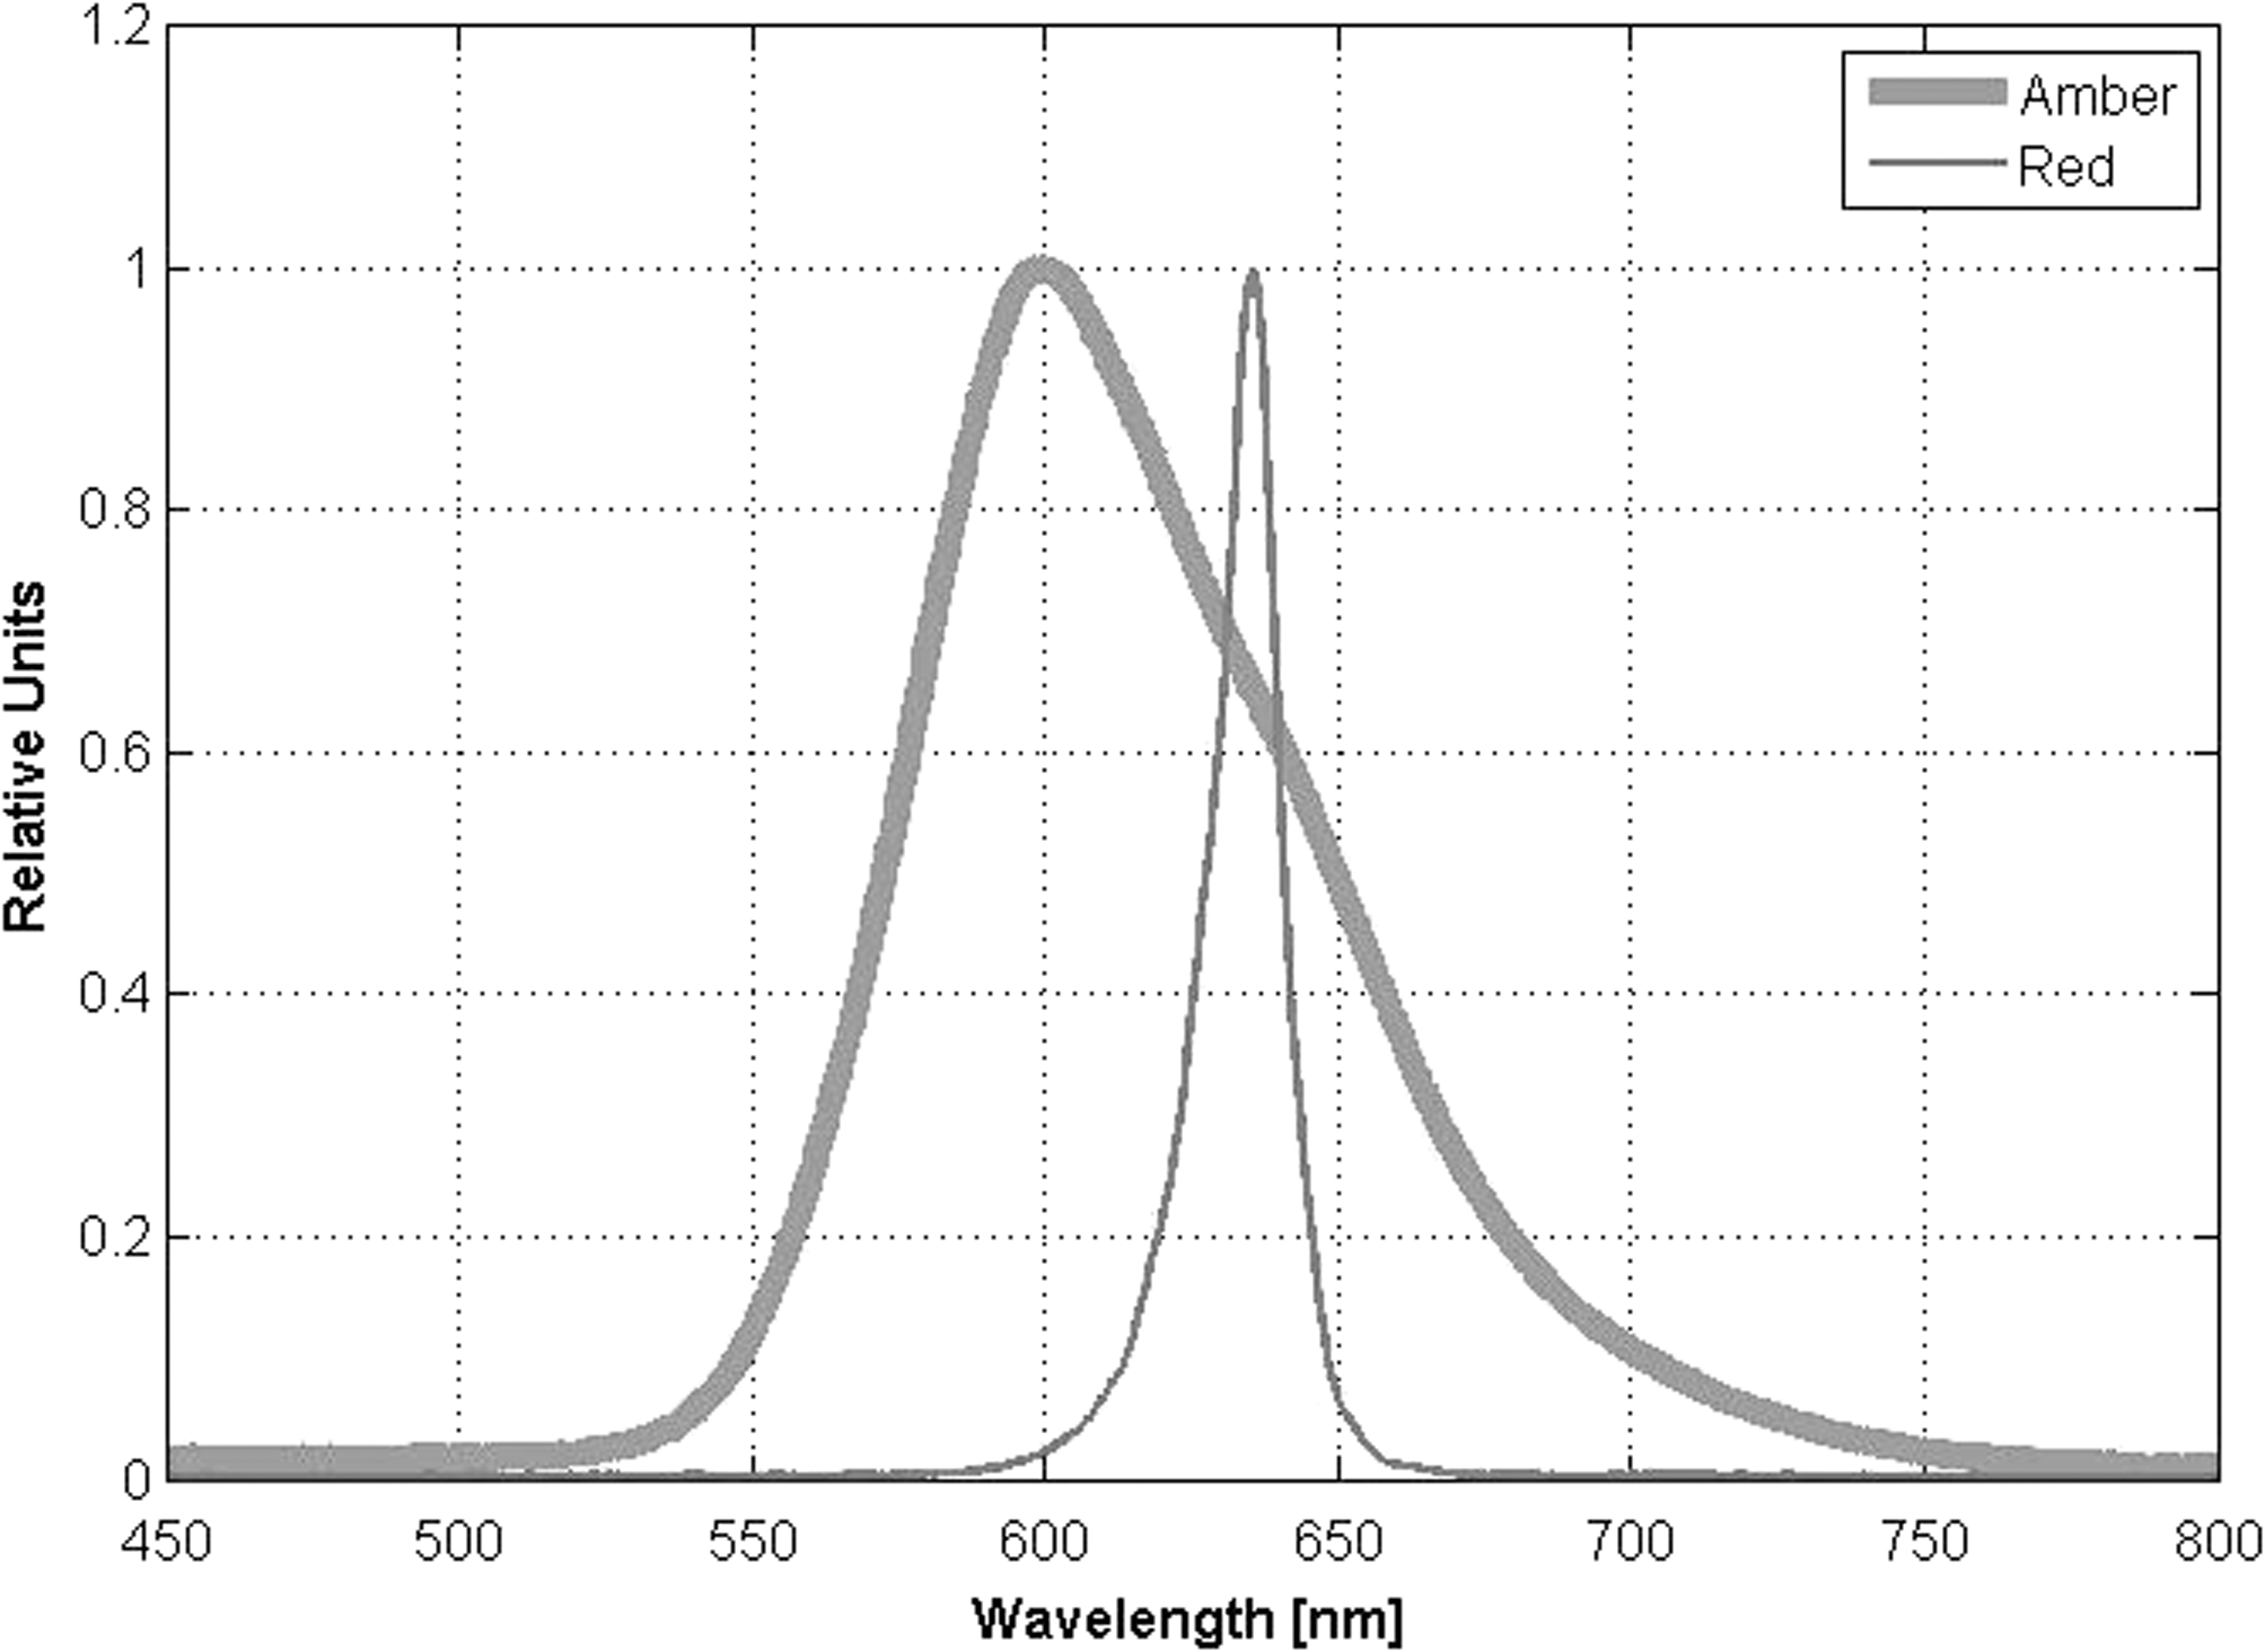
Emission spectra of red and amber light-emitting diodes (LEDs).
For the amber LED array, the maximum optical power output using the light guides was found to be 40.8 ± 0.4mW. Figure 5 shows a supralinear behavior of power output with current for the amber LED (open circles). Despite a supralinear behavior, but the experimental points can be fit to a linear function with sufficiently good fitting parameters [sum of squares due to error (SSE) = 85.1, R2 = 0.995, and root-mean-square error (RMSE) = 5.83]. For the amber LED array, the maximum direct irradiance was found to be 144.2 mW/cm2. As can be seen from Fig. 6, the mean value of the peak of the emission spectrum wavelength of the whole amber LED array (thick line) was 596.9 ± 1.1 nm, with a FWHM of 79.2 ± 2.3 nm. Measurements were performed at a temperature of 28.1 ± 3.4°C. The presented system can be operated in a continuous wave mode or in a modulated light mode up to 100 Hz. This modulation is performed by software.
The performance of the system using irradiation mode I (compare Fig. 7) and mode II (compare Fig. 8) was evaluated using the following experimental setup in which each well was filled with 10% methylene blue solution, and an indented energy fluence of 117 J/cm2 was delivered to the methylene blue solution using the maximum irradiance of the well of 195 mW/cm2, which corresponds to a 400 mA current through the LED. The ambient temperature during this experiment was of 23.2°C. For control mode I, it can be seen from Fig. 7 that until the temperature limit of 28°C is reached, the system irradiates the well with the initially selected irradiance. However, once the temperature limit is crossed, the current continuously decreases to avoid overheating the well. In order to deliver the intended energy fluence, the remaining exposure time is recalculated every time the current through the LED decreases, resulting in a decrease in the irradiance. Therefore, in control mode I, it is possible to irradiate cells with a certain energy dose approaching the limit temperature value from below.
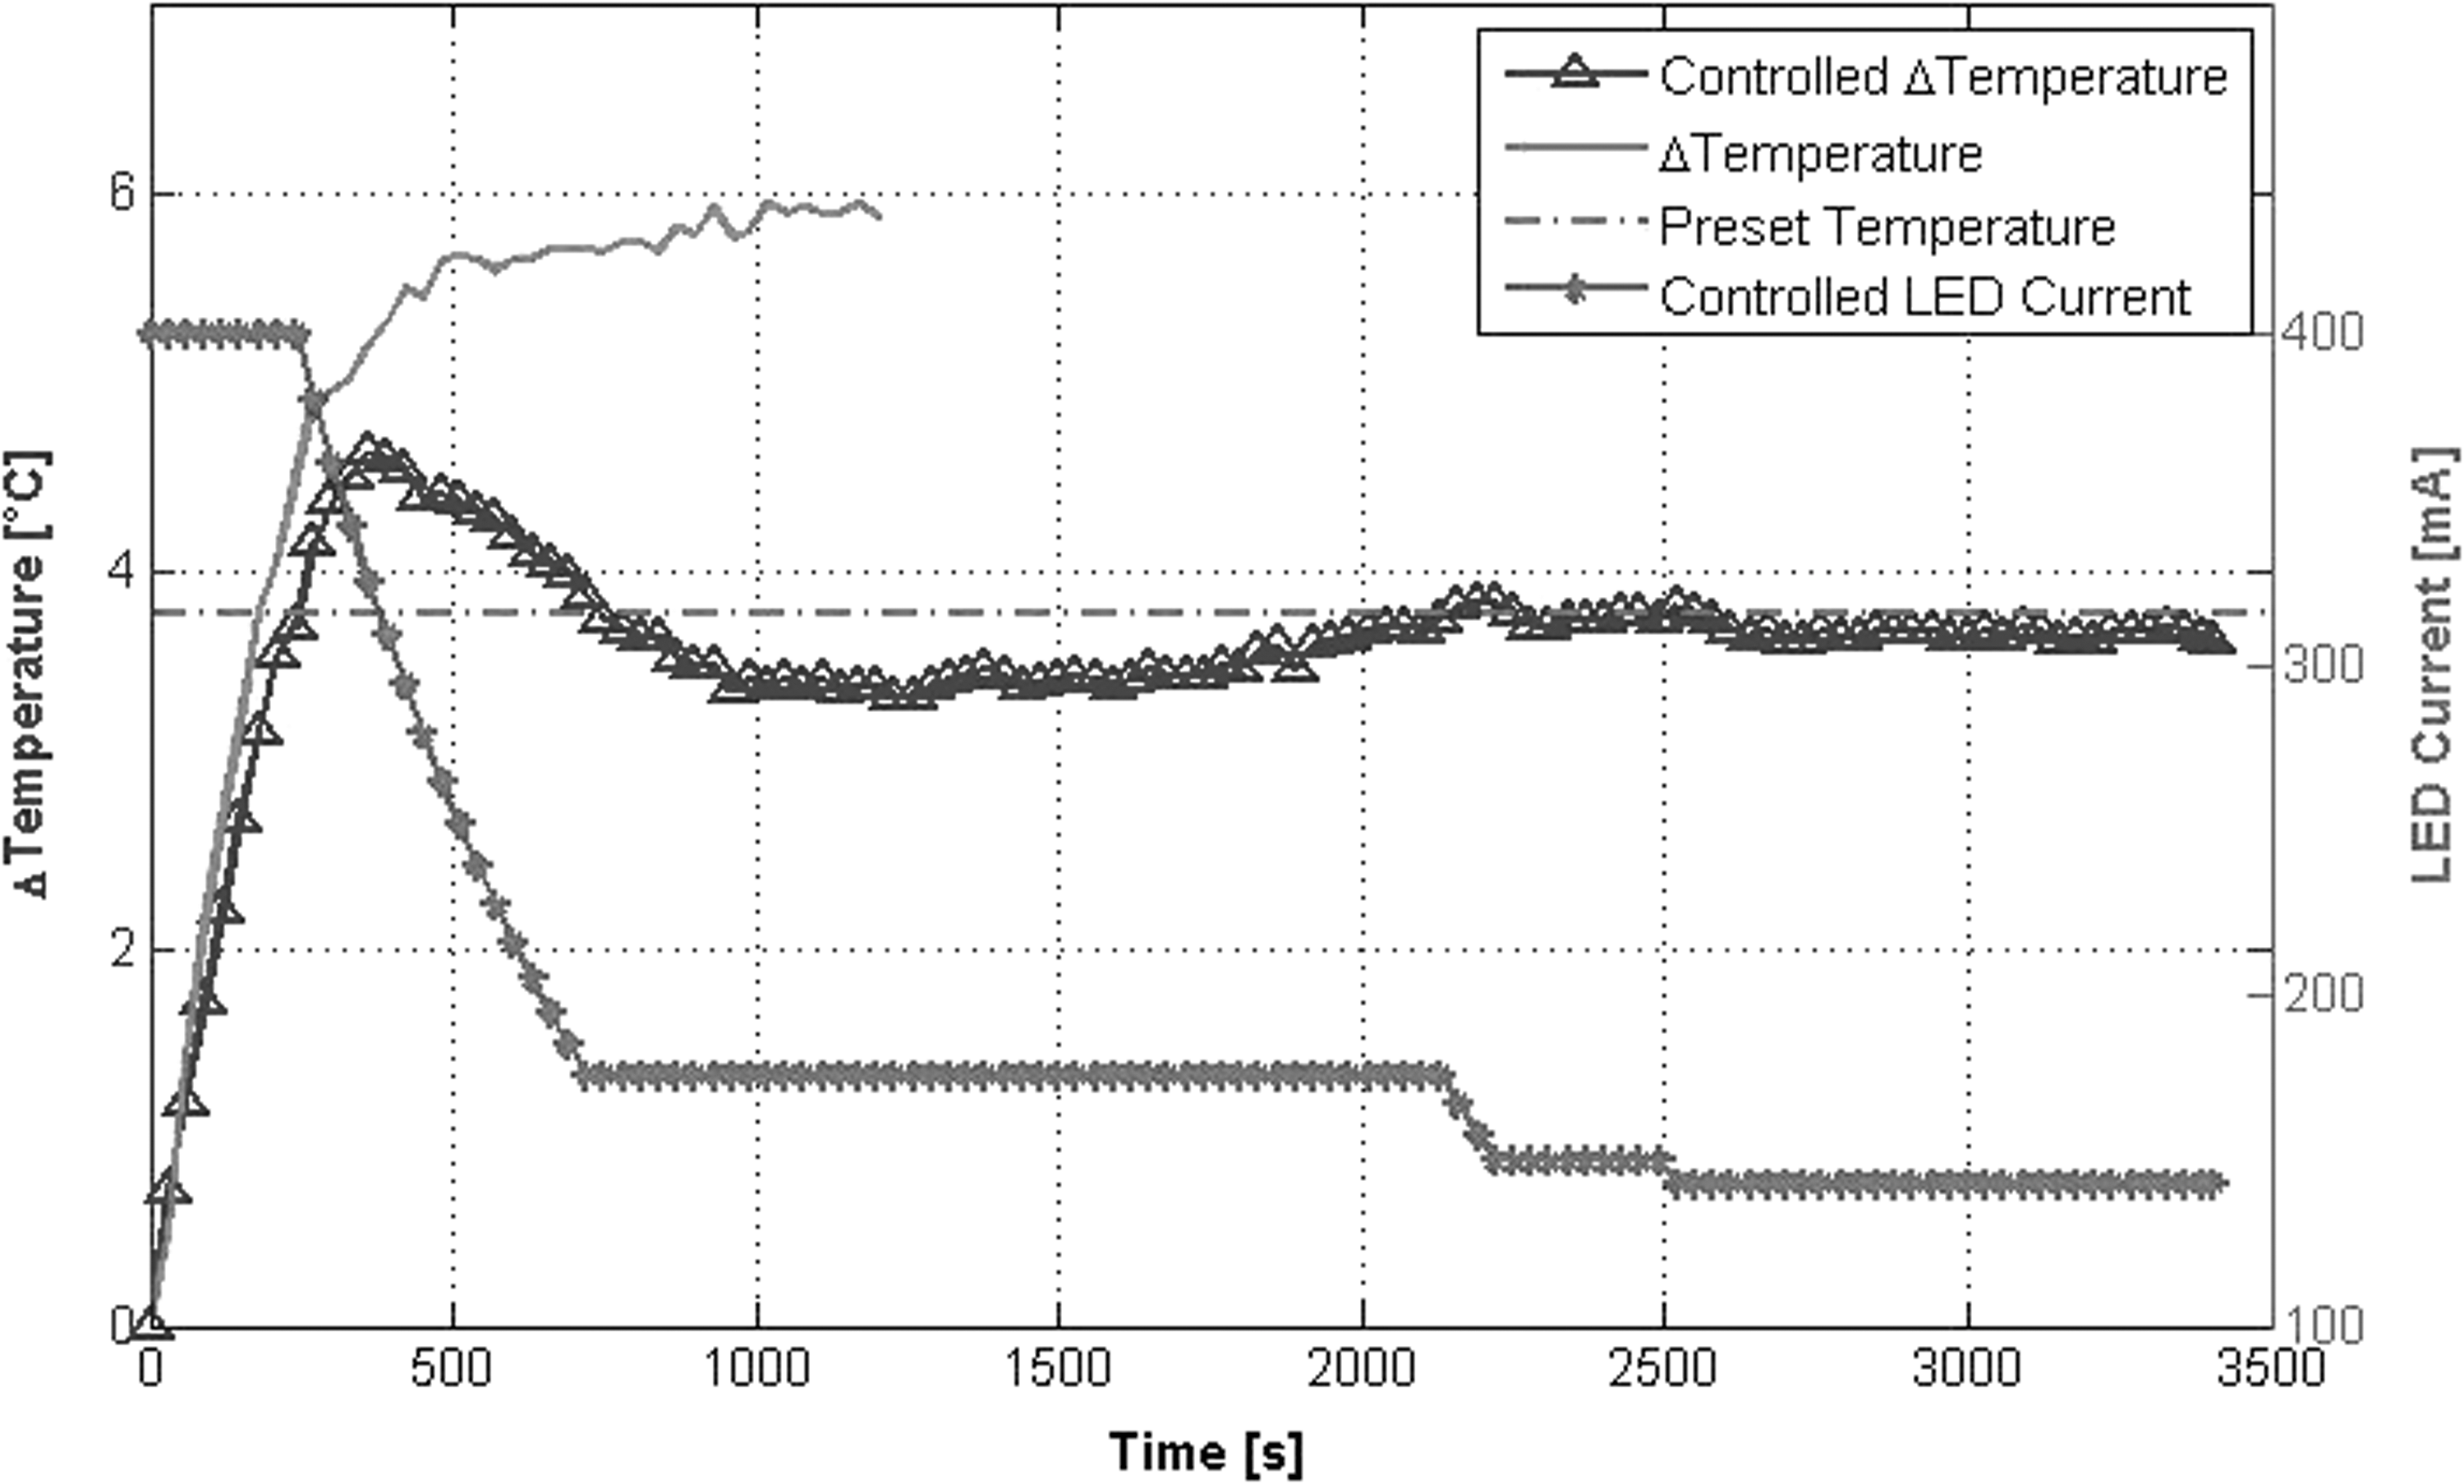
Temperature behavior and light-emitting diode (LED) current during the irradiation of the solution of methylene blue at 10% using control mode I.
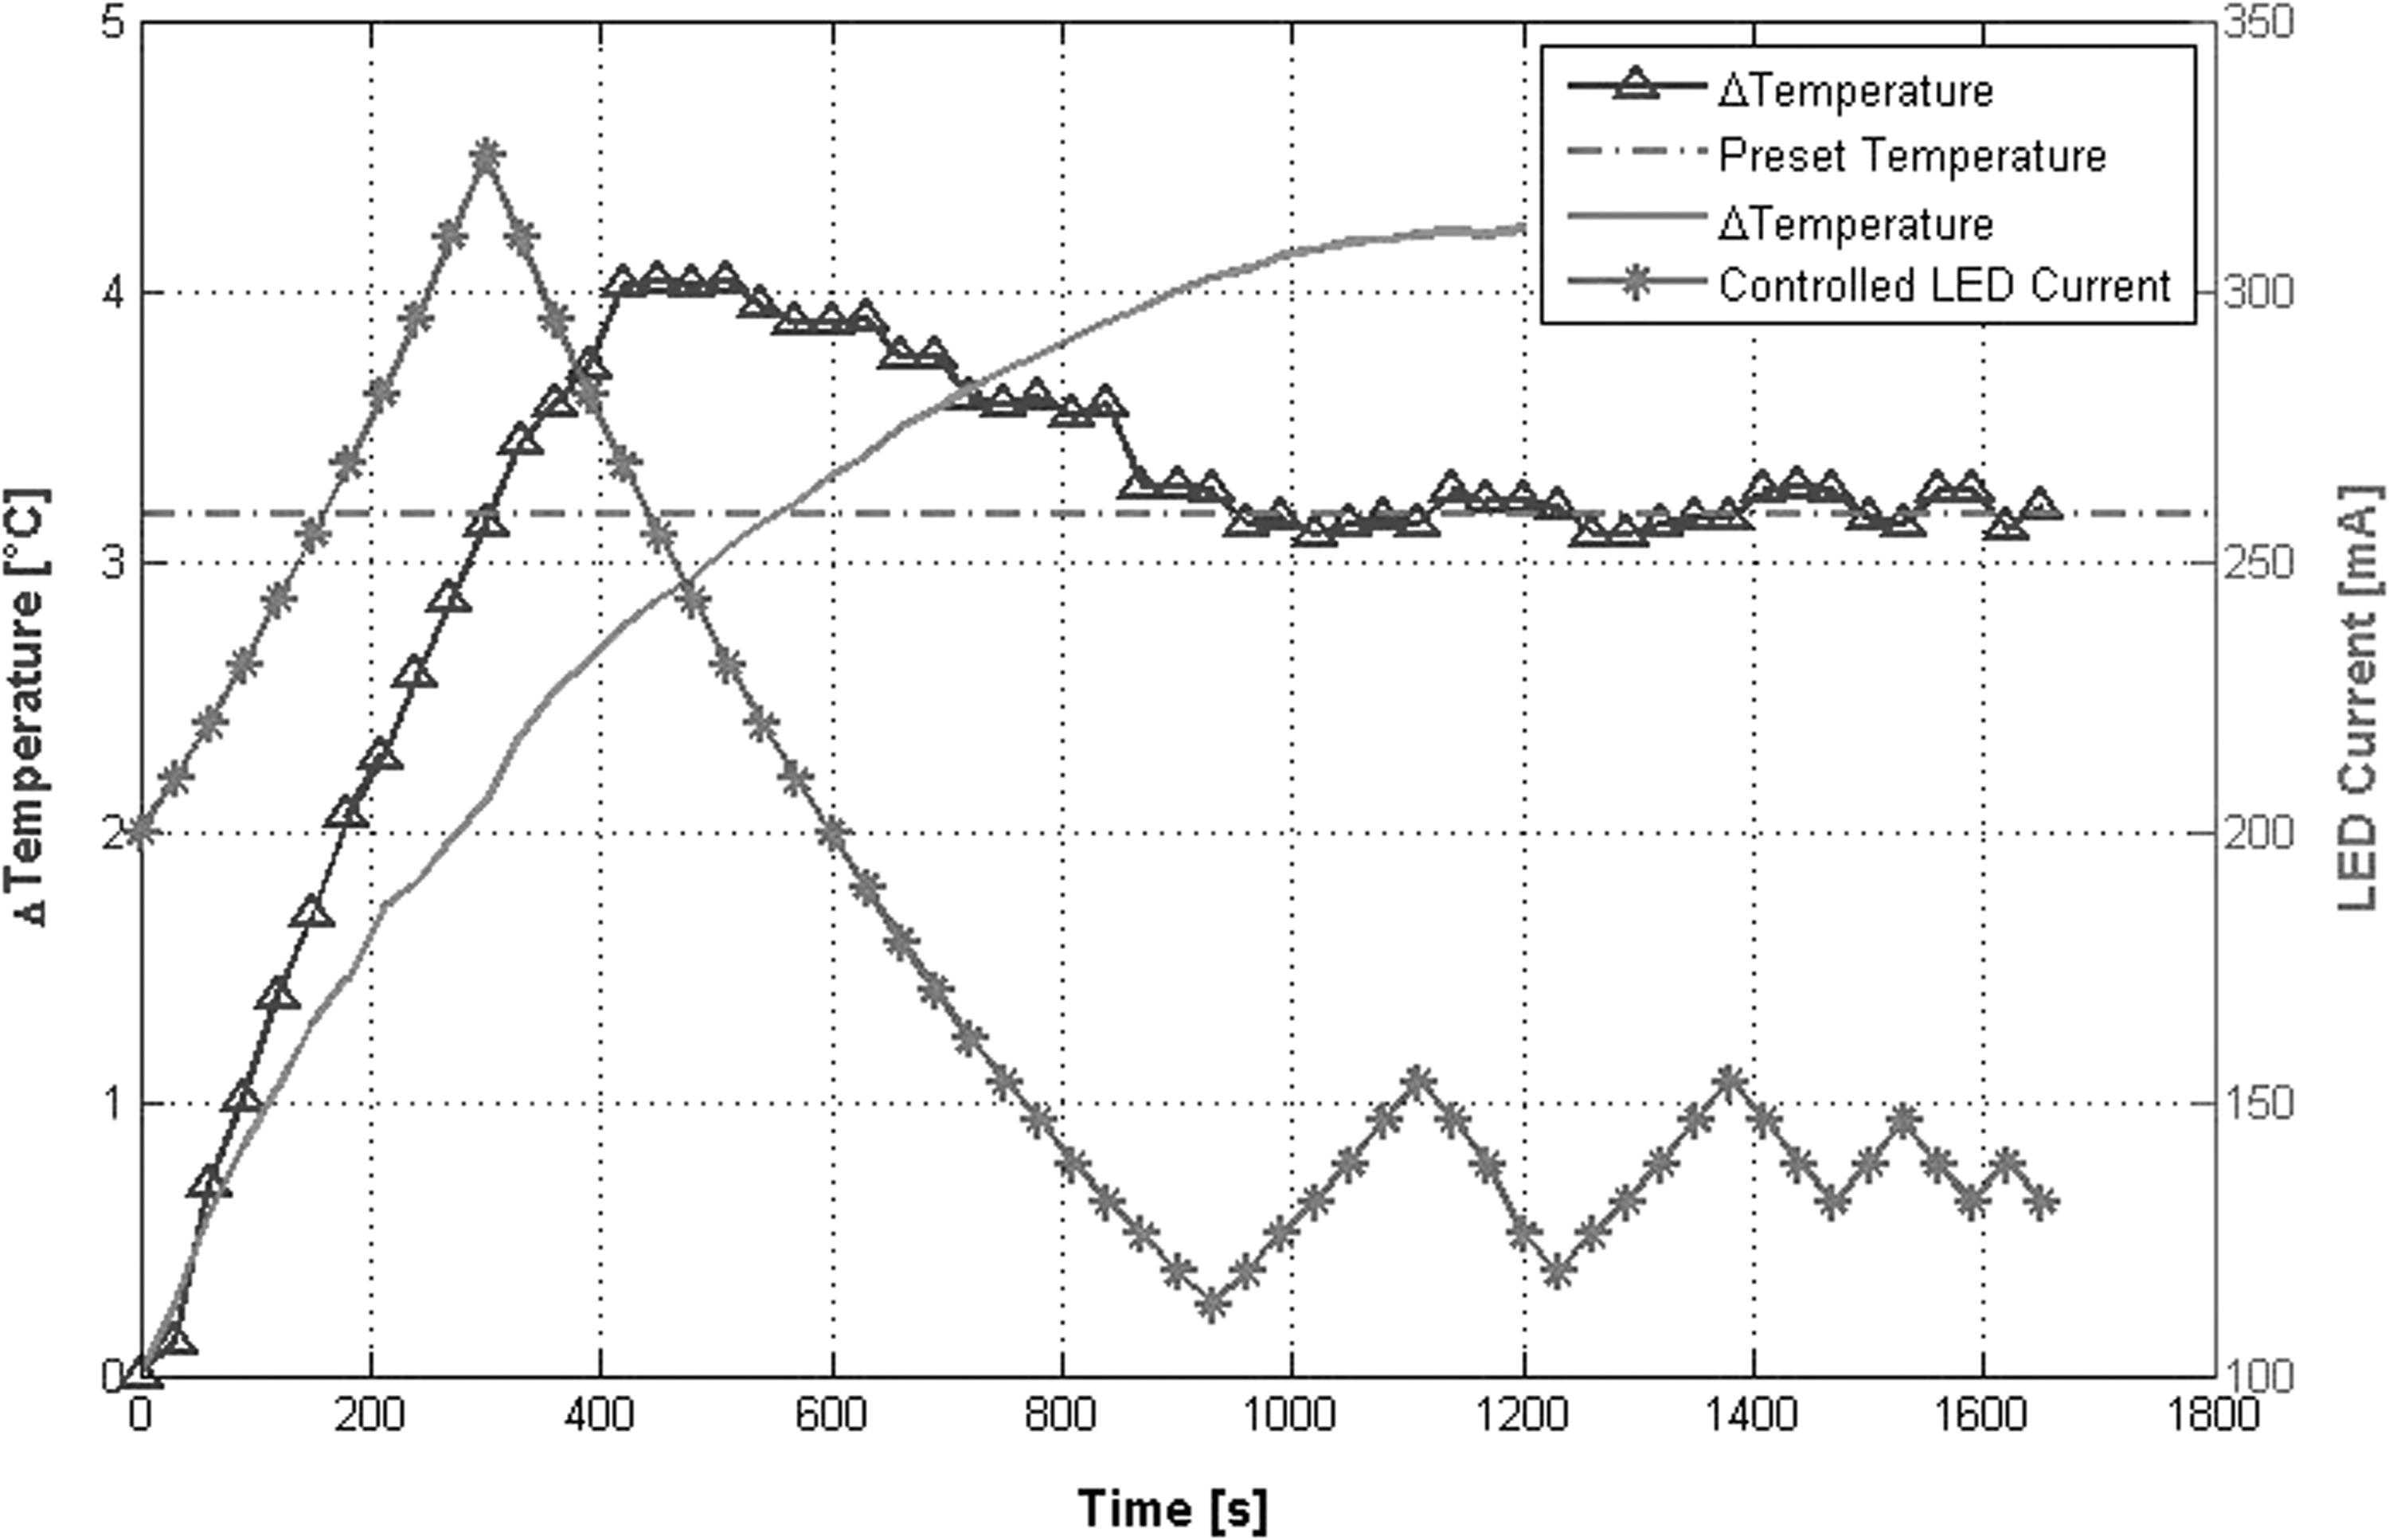
Temperature behavior and light-emitting diode (LED) current during the irradiation of the solution of methylene blue at 10% using control mode II.
The performance of the system in control mode II is presented in Fig. 8. These measurements were performed using the same experimental setup as mentioned previously, using an energy fluence of 150 mJ/cm2, and the irradiance of the well was set to 95 mW/cm2, which corresponds to a 200 mA current through the LED. The ambient temperature in this case was 22.8°C. The preset temperature value was 26°C. As can be seen from Fig. 8, if the temperature in the irradiation well is below the desired minimum irradiation temperature the current through the LED is increased until the preset minimum temperature threshold is crossed, after which the current is decreased so that the minimum irradiation threshold is approached from above. Again, the exposure time is constantly recalculated to administer the intended energy fluence. This mode allows the photoirradiation of the culture cells at a preset temperature value.
The influence of the irradiation of neighbor's wells on the spatial irradiance of a well was studied using the amber LED array to study the accuracy of the administered energy fluence. Table 1 shows the results of the measurement of the spatial irradiance caused by parasite light coming from neighboring wells for the different indicated irradiation combinations.
As can be seen from Table 1, the parasite light from surrounding sources decreases with distance. When all LED were turned on at maximum current, the irradiance from surrounding light sources is 8.29 mW/cm2, which is equivalent to 5.75% of the direct irradiance of well 6C.
Filling each empty and unirradiated well with a 1% methylene blue solution as an absorber, the irradiance interference between wells can be reduced (compare Table 2). When all LEDs in the array were turned on at maximum emission, the measured irradiance from all surrounding wells was found to be 3.91 mW/cm2, or ∼2.71% of the direct irradiance.
To study the maximal possible shielding of wells from parasite light irradiation, each of the wells that was not connected to a light guide was filled with undiluted methylene blue in order to absorb the light coming from the neighbors. The measurements of the resulting parasite irradiance are shown in Table 3. Using this setup configuration, the maximum value of parasite irradiance is 2.00 mW/cm2 when all LEDs are turned on, or 1.39% of the maximum direct irradiance.
The system has been used to study the effects of HYP mediated PDT in cultured cells. In Fig. 9, the results of cell survival of TPSA23 prostate cancer cells with different light doses is presented for a control group with no drug and a 1μg/mL of HYP treated to varying light doses at a light irradiance of 30 mW/cm2. The results are consistent with a good dosimetry and a minimization of induced errors caused by excessive manipulation.
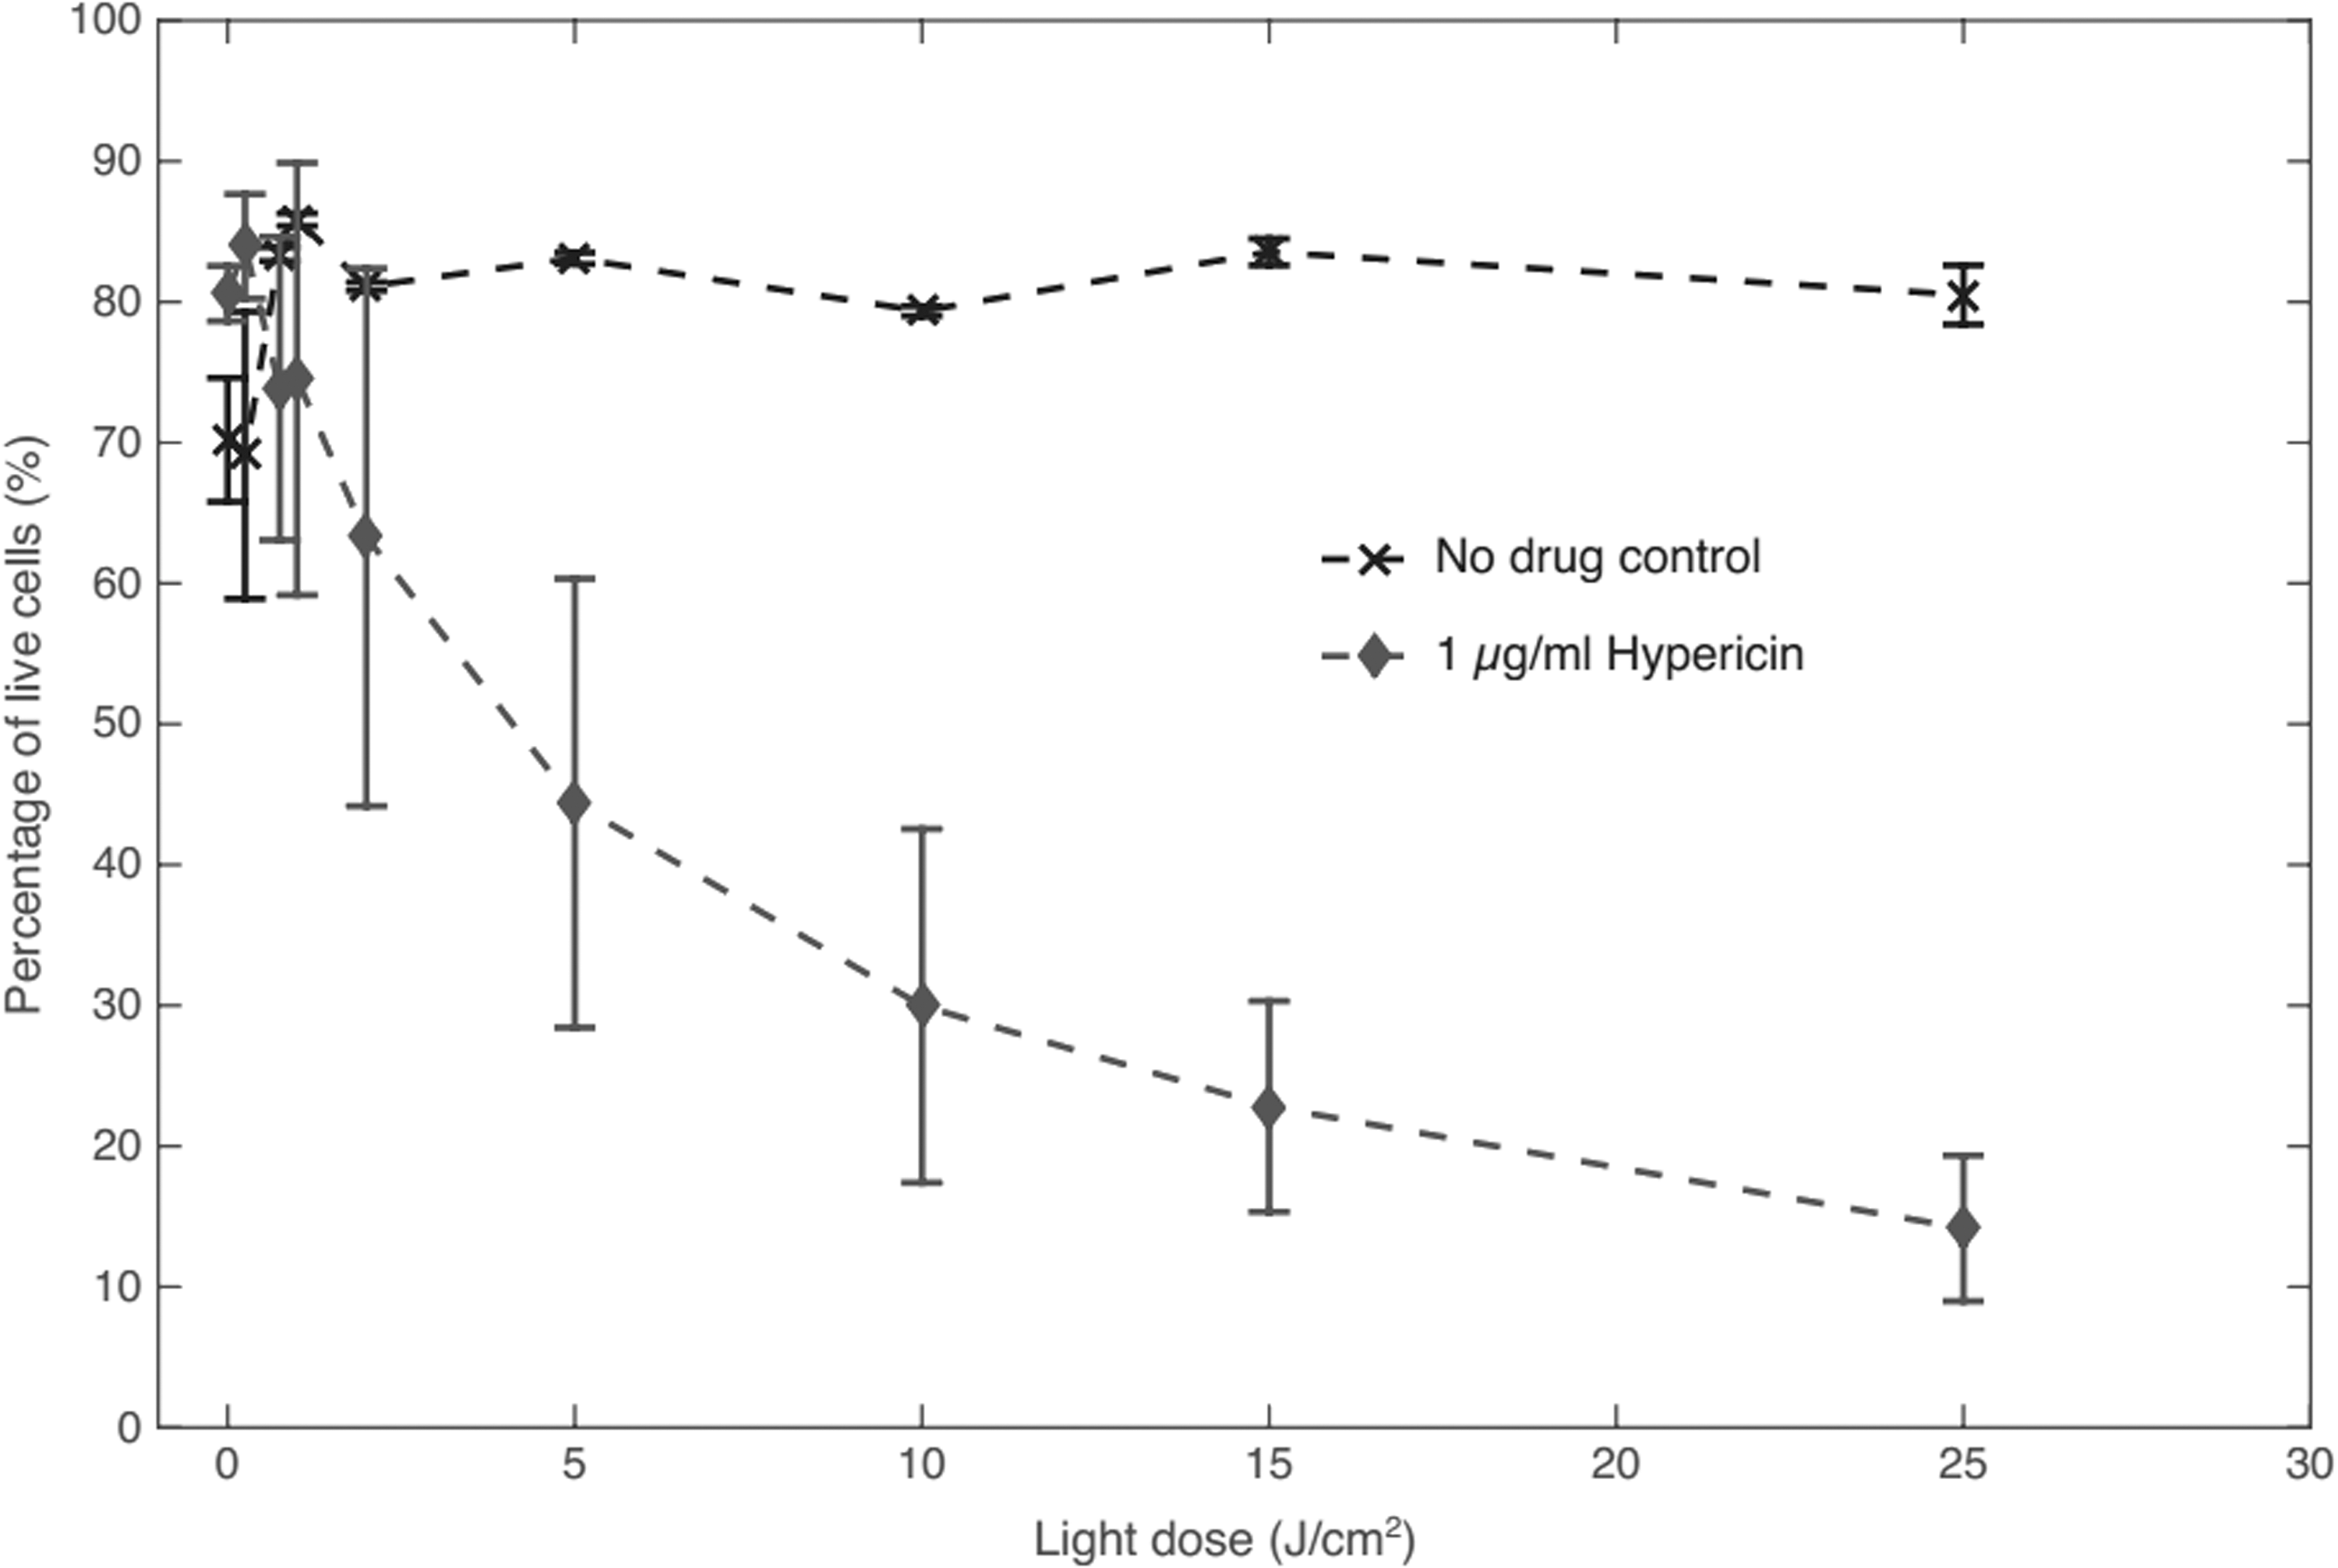
Cell survival measured by flow cytometry for TPSA23 prostate cancer cells treated to varying light doses at a light irradiance of 30 mW/cm2. Uncertainty bars represent ±1 standard deviation.
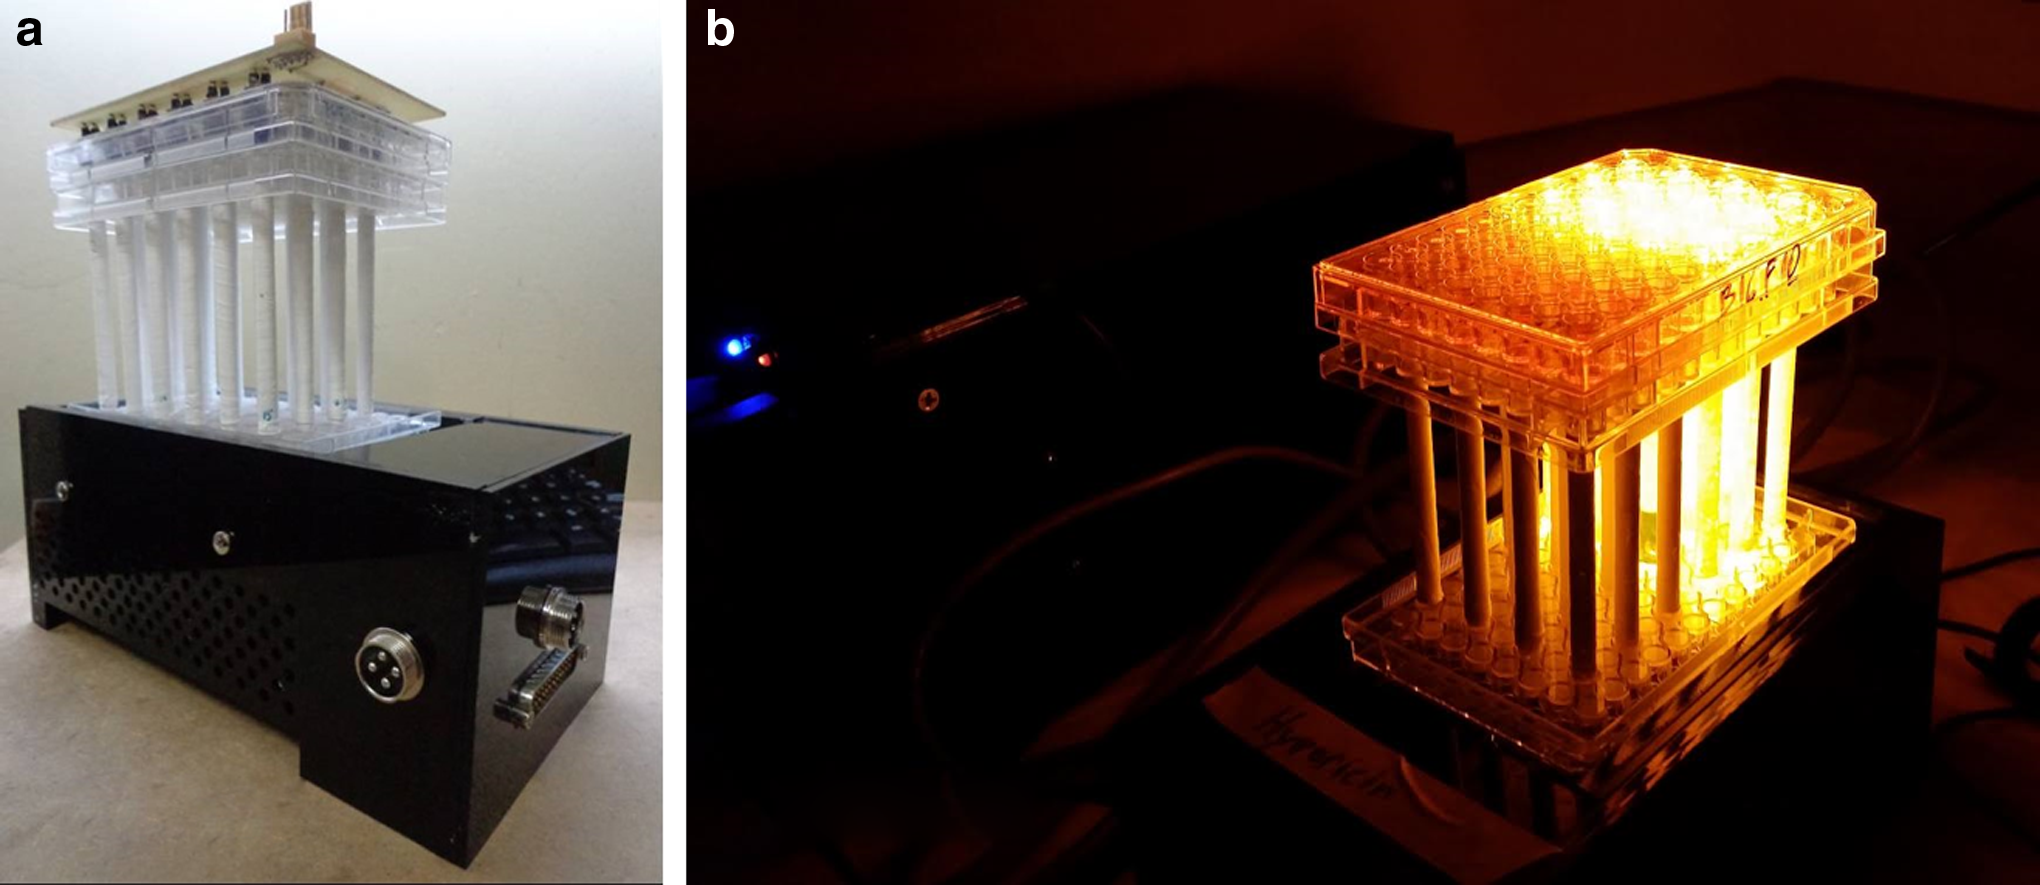
The system is shown in Fig. 10, where Fig. 10a shows the irradiation module with the properly placed multiwell plate and the thermal sensors on top of it, and Fig. 10b shows the working system with amber LEDs where half the wells are being irradiated.
Discussion and Conclusions
A novel device for the irradiation of 24 wells of a 96 multiwell plate using a LED matrix has been constructed. The developed system can be easily adapted to change the irradiation wavelength to match the absorption spectra of a specific PS or any other chromophore of interest. Also, the system allows one to independently control the optical power output, modulation frequency, and irradiation time of each of the 24 LEDs so that each well can be irradiated to a specific light energy fluence and modulation frequency up to 100 Hz, allowing one to design experiments in which the irradiation of cells to different light energy fluences can be initiated at the same time.
The system has been shown to work for two different temperature modes: (1) maximum allowable temperature and (2) minimum baseline temperature. These modes avoid the overheating of cell cultures above a temperature limit, and guarantee that the radiant energy fluence is administered at a certain preset temperature that allows the design of several photobiological experiments in vitro that involve the temperature as a parameter.
The contribution of neighboring irradiation on any given well is significant compared with direct irradiance. This effect can be reduced by filling each empty well with a light-absorbent fluid. The control software is being modified to recalculate the energy fluence, taking the expected spatial irradiance coming from the neighboring wells into account.
Footnotes
Acknowledgments
This work was supported in part by the Instituto de Ciencia y Tecnología del Distrito Federal-México through grant No. PICSA 11-41 to SSI.
Author Disclosure Statement
No competing financial interests exist.